The Fourth Turning
Chapter 3: The Why

The Memo:
To:
Everyone
From:
Mr. Awsumb
Re:
The weekly EFFing updates
The Human element of markets
Welcome to all the new colleagues. I’m glad to have you hear.
This is chapter 3 of What started in:
If you haven’t read them yet, you’ll still understand this one start to finish.

Please remember to CC your colleagues. I’m sure I forgot to include someone.
Nothing contained in this writing is financial or investment advice. It is for educational and research purposes only.
End Memo.
The Report
Niel Howe and William Strauss’ The Fourth Turning breaks down the cyclical nature of life and events. I’ve added commentary to the left here of the Fourth Turning breakout of of the seasons of life. As we emabrk upon the Fourth Turning, we also are embarking upon the Fourth Rate Turning of the 21st Century. The timeline of each lines up closely, and we’re in the “Crisis” stage, or Winter of the current 80 year cycle.

If' you’re unfamiliar, here’s an excellent 8 minute primer:
The reason I added, as the EFFing Memo’s will continue to show, the effect on the economy, or business cycles by the Federal Funds rate changes. As I’ve stated, I don’t believe this is a mathematical calculation for proving an exact date to an event, but it is a way to measure the very repeatable human behavior in response to the experiment of federal funds rates being adjusted.
The natural order of efforts in business is expansion, and the natural effect of the Fed raising rates is to slow that expansion (of the monetary/credit cycle). After all, does anyone endeavor to fail? As the human endeavor to continue to expand becomes more and more frustrated by the draggin/slowing effect (I.E. Resistance) that rates are put onto them as they “peak”, that’s when we start to see “problems”. Or like the cycles illustrated below, receding.

It’s important to include humans in this situation, not just data. Thinking with the seaons in mind, we can break that down even further into repeatable behavioral patterns.
Using this framework, we can see the Stages and Archetypes of the Cycle.

There are 4 Archetypes in the 4 Seasons. 1 for each season.
Interestingly, There are 12 Archetypes. And they can further be broken down into 4 distinct “Base” Archetypes, from which all the others are a combination of. Like the seasons and stages.

Everyone is some combination of these. Or can become a different one at some point in their life, by need or by choice.
If you think in terms of a color wheel, you have Primary Colors and Secondary Colors.

Each of us takes on some form of the Archetype of our paternal influences. The further into the cycle or changing of the seasons we get, the more we begin to recognize those influences in our own life, despite being our own Archetype. And as a parent, you will often see the Archetype that you don’t recognize within yourself or your child’s other parent, shine through in them. You recognize they’re their own person.
Even genetically, we see this mixing in a cyclical form:

This is important, again because economics can’t ignore human behavior. The Rational or Irrational. You can see these realities in the chart below, which should need no introduction.

However, what this chart really does, is describe the seasons of, behavior of and emotional reaction to, the business cycle. This is literally just a depiction of the business cycle, because the previous depiction of it shows a perfect curvature, which doesn’t exist in nature. It wasn’t until Benoit Mandelbrot gave us fractals that real computer 3d modeling and mapping were possible, because our very fabric of existence doesn’t consist of such perfectly smooth surfaces as depicted by “The Business Cycle” chart.
Let’s substitute Mania with my quote from earlier:
As the human endeavor to continue to expand becomes more and more frustrated by the dragging/slowing effect (I.E. Resistance) that rates are put onto them as they “peak”, that’s when we start to see “problems”.
Let’s just rename all those phases from the chart:
Instead of Stealth: Inception (everyone has to start somewhere)
Instead of Awareness: Improvement (the next iteration of success)
Instead of Mania: A Peak. In your efforts, and the return from your labor. But without rest, your efforts will eventually wane, as your engery level begins to decline. So too your business can become stagnant without fresh efforts to win new business or without reinvesting in it.
Instead of Blow Off: Rest and Recovery so that the cycle can begin again. Or in the case of the business, the time to reiterate what does and doesn’t work well and deploy the next strategy for growth.
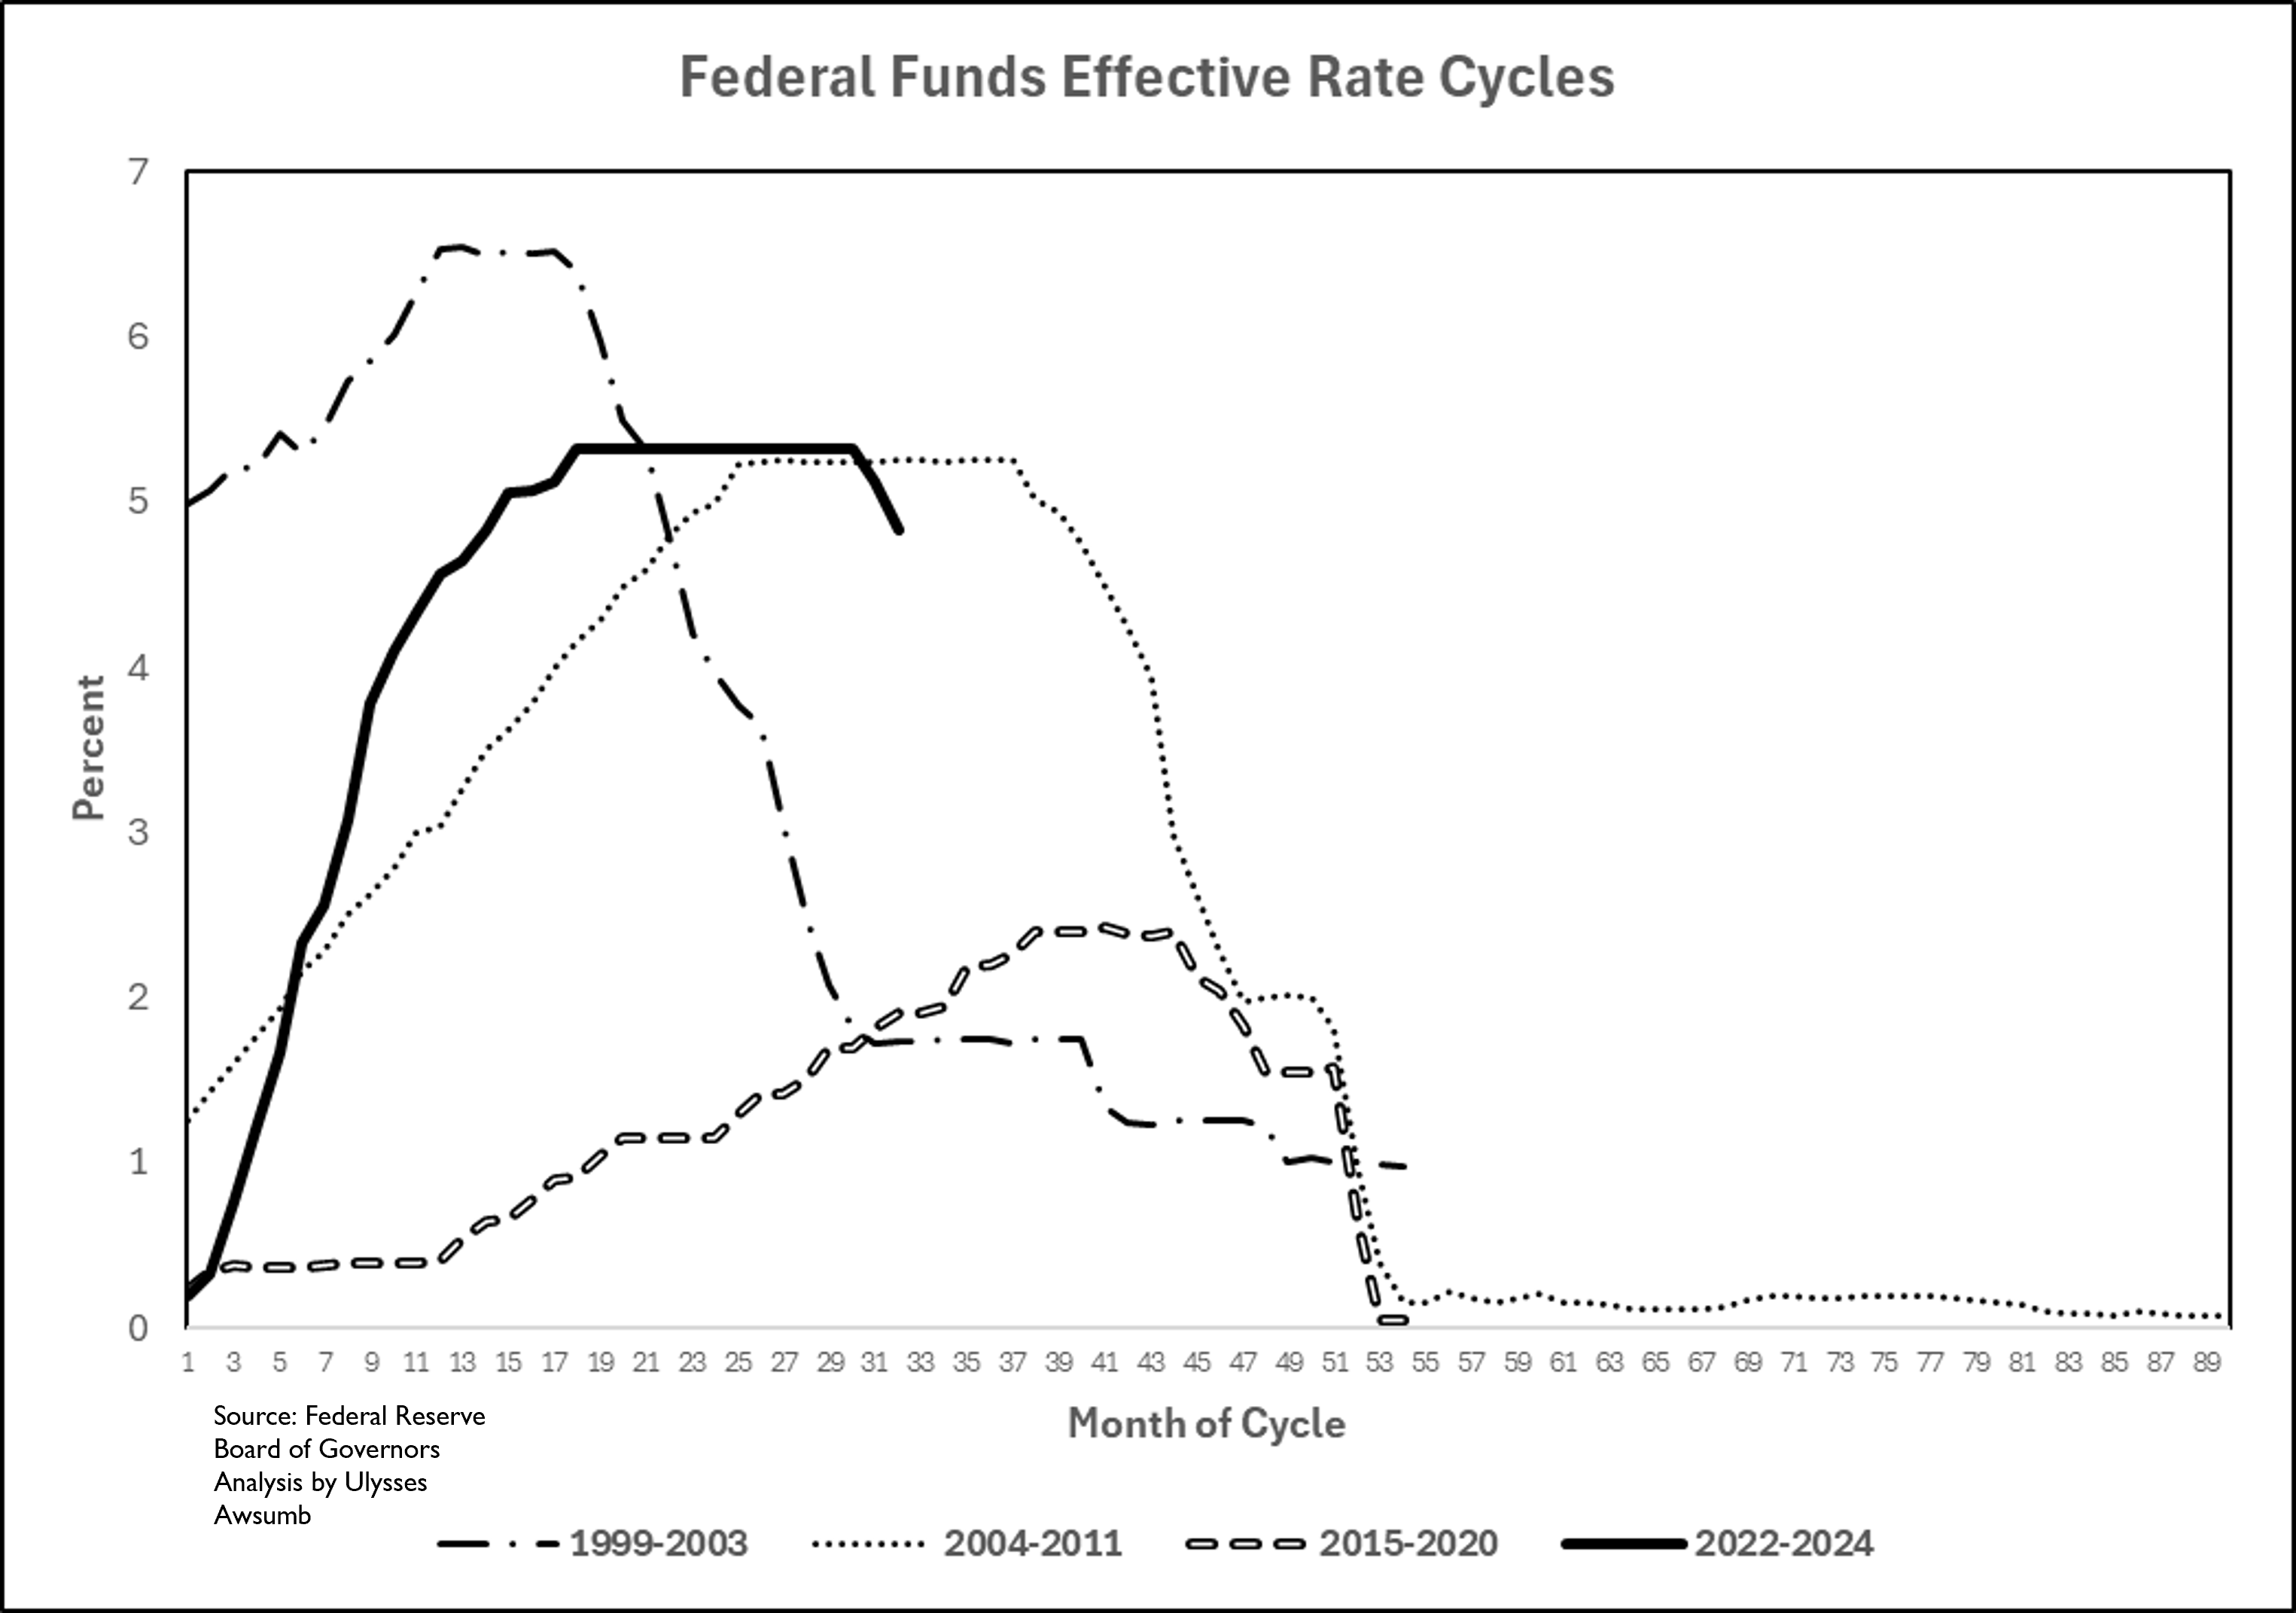
With all this in mind, the seasons and cycles consist of roughly 4 stages each. This is the study of the Resistance on the business cycle, particularly the 21st century and current moment in Time of The Federal Funds Effective Rates.
Because the constant behavior from each of the other Archetypes that can and do alter economies, time after time, seemed important.

Each component can be measured, indexed to the Start date of the day that Rate cycles begin (First time the Fed raises rates)
The Example:

And now, the 8th Wonder of the World (just kidding, compound interest holds that title):

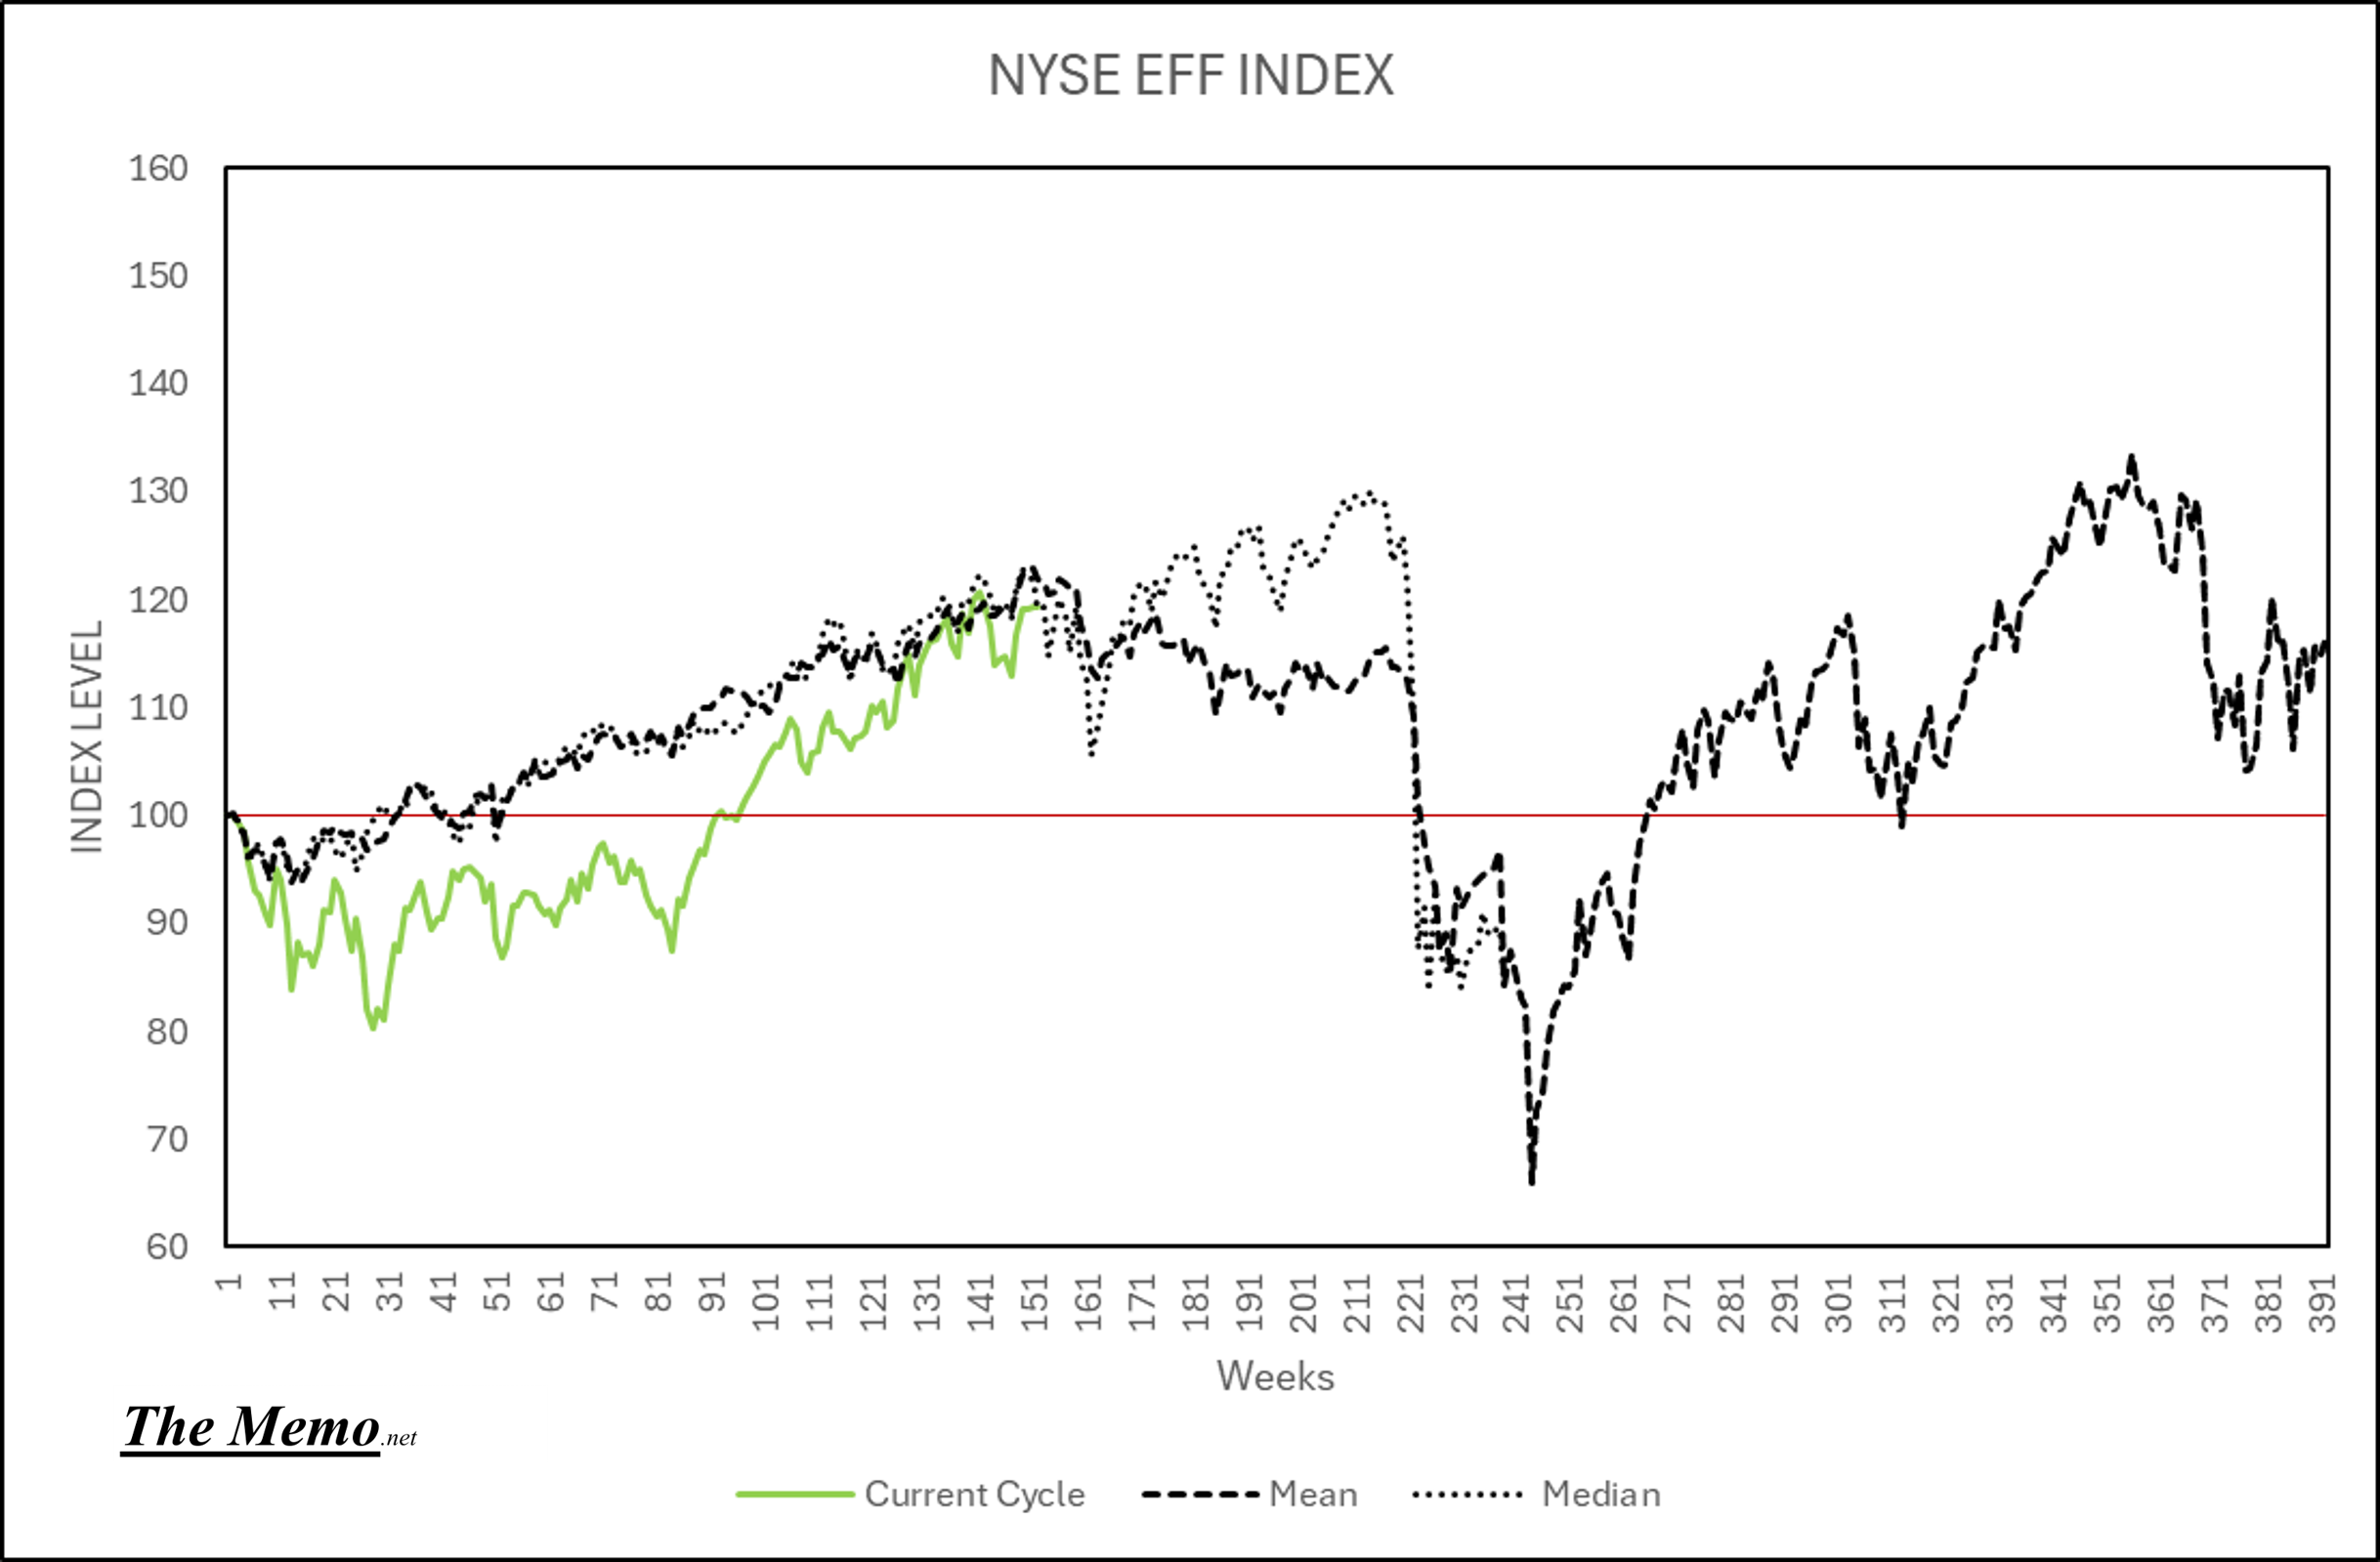
Here’s where we get back to Humans. This is the exact same chart, with 3 components added. Those components are:
The Trendlines of:
The Current iteration of the NASDAQ forming the top directional arrow
The First cycle starting at 1980 forming the horizontal arrow
The 1999-03 cycle forming the bottom arrow
These three give us directional boundaries
Storypoles at the weeks where majority of changes of direction develop (momentum/behavior/sentiment shifts)
And The Mean Federal Funds Rate of these 8 cycles from first raise to trough.

And we get the initial impact, behavioral volatility, violently reactionary and recovery stages. As in.
“As the human endeavor to continue to expand becomes more and more frustrated by the dragging/slowing effect (I.E. Resistance) that rates are put onto them as they “peak”, that’s when we start to see “problems”.
Or going back to the Seasons terminology you get:

With time stamps, of both the periods of each season, and directional shifts. We are at week 153. We are 3 weeks from typical stage of shifting. By the way, January New Home Sales numbers publish in 3 weeks. Coincidence?
Now, knowing what we do about Archetypes, we can even translate this into Storytelling, using the classical 4 act structure of the markets and people’s behavior:

Let there be light.

A story in 4 parts, on one chart, as told from the perspective of having to be in charge of managing the rate changes. (a la the Chairman) Techincal analysis mine.


© War Games; Universal Artists/MGM
To tie this all together, terms like:
Flight to safety
Saftey Trade
New paradigm
Fear
Capitulation
Mania
All exist because of the human involvement regarding the cyclical nature of business. The Archetypes at play, like the seasons: stemming from one of the 3 drivers amongst the 4 basic Archetypes:
The Soul, Self and Ego.

And our reaction to the phases: inception /starting, becoming aware of and responding to changing conditions like risk (Improvement) while fighting to expand, finding safety, and returning to the natural state or resting to start again. Spring, Summer, Fall, Winter.
In storytelling format,

And Now for your EFF Indices updates:
Nasdaq
The last 8 cycles. I’ve added two sets, one for those viewing on their email and one for those on the site/app.


Major Indices


Yields


Commodities

The American Breakfast Commodities.

If like me, you prefer the 3 act story structure. A good old Beginning, Middle and End. Or even like a great Trilogy. It’s my Precious……

This week is the week that ended:
October 5th 2018
May 25th 2007
March 15th 2002
November 8th 1996
September 8th 1989
January 24th 1986
The 1980 Cycle Was Over
In EFFing Time.