

Return Of The Je..... Mortgage
Trading at the same level as 1983


The Memo:
Re:
Commercial Real Estate markets: Episode VI
From:
Mr. Awsumb
Comments:
To put context on the slowdown in commercial real estate, let's take a look at Commercial Real Estate mortgage asset transactions.
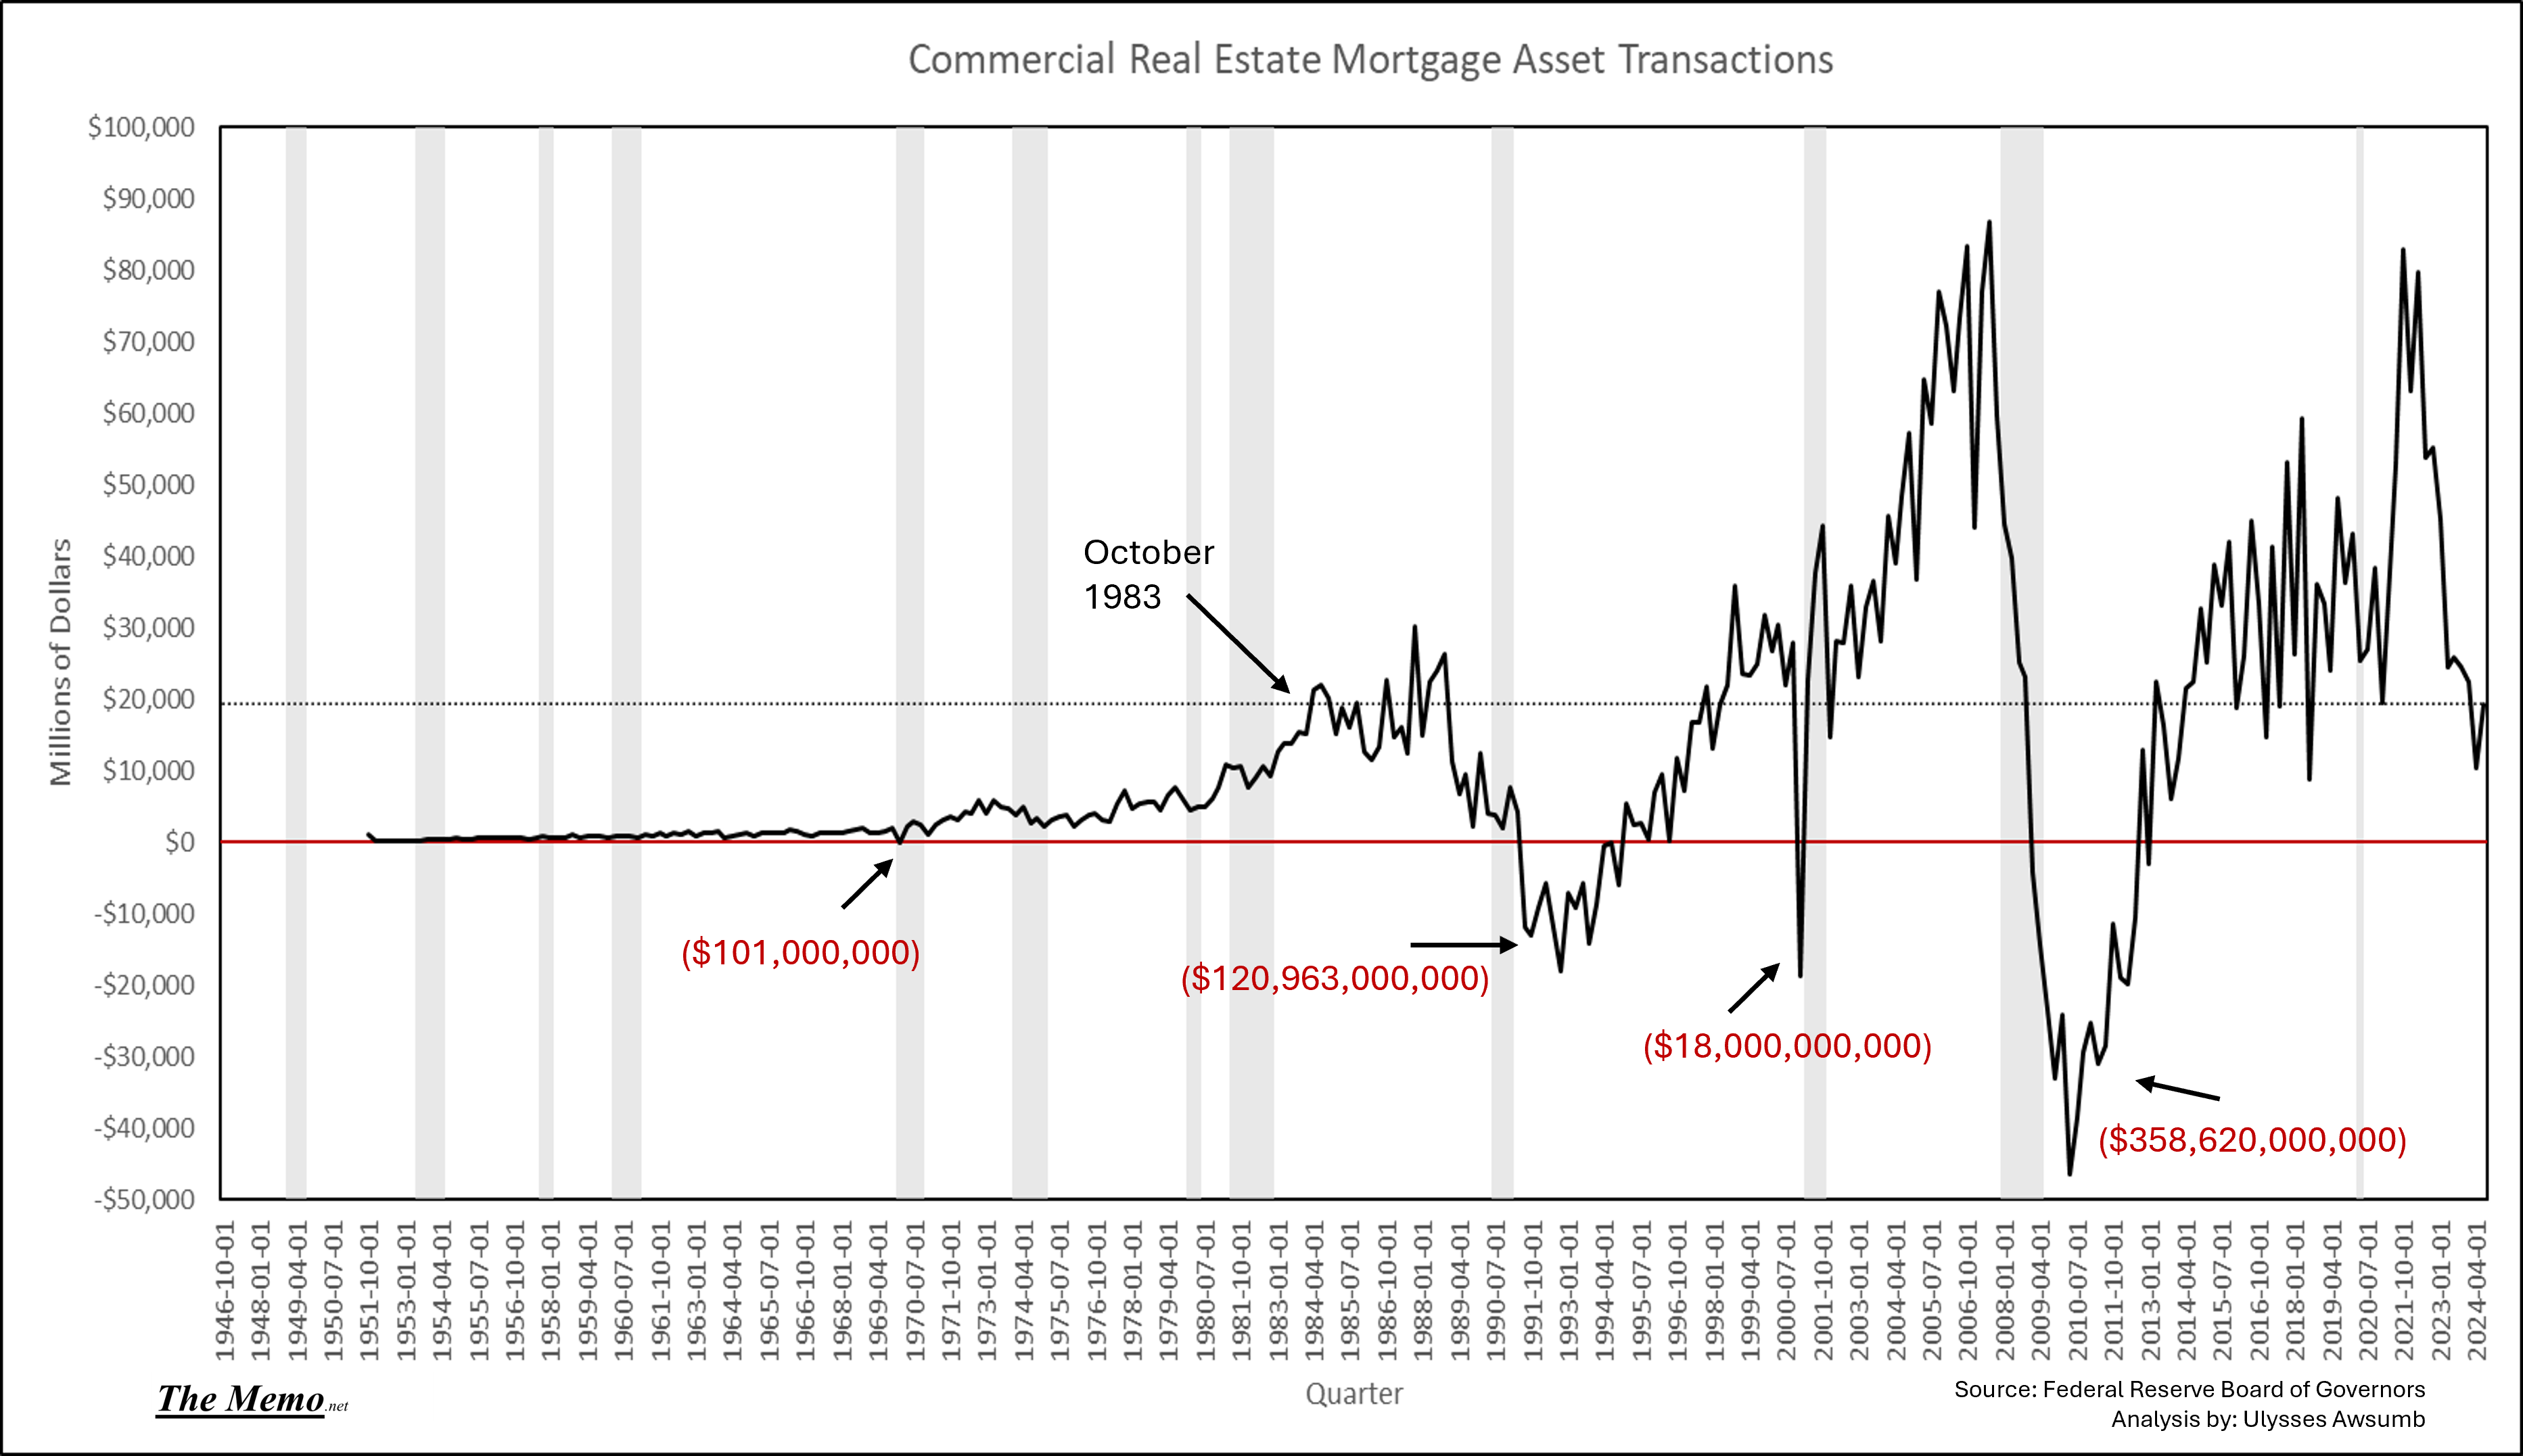
These are primary and secondary, whole loan/note/mezzanine assets. They include securities issued from mortgages by REITs as well. And they’re tracked by and published via the Federal Reserve BOG (Board of Governors) in the Z.1 accounts and flow of funds for the US.
The transactions are tracked as the change of levels. From the Federal Reserve, these are:
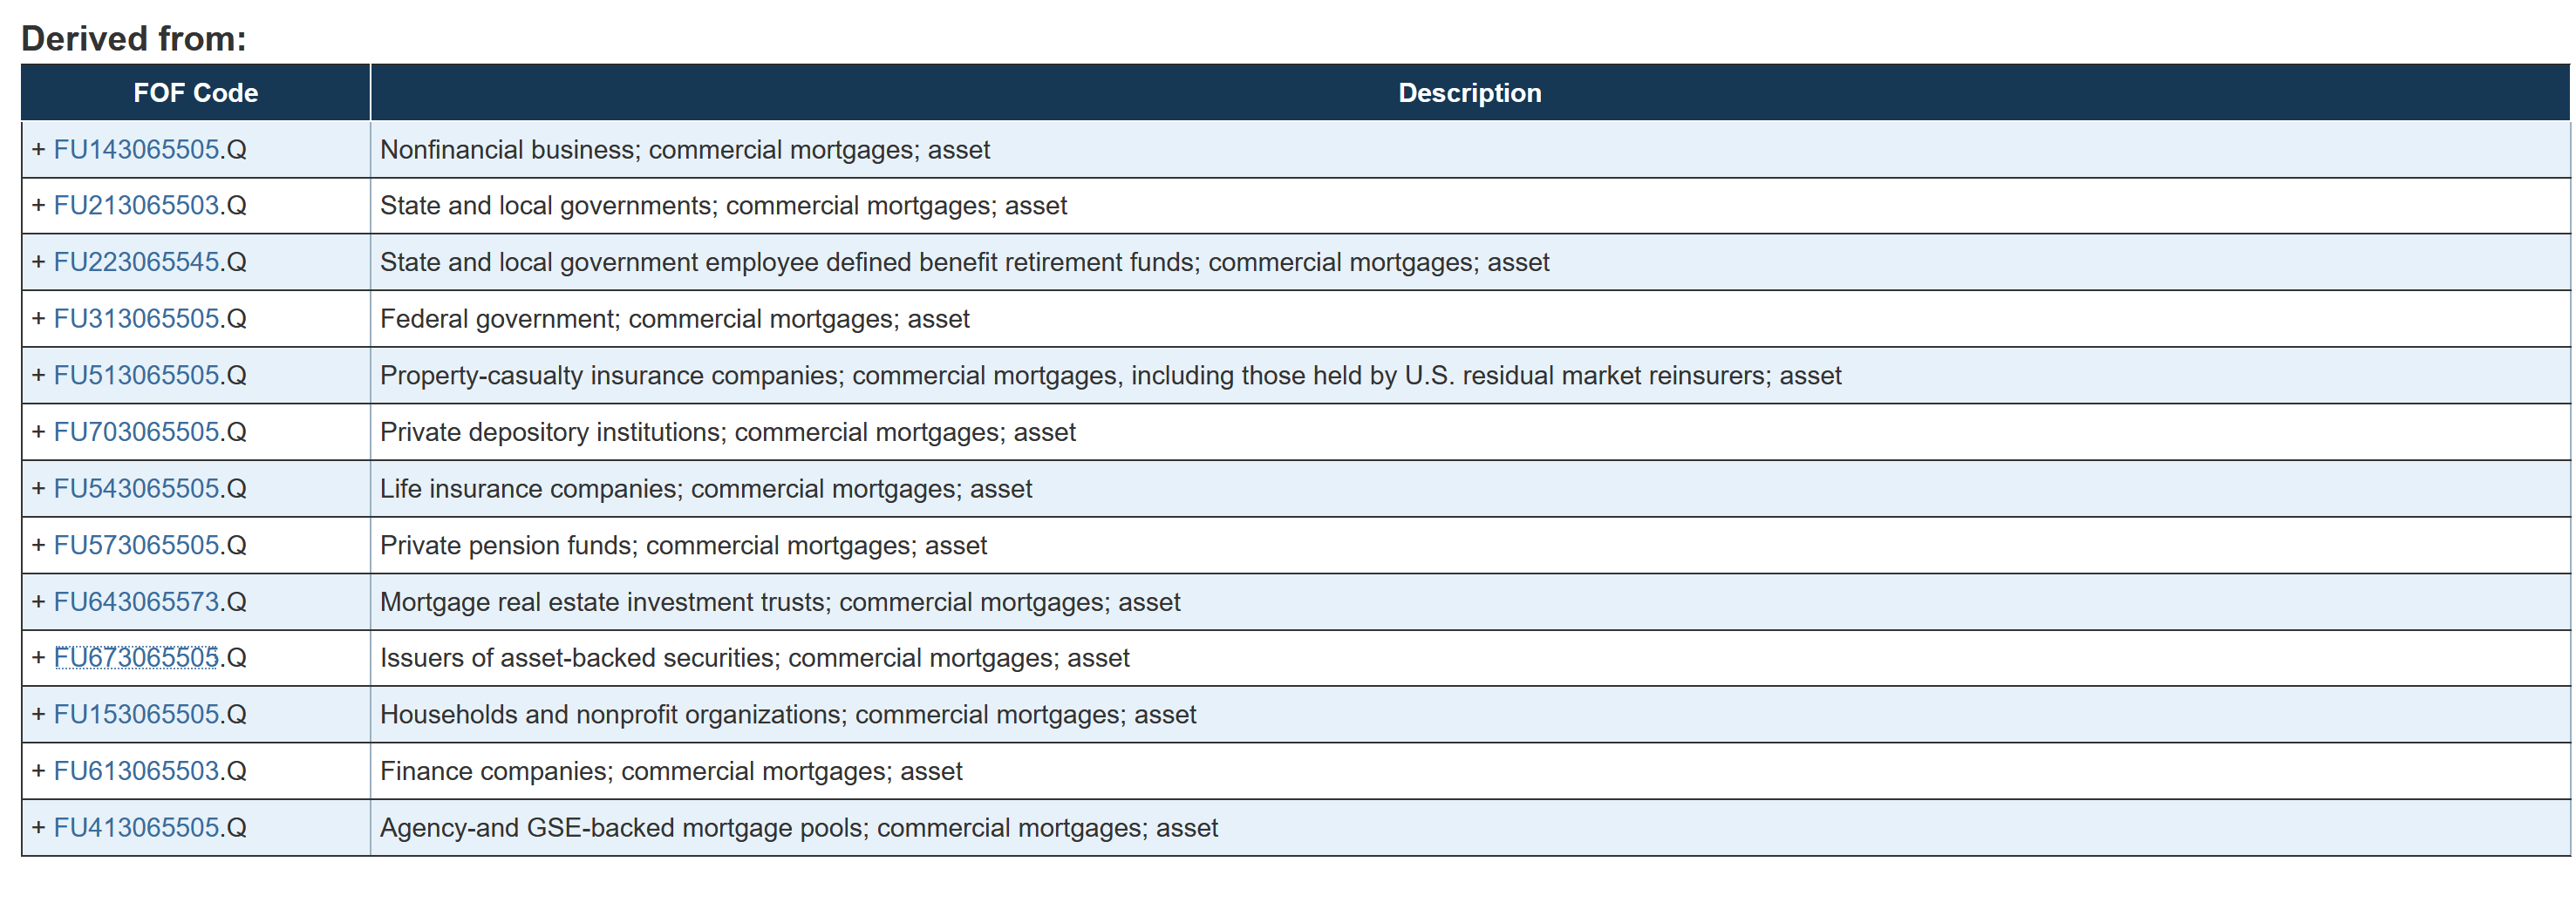
This information is published, in reverse, (backward looking: George Lucas would be proud) on a quarterly basis. So we currently only have Q3 data for 2024. But as we all know, mortgage rates have only skyrocketed since Q3’s end (Revenge of the Sith), which coincides with the Federal Reserve’s jumbo rate cut/cutting cycle start.
While Q3 saw modest improvement, it was coming off dollar levels last seen in Q3 of 1983.
A long time ago, in a Galaxy far far away……
As in the year this movie was released, then in its 6th month at the box office, having grossed $250+ Million.

end memo
The Research
That’s a 76% decline in dollar terms, since this cycle’s peak. I noted the dollar value losses, by time period in the first chart, as this series tracks the destruction in dollar value of mortgage assets (as in, the losses on mortgages, notes etc in excess of property value losses realized by operators/owners) which is far more useful than hoping the price indices use of the Force “mumbo jumbo” to show reality.
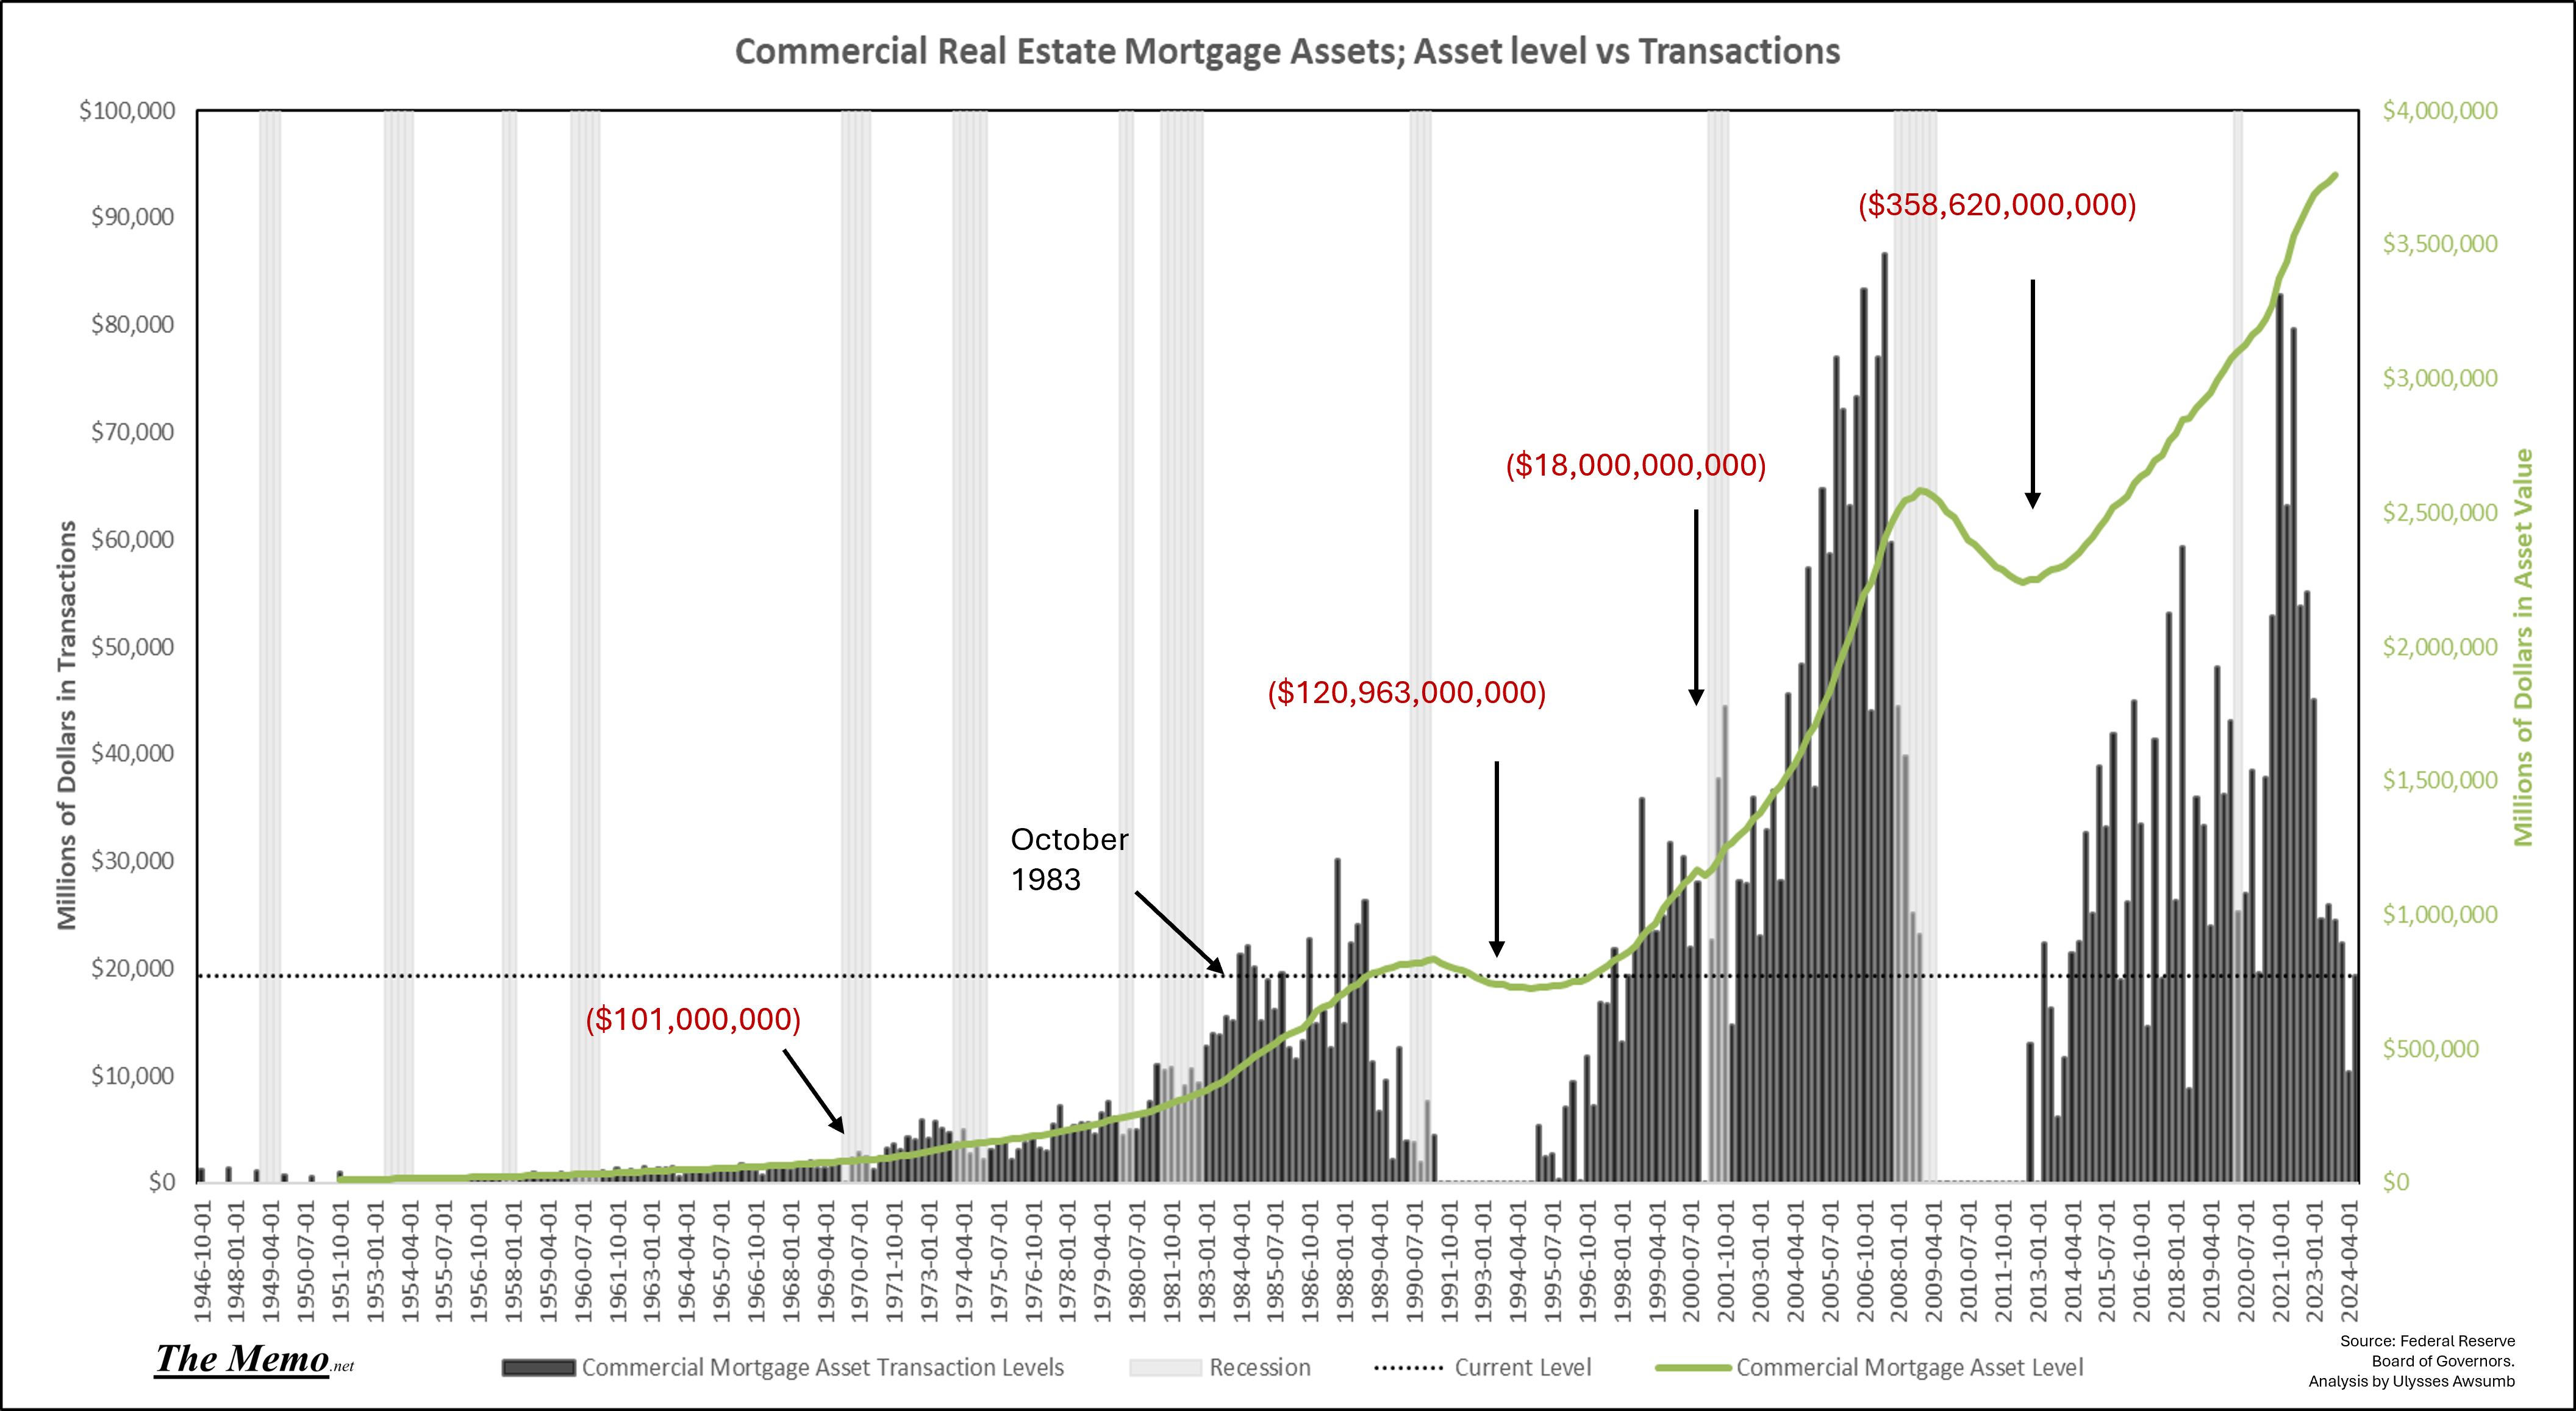
For clarity, here’s mortgage asset transaction levels, in millions of dollars (left axis) vs asset value of mortgage assets (right axis) in millions of dollars. I removed the negative territory (left axis) to show the baseline of asset level value (right axis), and included the dollar amounts of losses in the negative value space.
Let’s compare that with performance of Real Estate Loans for commercial properties, in all commercial banks:
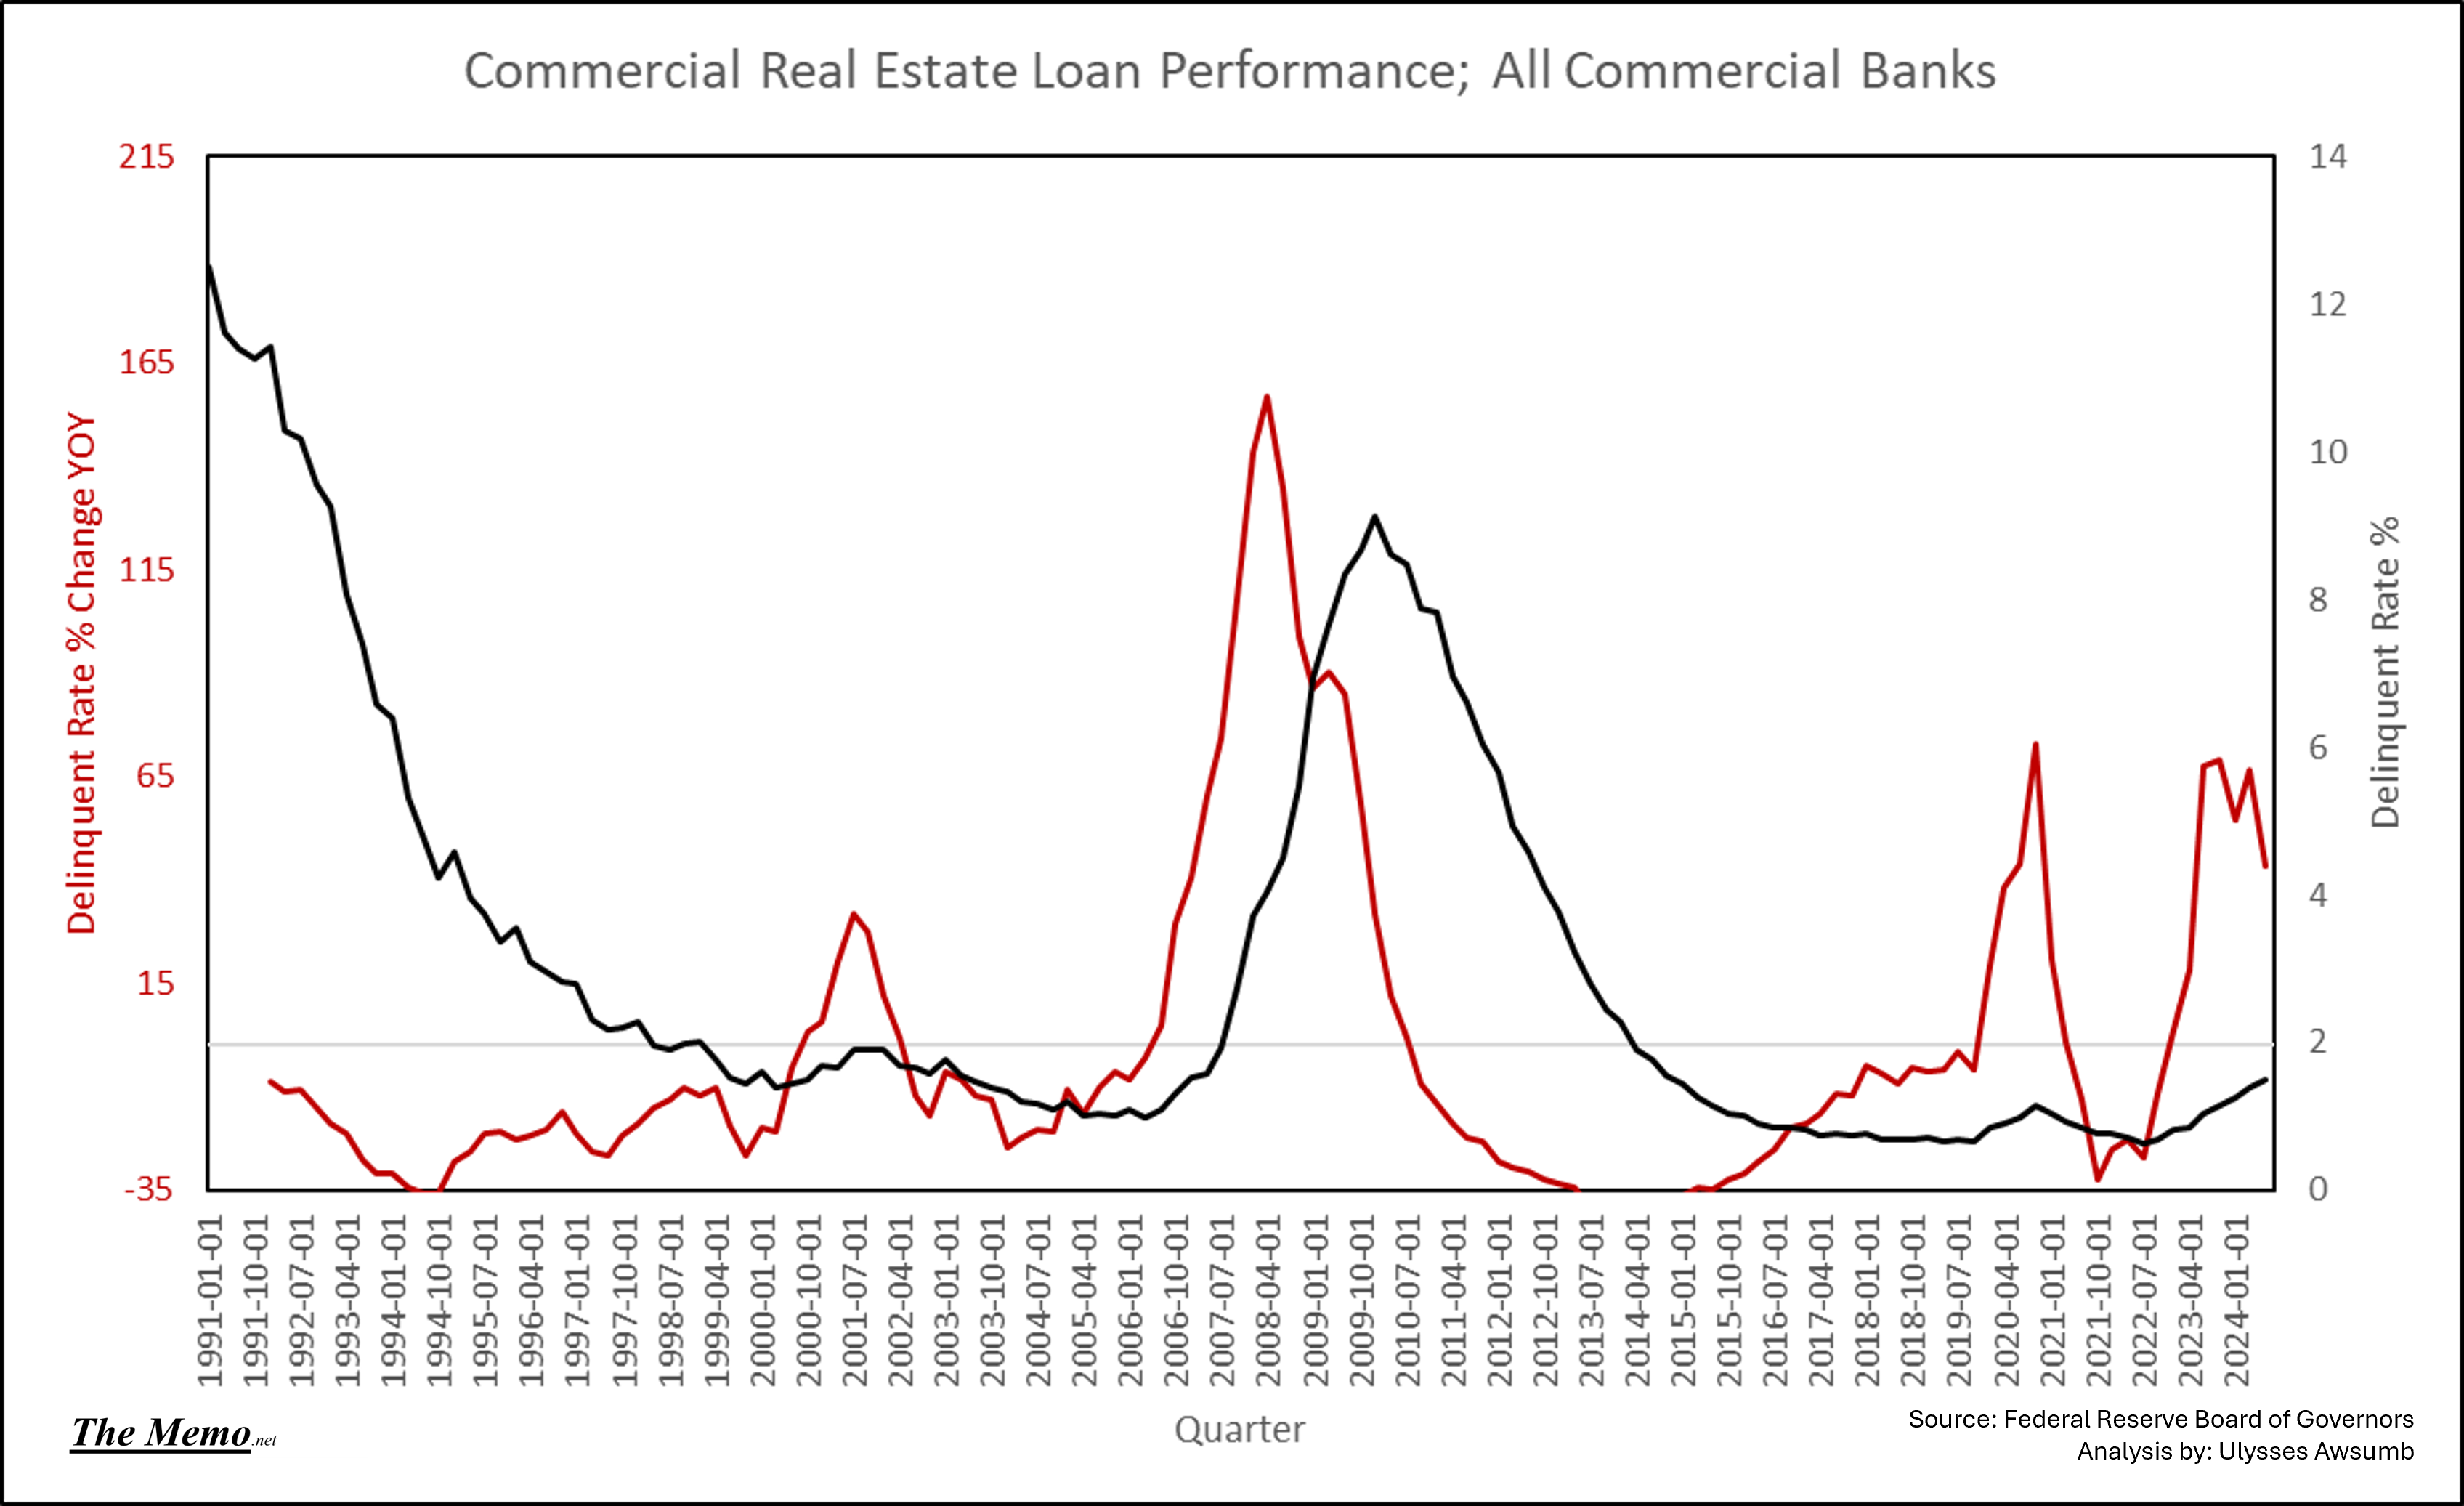
Please note, the year over year changes (Left/Red) begin before the actual delinquency rate peak. Now compare this with Mortgage Asset Transactions:
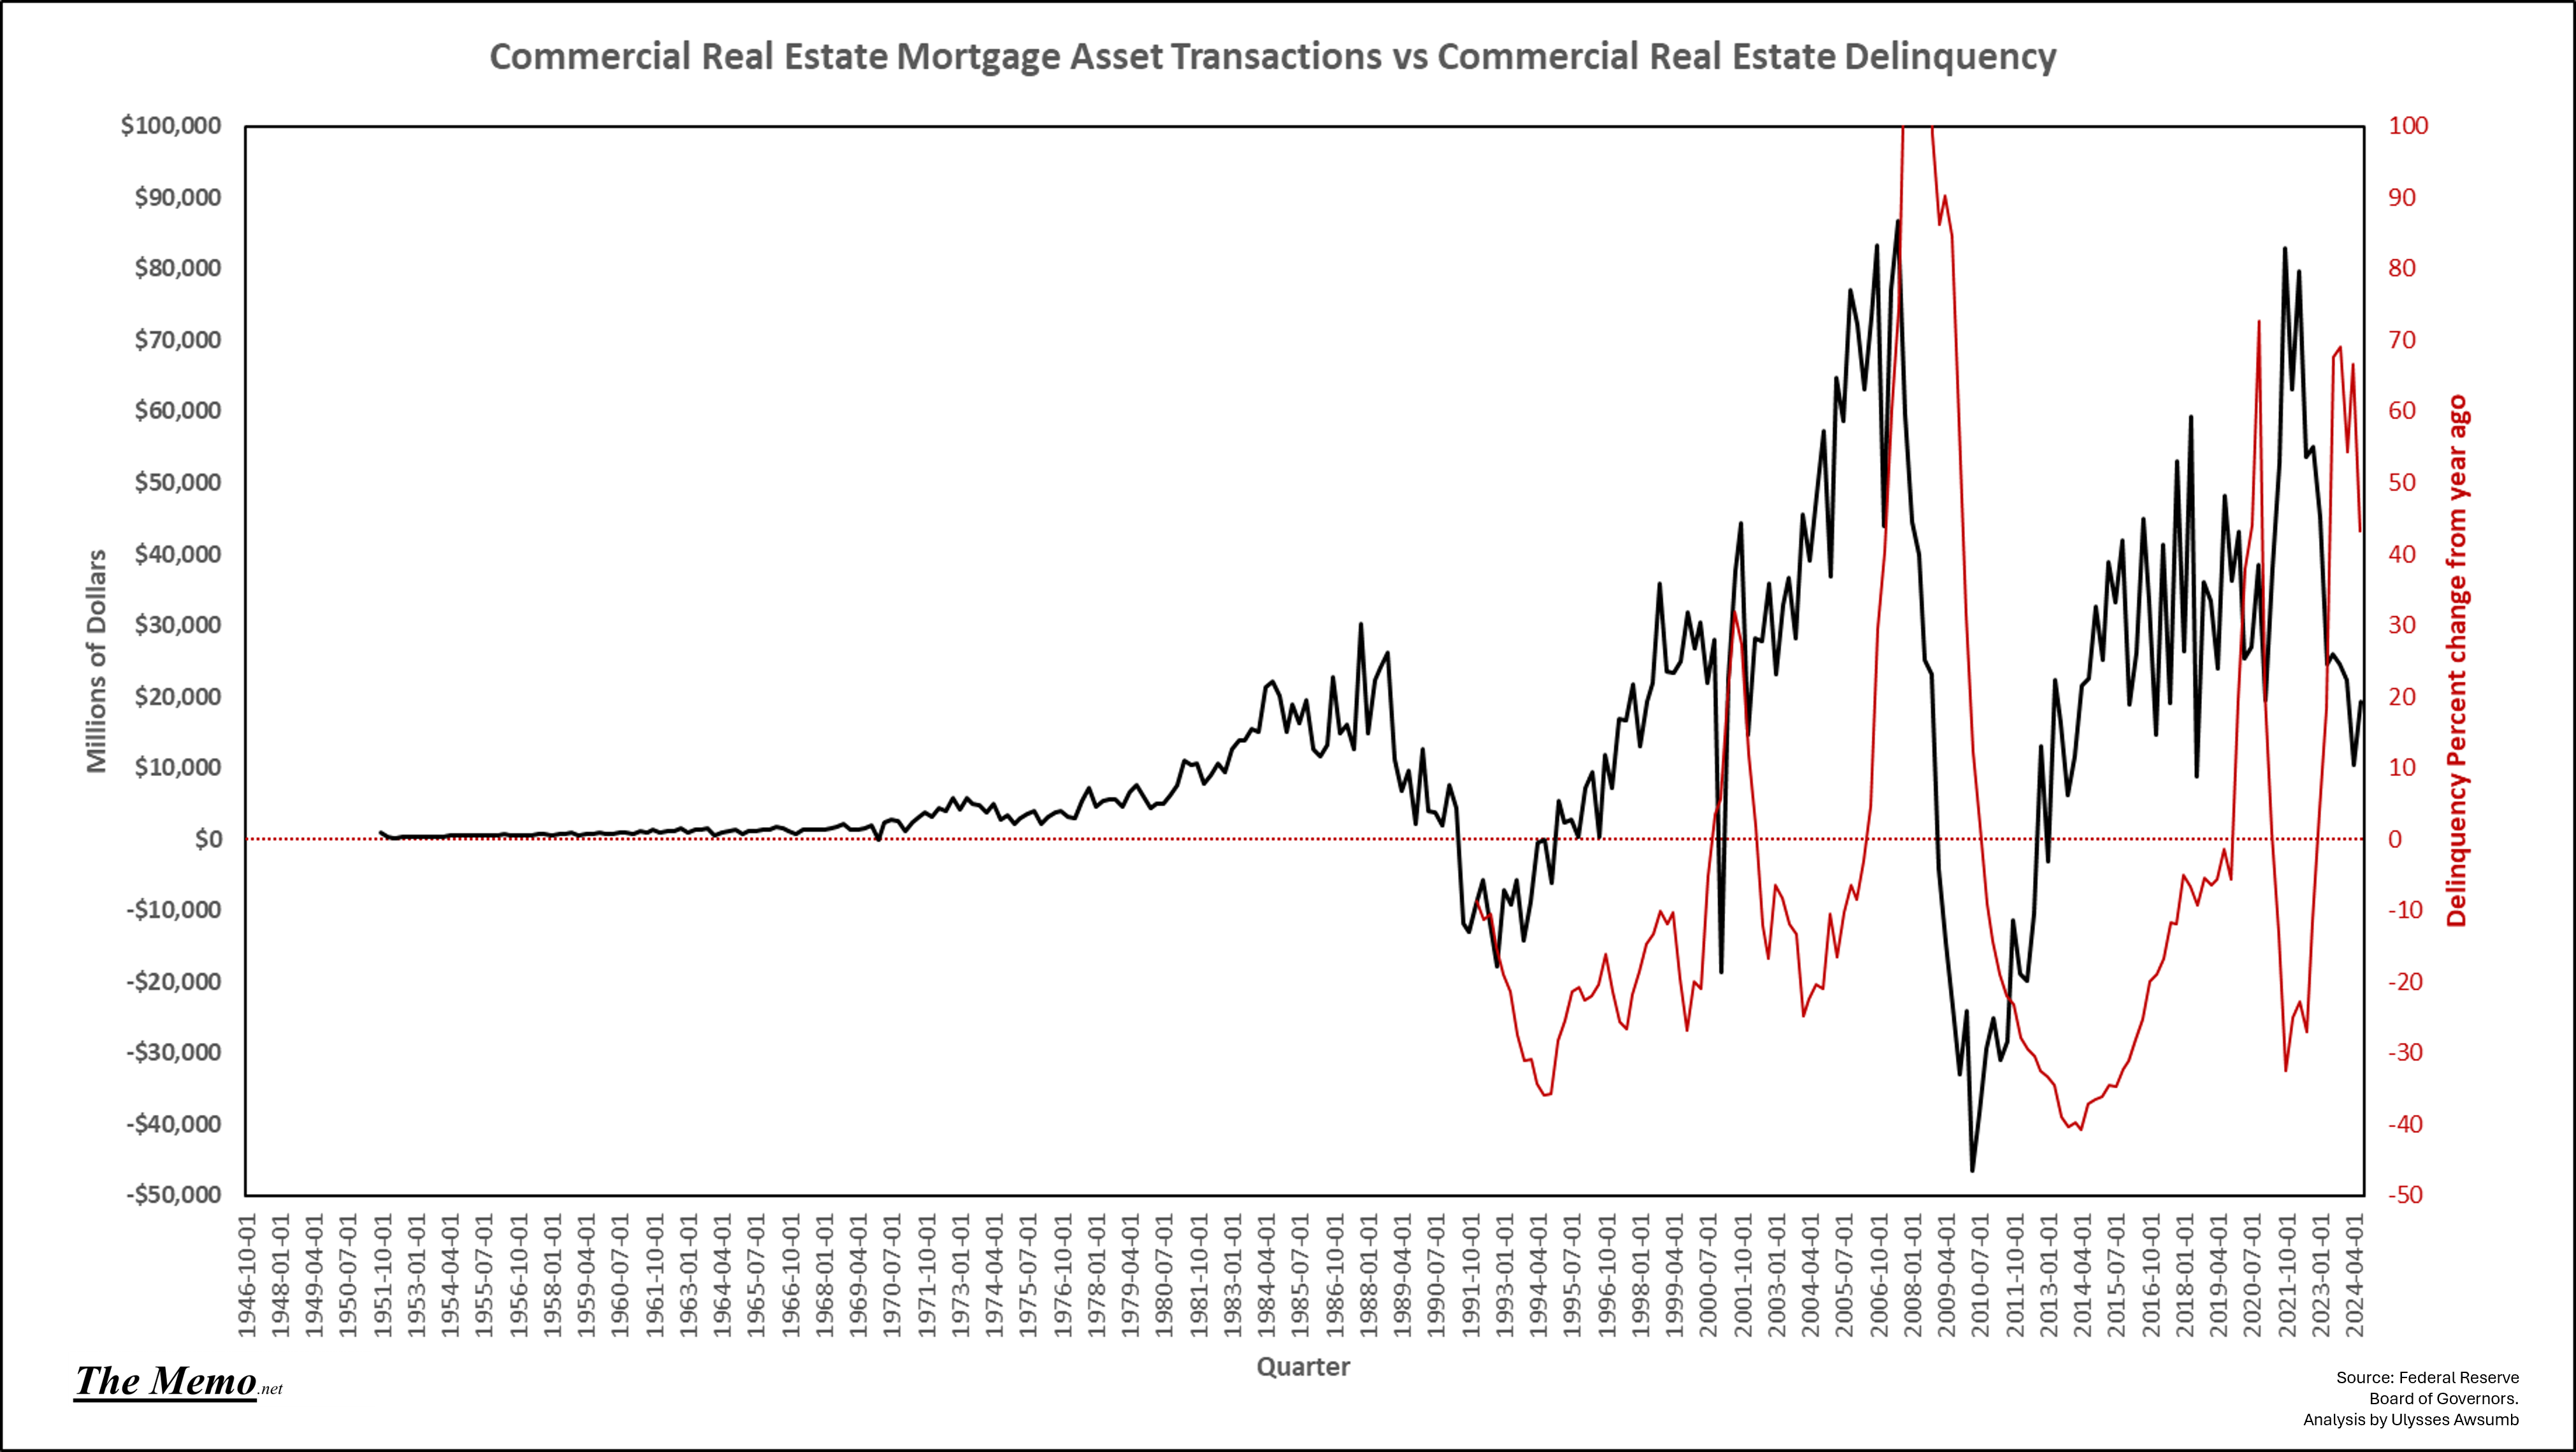
(Yes I cut off the top of the delinquency YOY for GFC .. everyone knows what happened)
This version of Delinquency on “commercial only” loans, started being tracked after the $120B destruction seen in commercial real estate mortgage assets through the end of the 1980’s into early 1990’s (Resolution Trust Corporation: RTC). That being said, the pattern is pretty clear combined.
To put that $10 Billion dollars of 1983/2024 volume into further context, it’s roughly the the Box Office Gross of Star Wars films + the amount Disney paid to buy Lucasfilm in 2012. A film franchise. (1, only one, single, film franchise)
So be it…. Jedi.
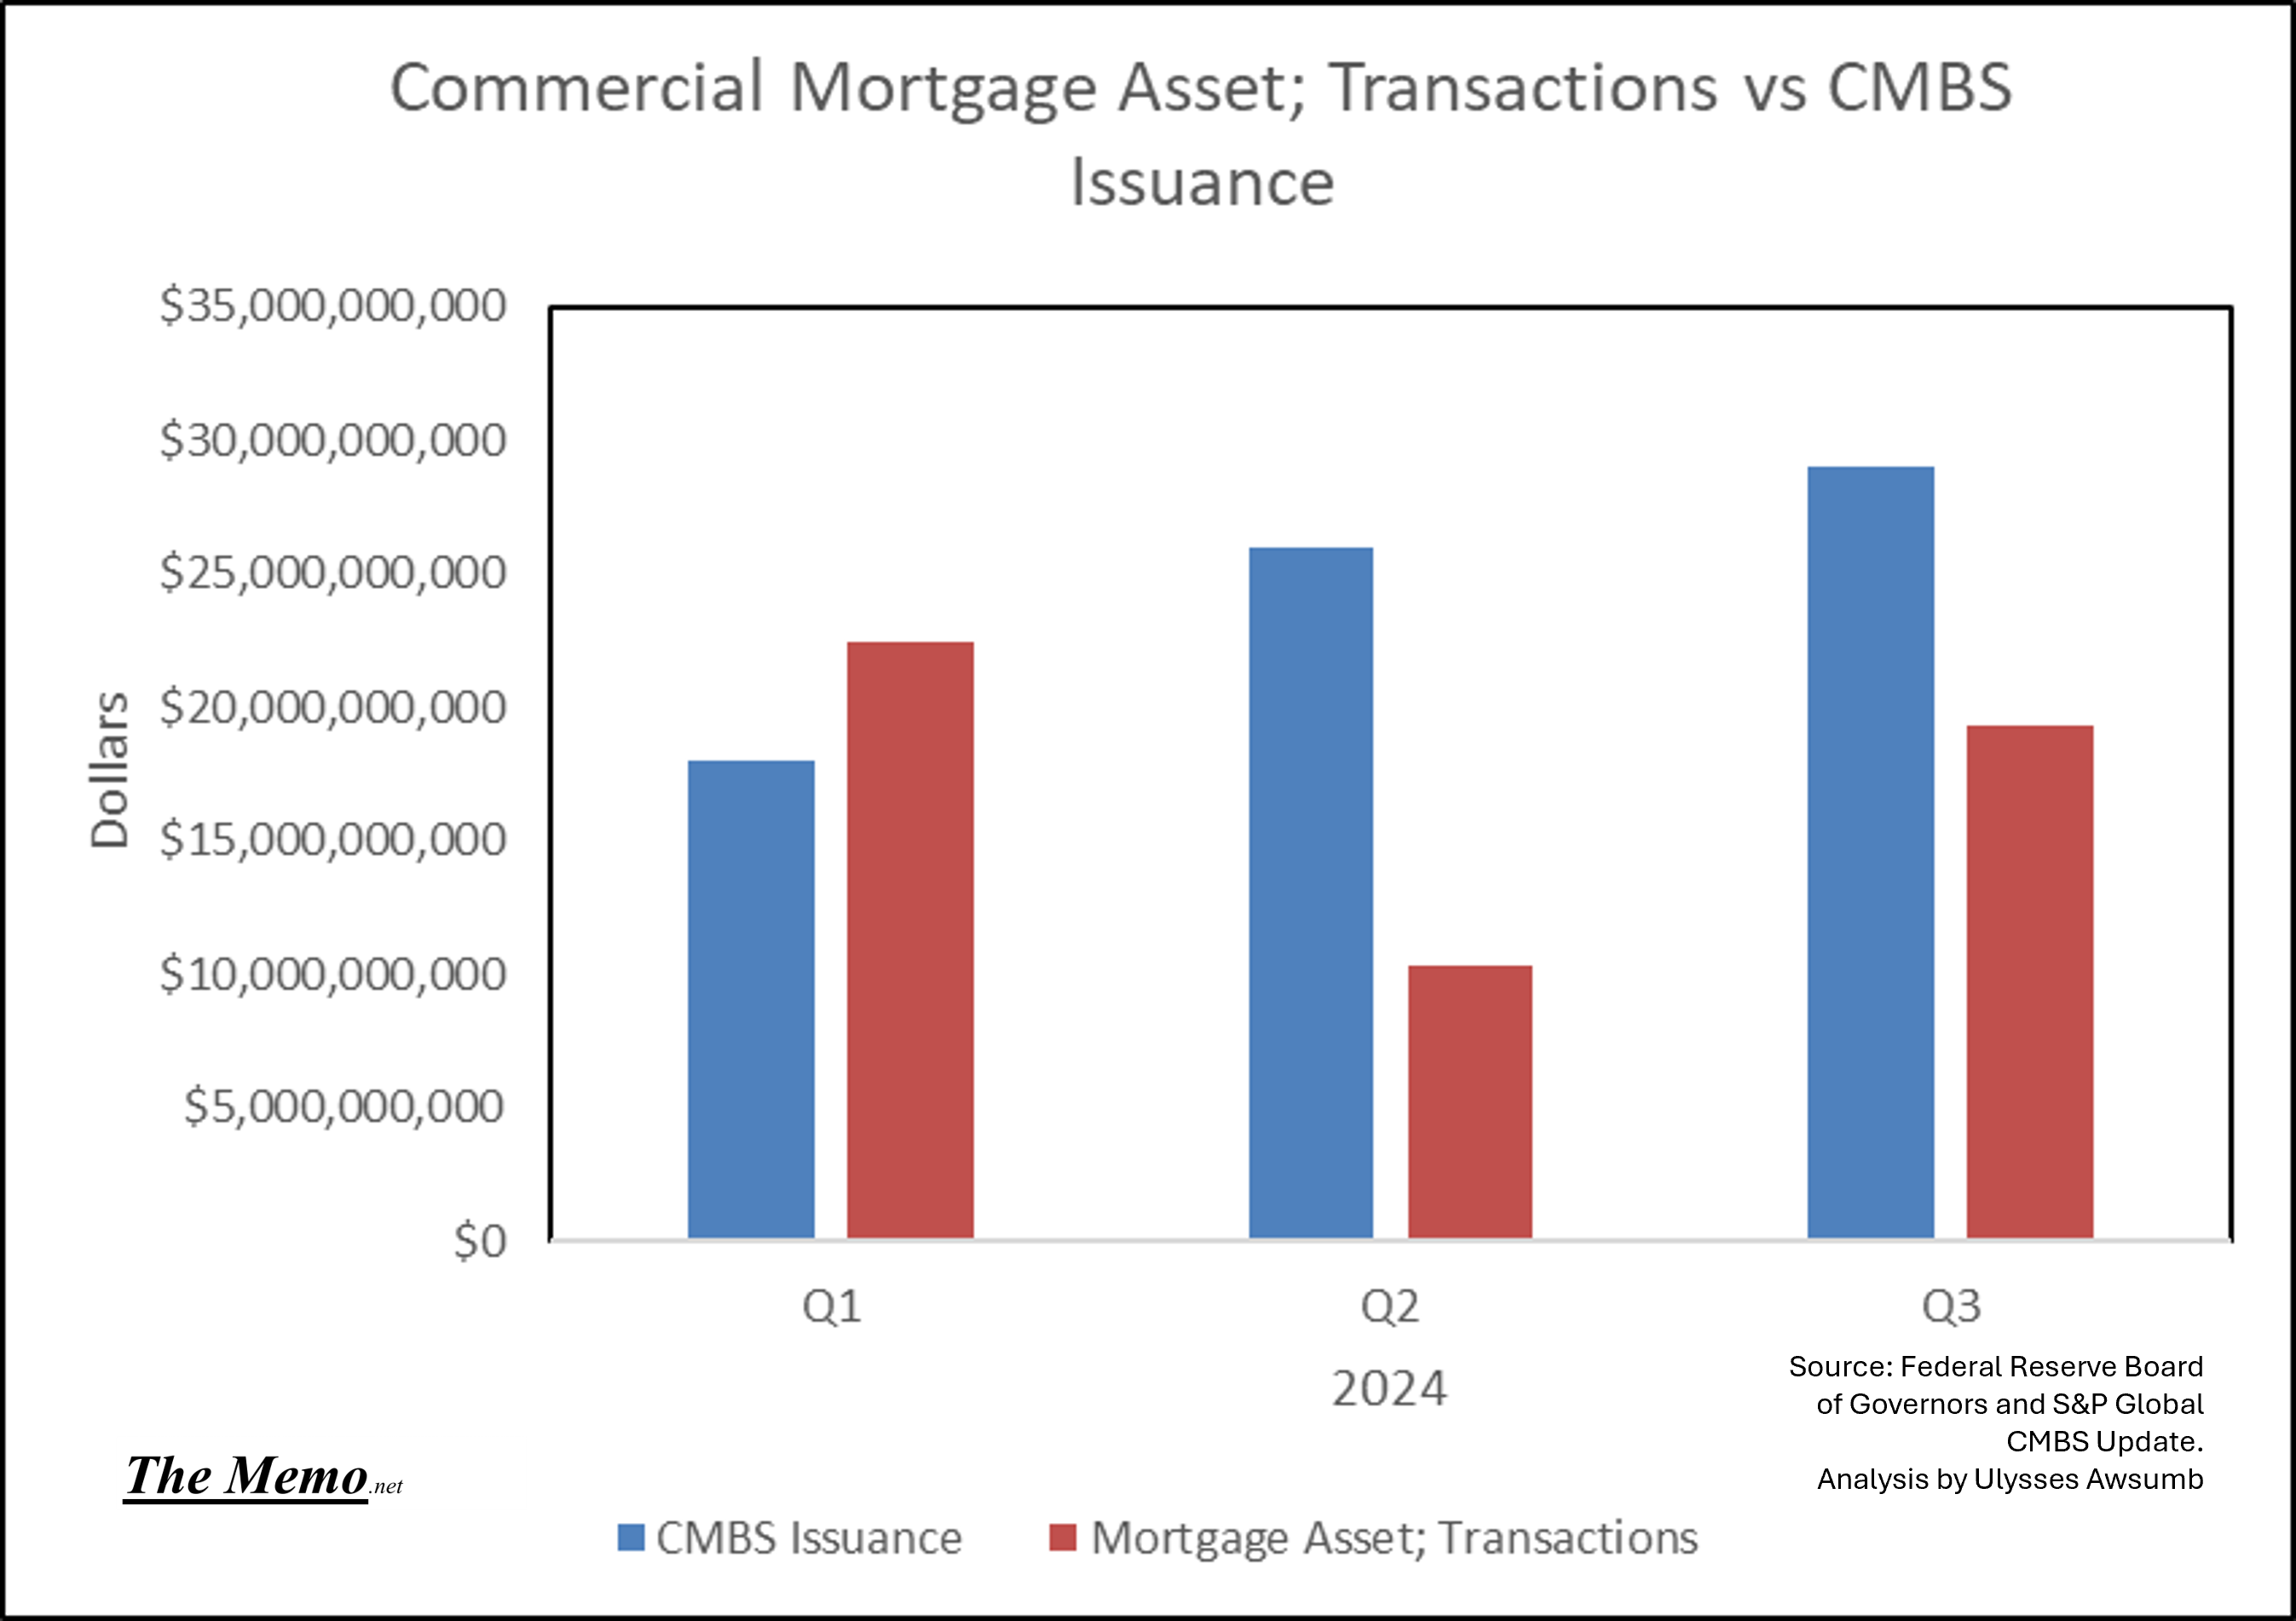
So how does that fare to Commercial Mortgage Backed Securities? CMBS have been increasing in issuance, as tracked by S&P Global
Here’s the mortgage asset transactions versus S&P’s issuance reported for 2024.
Over at CRED iQ, Michael Haas and his team do a great job tracking CLO/CMBS delinquencies. Suffice it to say, the actual delinquency rates on these are even worse. (I’ll let you enjoy seeing it there for yourself, I'm pretty sure they have THX surround sound)
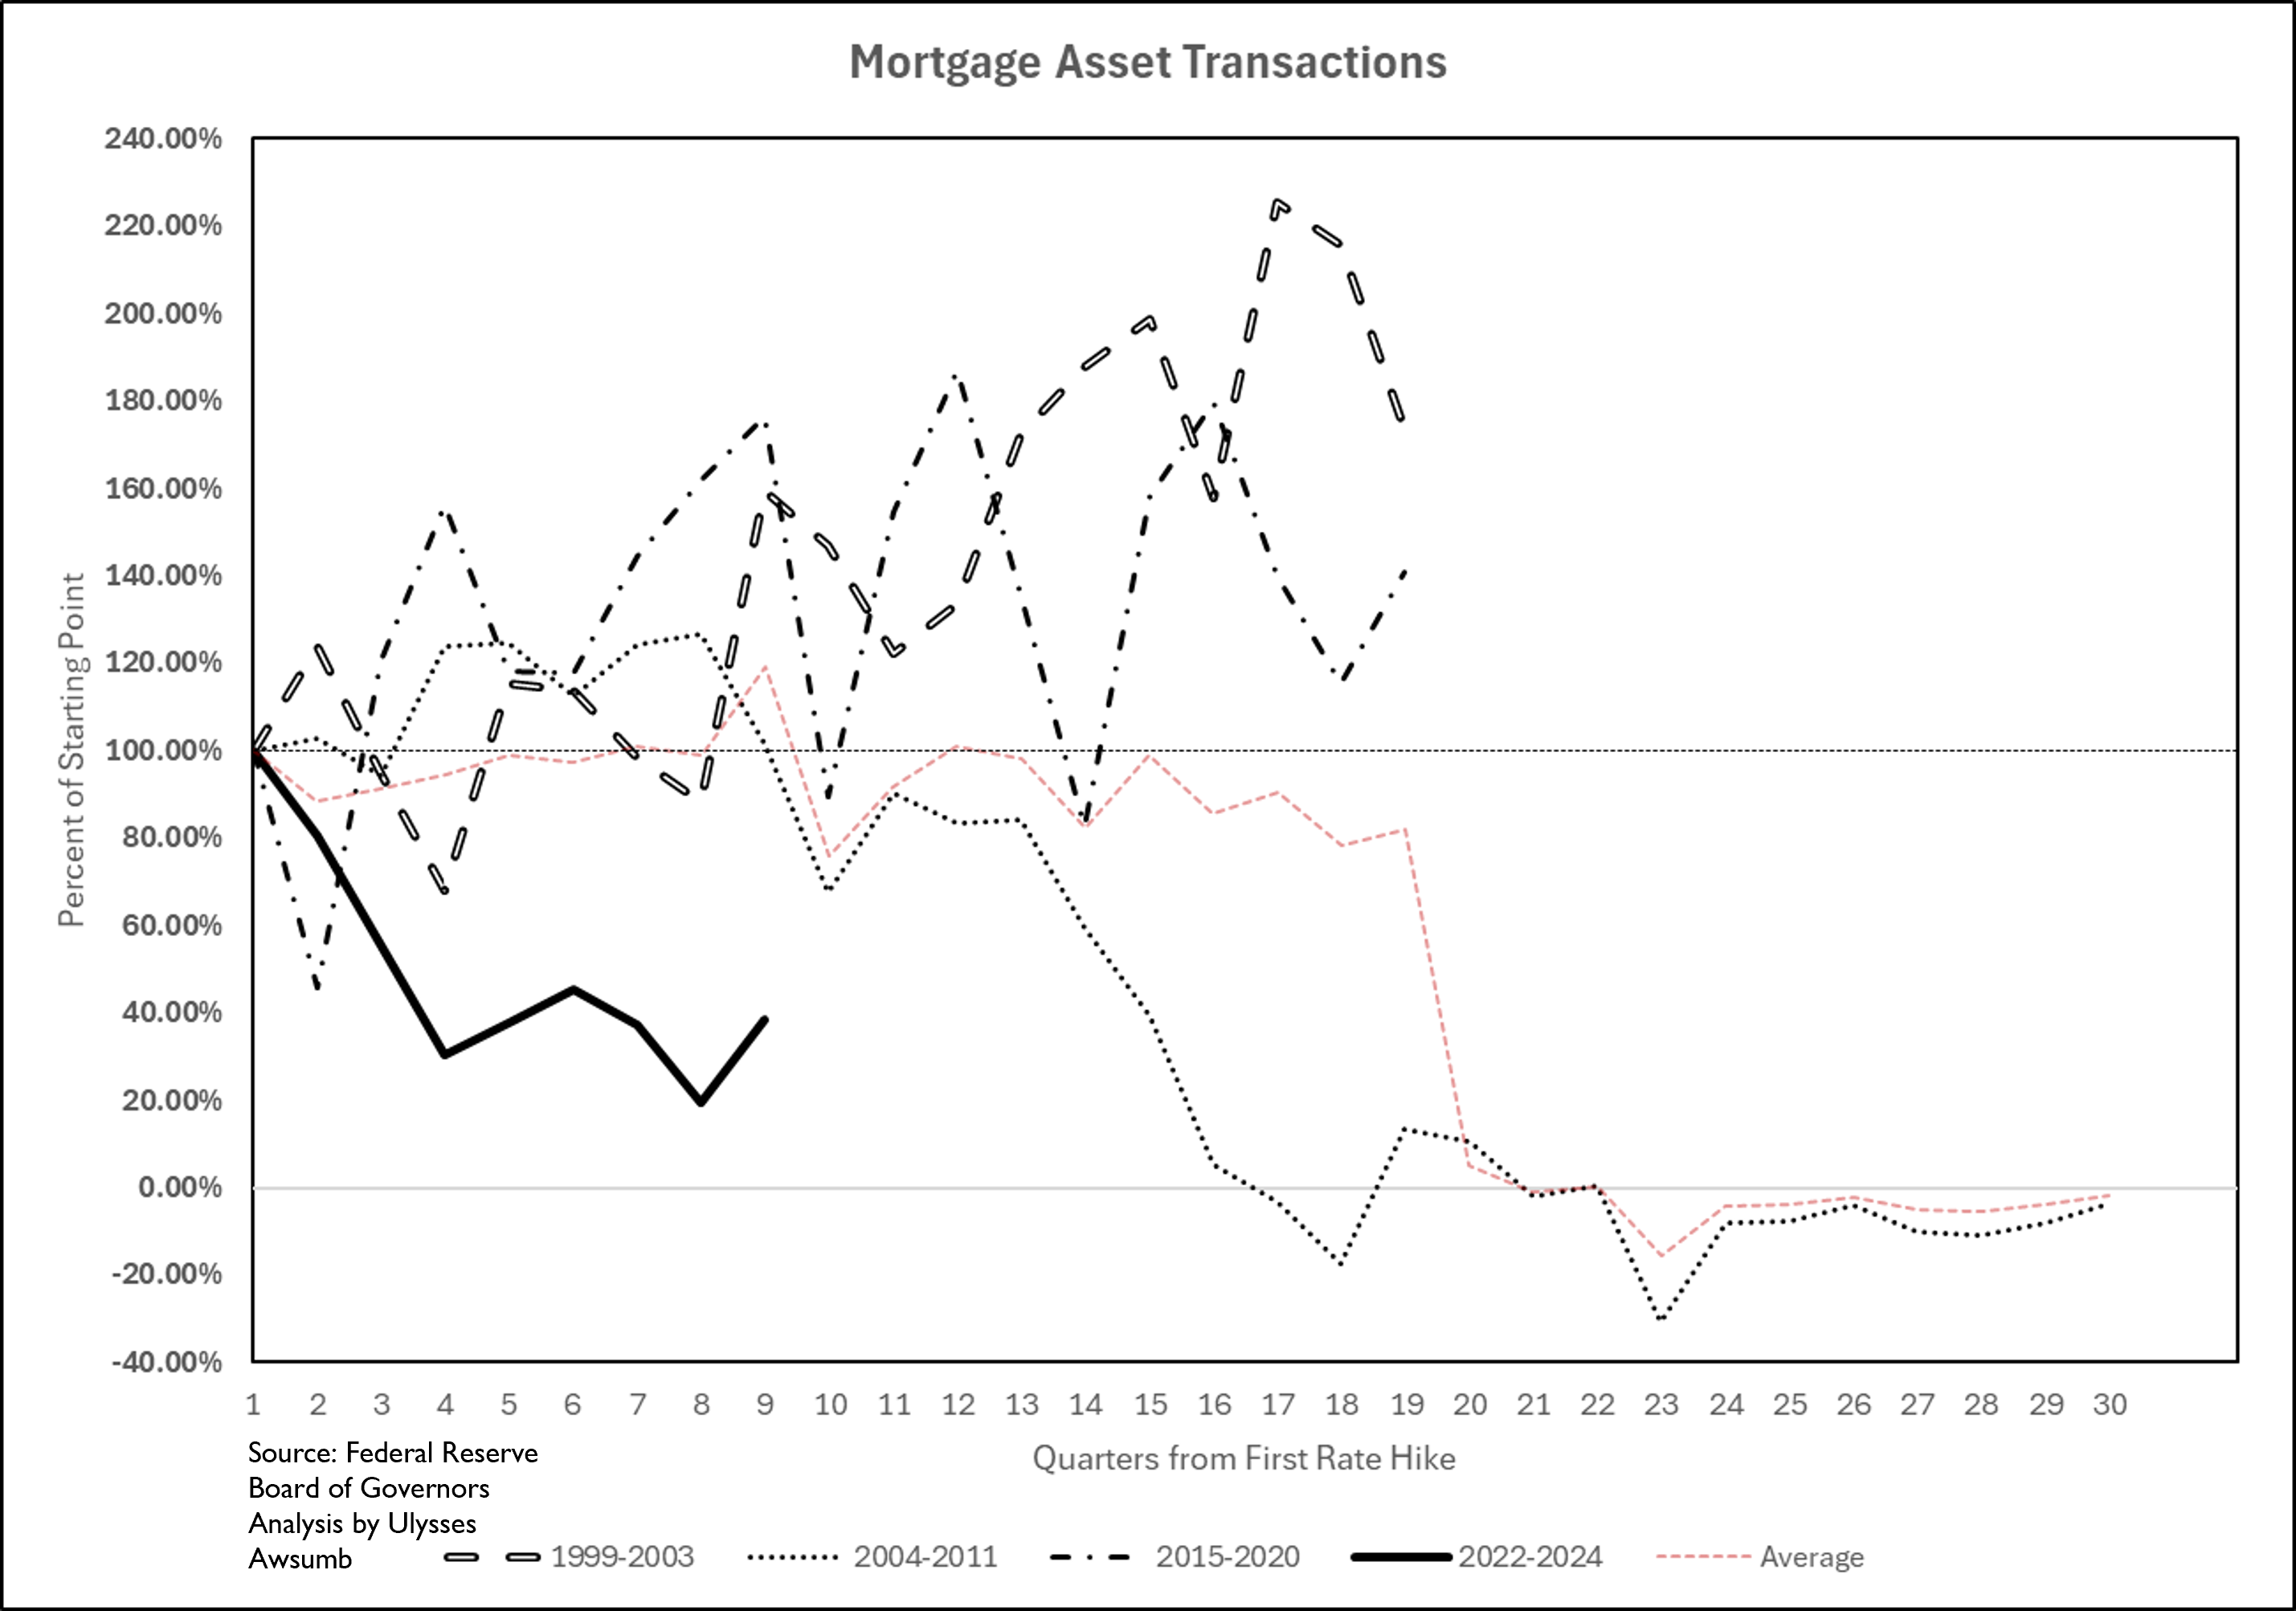
And of course, because it’s the Fourth Rate Turning, I would be remiss in turning over the sands of time, without measuring these by EFF cycles…Here’s all sectors, all mortgage asset transactions indexed to EFF Cycles, for the 21st century.
I was fortunate enough to get a correlation report not too long ago from Distill Advisory CEO Neely Tamminga, who is absolutely brilliant and, Distill is the IMAX standard of data reality; regarding mortgage asset transactions, and their leading/lagging/correlation to other economic data, and all I can say is; “not ready for the burden was I”.
Back to present day. Actual Present Day. We’re in Q1 of 2025. Q4 of 2024 hasn’t been reported yet. Given that rates increased throughout, where does that leave this cycle heading?
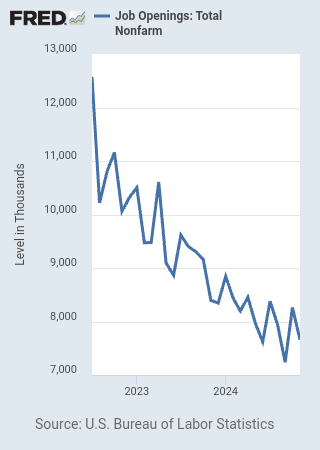
And where does the supposedly strong JOLTS (Job Openings and Labor Turnover Survey seen below) that was just reported (November data being reported, to be clear) leave the situation?
“We've gotta be able to get some kind of a reading on that shield, up or down”
If you know the situation was begging for “Return Of/To The Office” despite having to wait three more Episodes (months) for the answer:
“You were right. Tell your sister, you were right.”
On the bright side, we'll get our “sequels” sooner than George delivered his. Plus they'll be in chronological order.