Friday EFFing Memo
EFFing Prices


The Memo:
To:
Everyone
Re:
Existing Home Sales, Equities, Net Farm Income
From:
Mr. Awsumb
Comments:
A big welcome to all the new readers and a heartfelt thank you to all you readers. And a big thanks to Rudy Havenstein for mentioning the work done here.
A reminder, The Federal Reserve’s entire purpose of raising and lowering rates is to slow or stimulate the economoy through Monetary Policy and the point of these EFFing cycles to track those changes across different economic metrics. If you haven’t read it yet, the framework is in The Fourth Rate Turning, which I’ll embed below.
Existing Home Sales up month over month but no change in the trendline down
Median Sales Price of existing homes was flat month over month at $404,400 and pressure downward could mount from here.
NASDAQ, S&P500 and DJIA all continue to track their past cycle timelines.
USDA announced Net Farm Income forecast to drop again for 2024
A note on next weeks new sales, or rather a direct quote from DR Horton’s CEO on the earnings call this week: “we need
the spring to show up for us and to see the sales.”
Onto the Research.
Sincerely,

Please remember to CC your friends and colleagues on TheMemo.net as I’m sure there’s someone I didn’t copy.
End Memo

The Fourth Rate Turning
The Research
Housing
The National Association of Realtors posted 329,000 closings for December.

A reminder, about the EFF Cycle Indices: Each time the Federal Reserve begins to raise effective federal funds rates, that date is marked as the start of the cycle. So 100 = day/week/month one. Here’s the past 4 cycles of Existing Home Sales.

And to paint a clear picture, here’s the indiviual months in past cycles and the index level of said month. Or said another way, this is where we are today. Yesterday.
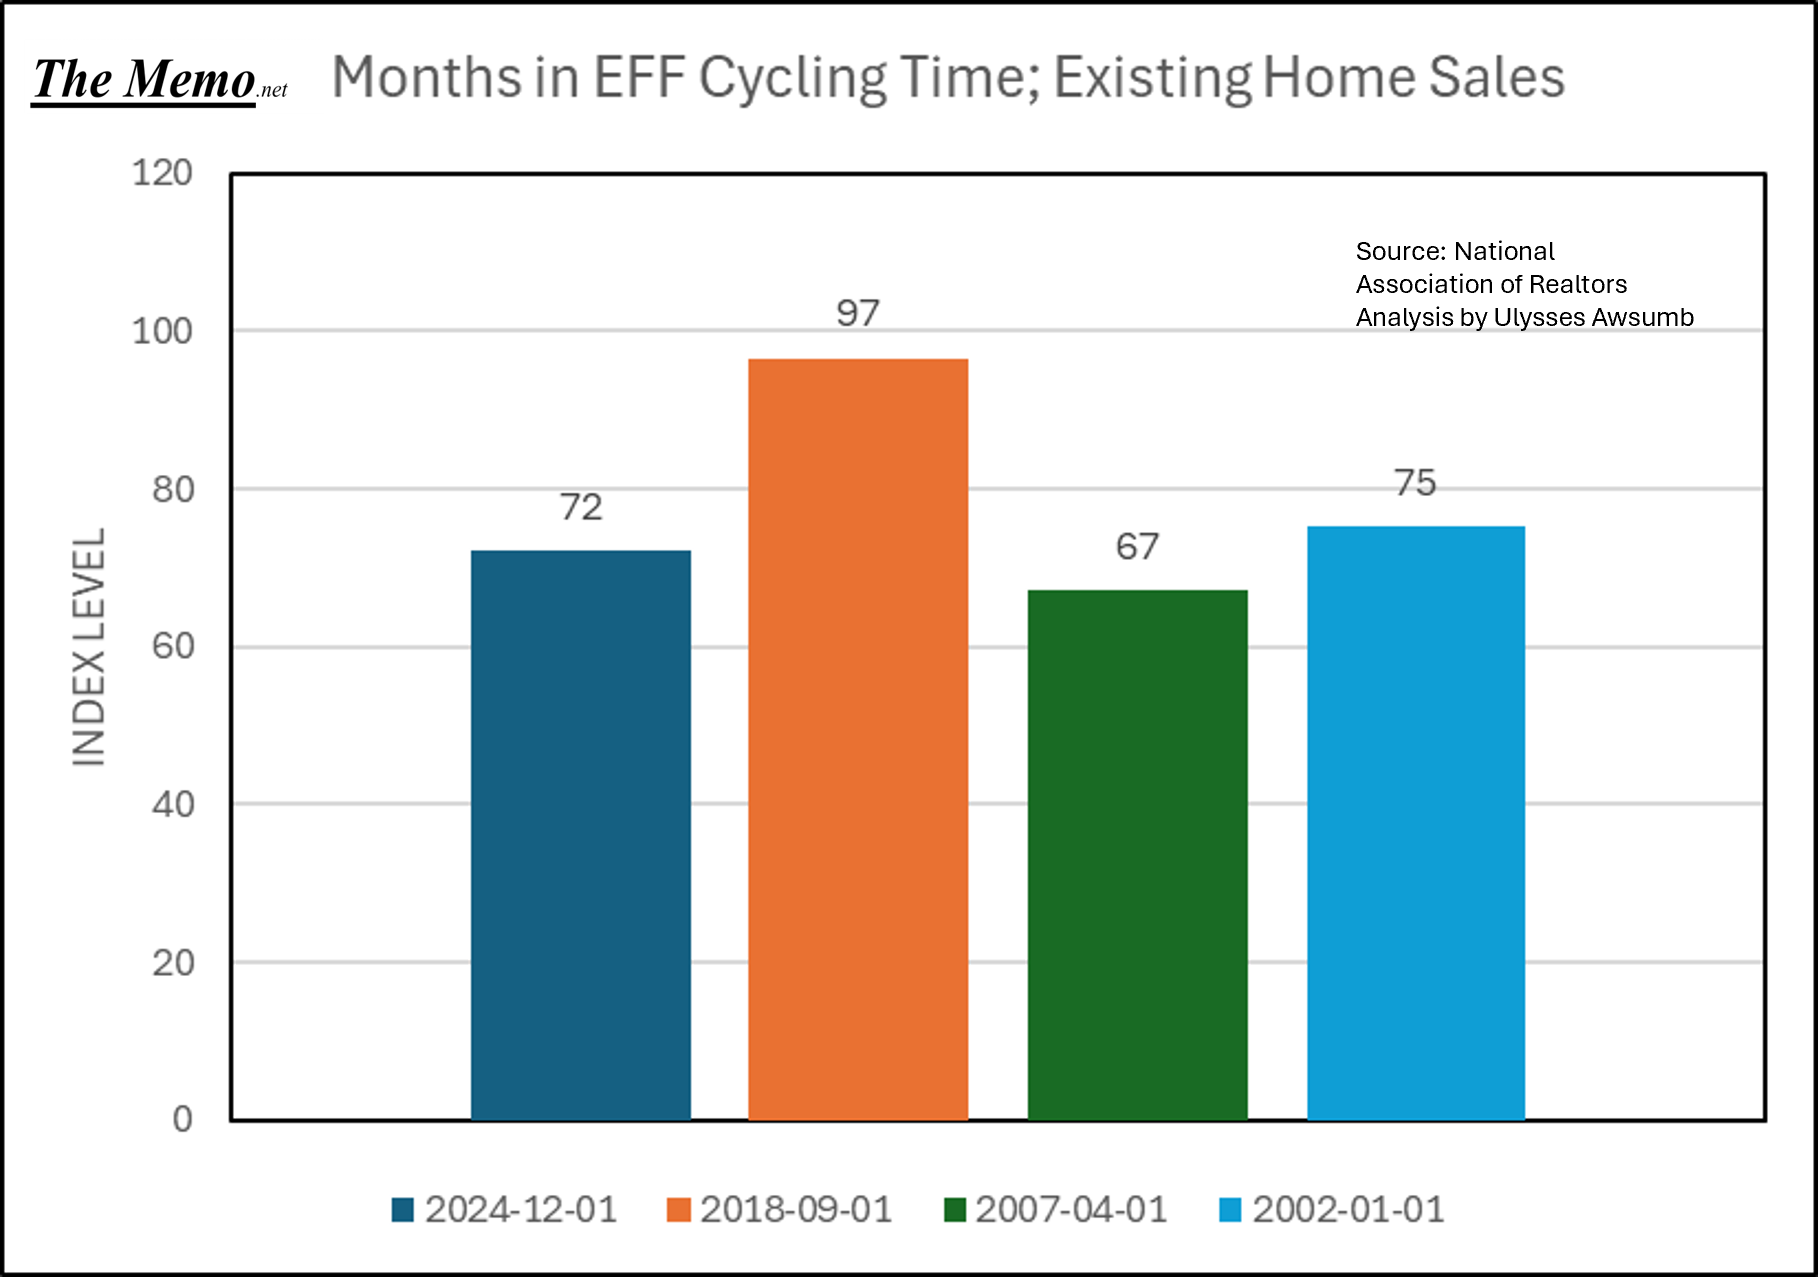
Sales continue to perform below average. One other way of looking at it, this is the effect of rate hikes on Existing Home Sales.

EFFing Prices
Here’s a look at that sideways pricing. Do you see what I see? The “spring” market is typically March-May. So there’s a potential price bump coming.

But consider where we are in EFFing time:

Ask yourself, where does the continued price inflation in housing come from? New prices have been declining since Q4 of 2022.
Rates have gone up steadily since September’s FOMC. The NY Federal Reserve just reported the highest rejection rate of mortgage applications in years.
How is your own outlook on the idea of buying a home right now, and what you see in prices?
Allow me for a moment to elaborate on a technical analysis for a moment.
Let’s start with establishing the ranges of the current cycle. The cycle end is familier
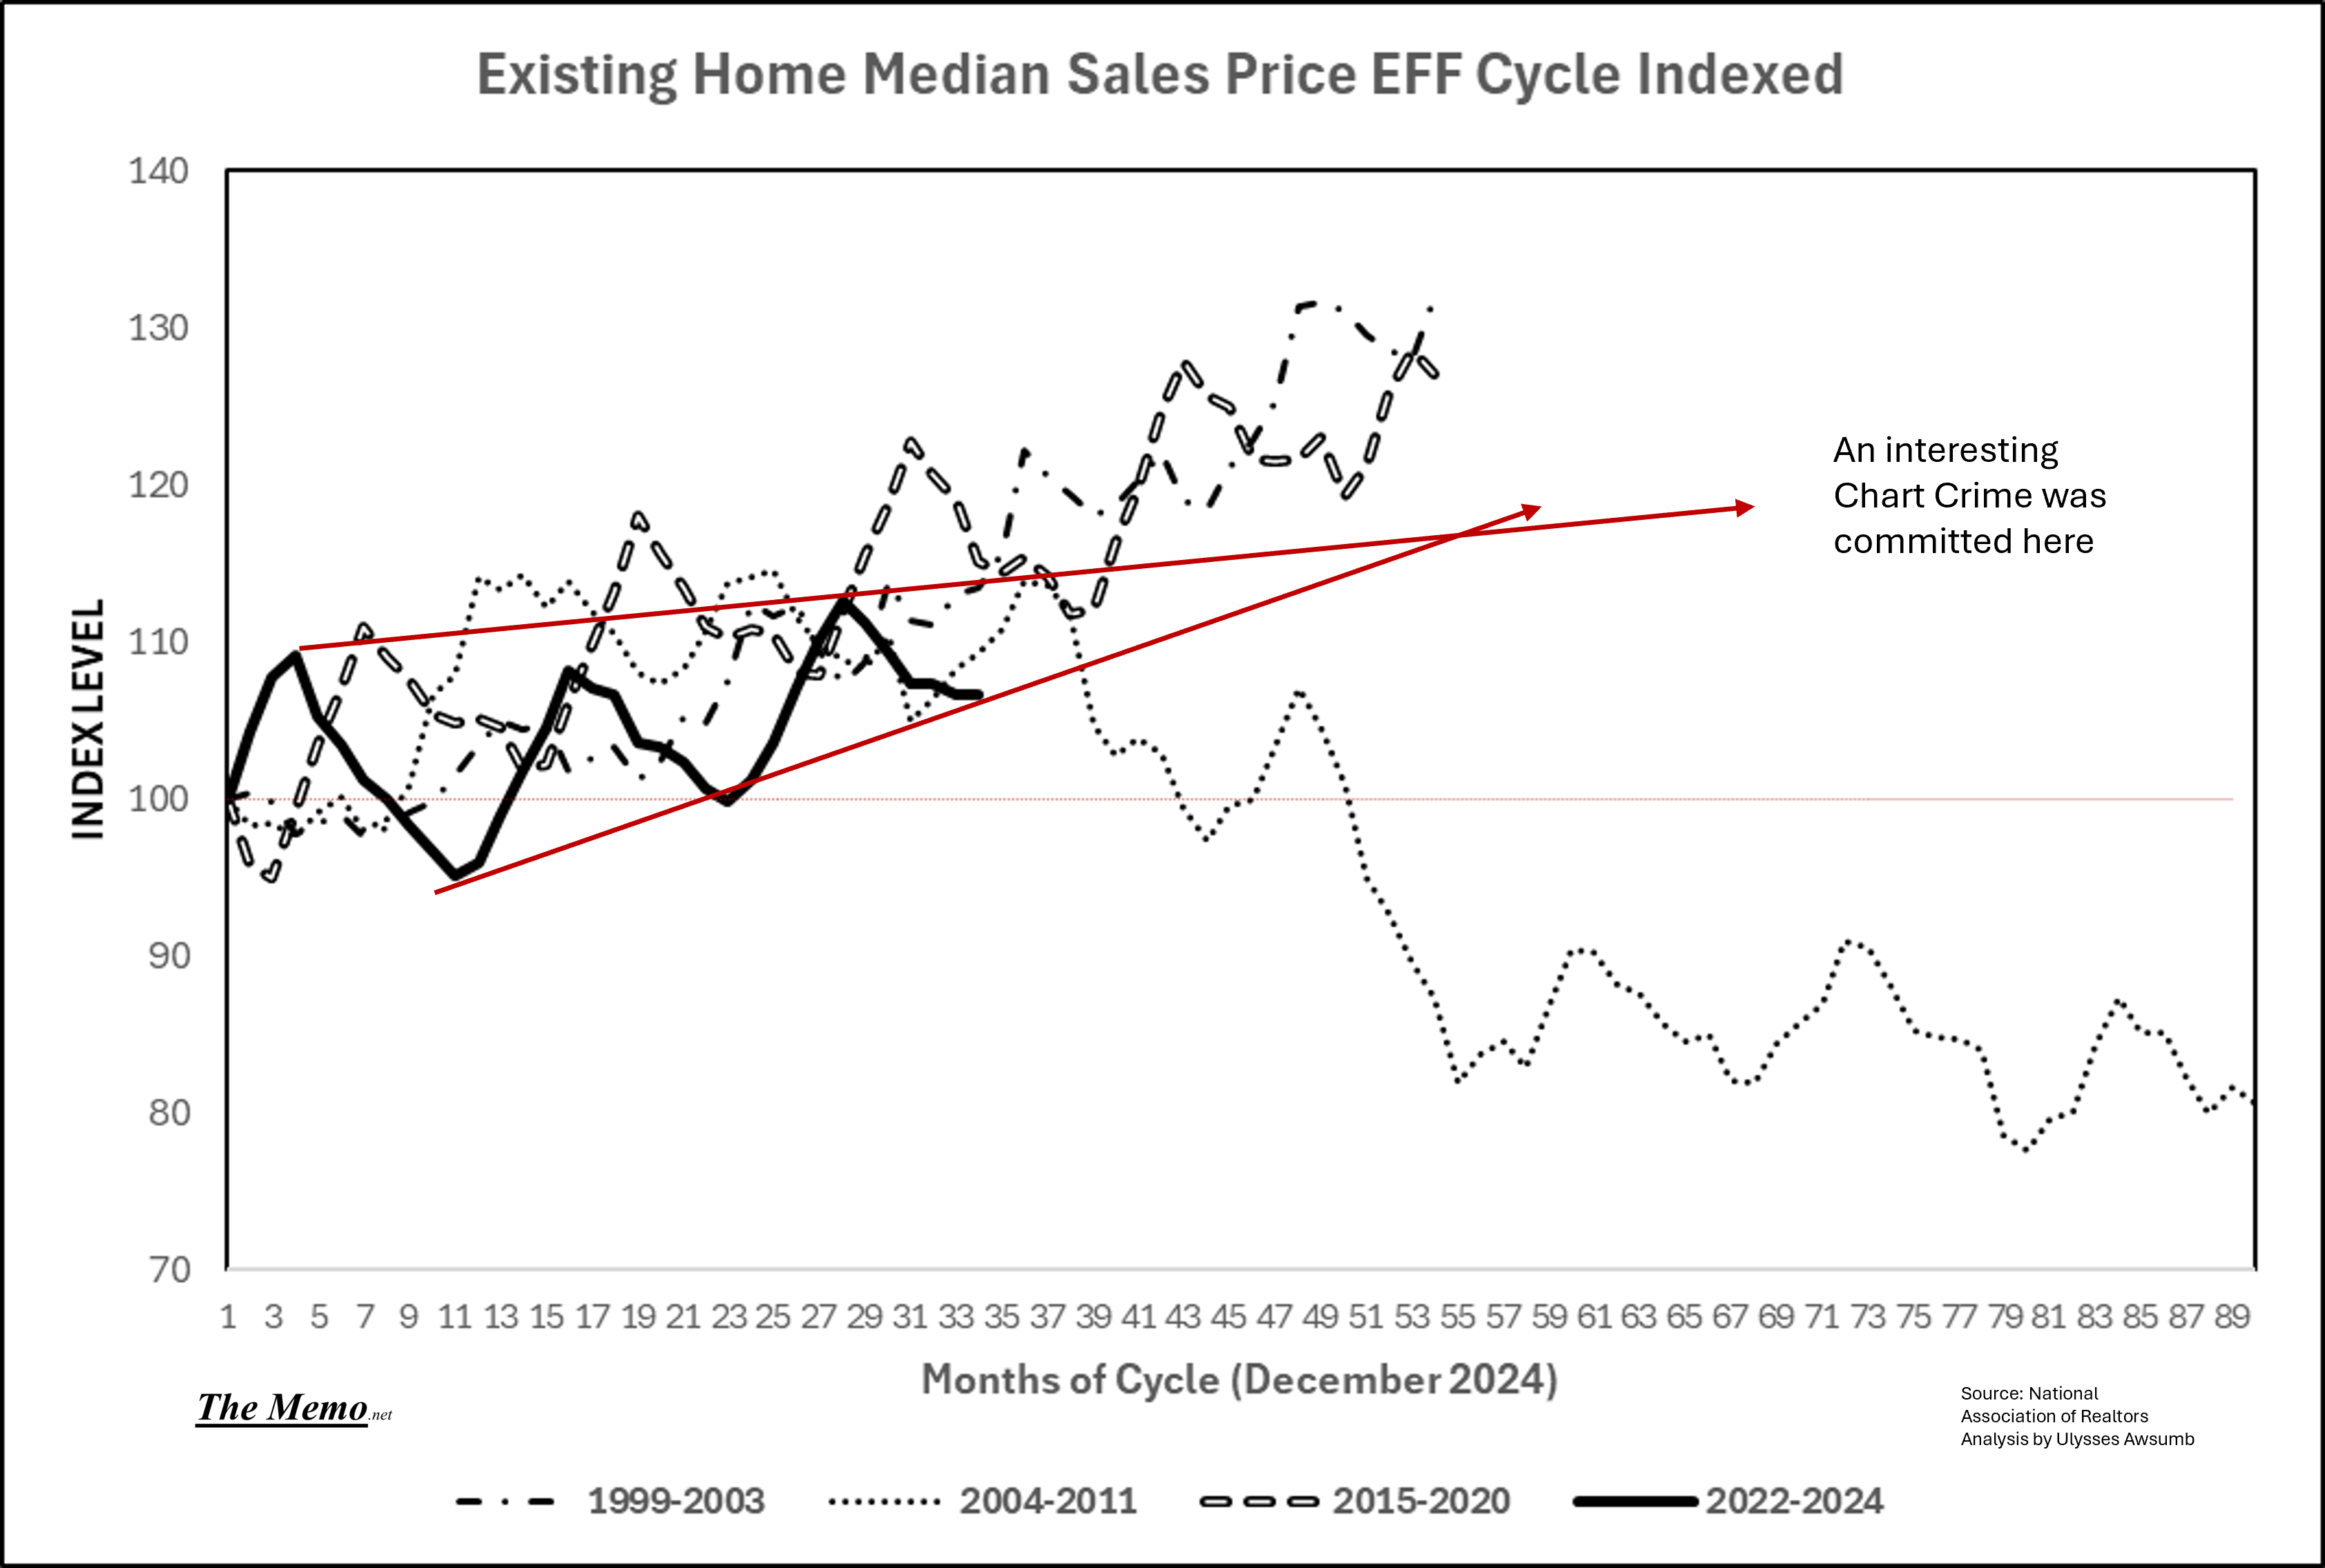
And let’s show what the first potential downward trajectory could have been.

Now lets add in the second possible trajectory, the sideways middle one.

And just for fun, let’s add in range downward off the latest points.
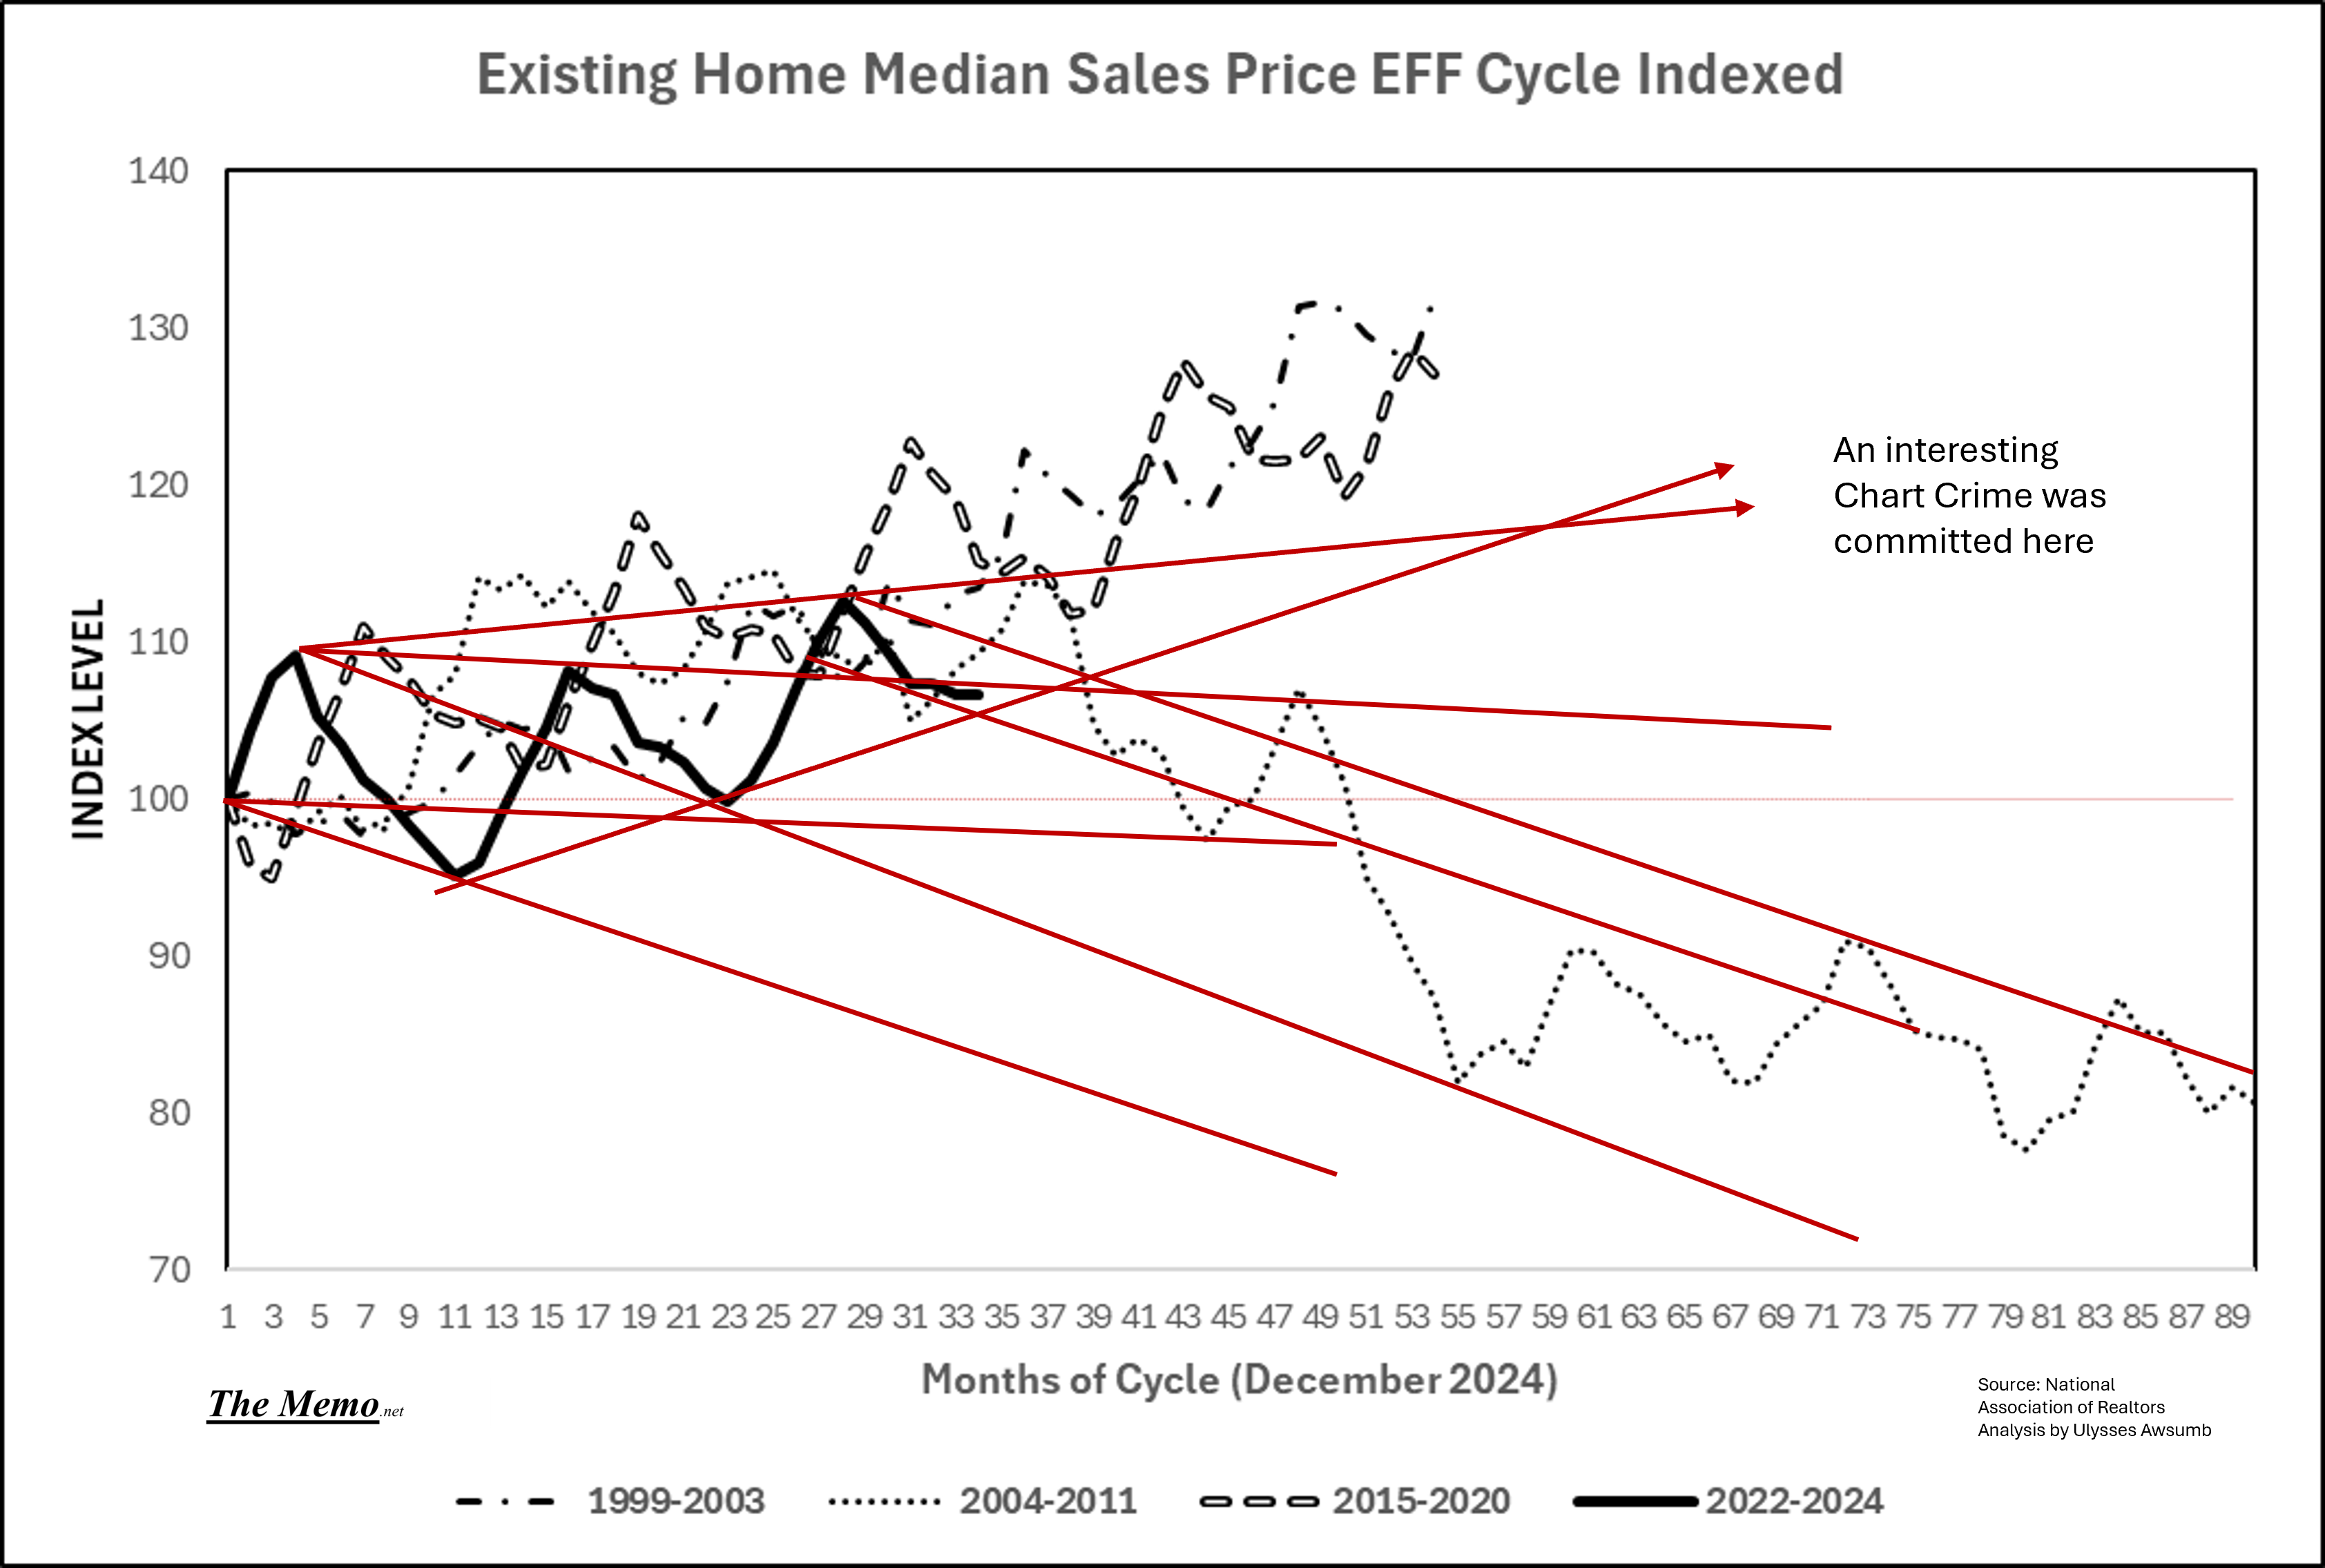
Interesing innit?
The chart crime mentioned, is simply using stock analysis on home pricing, however, I could go on at length on potential negative pricing factors.
Also, just a reminder, not only was the GFC not the only time prices went negative nationally, but this other time was the basis of Robert Shiller inventing this index:

Are we having any EFFing fun yet?
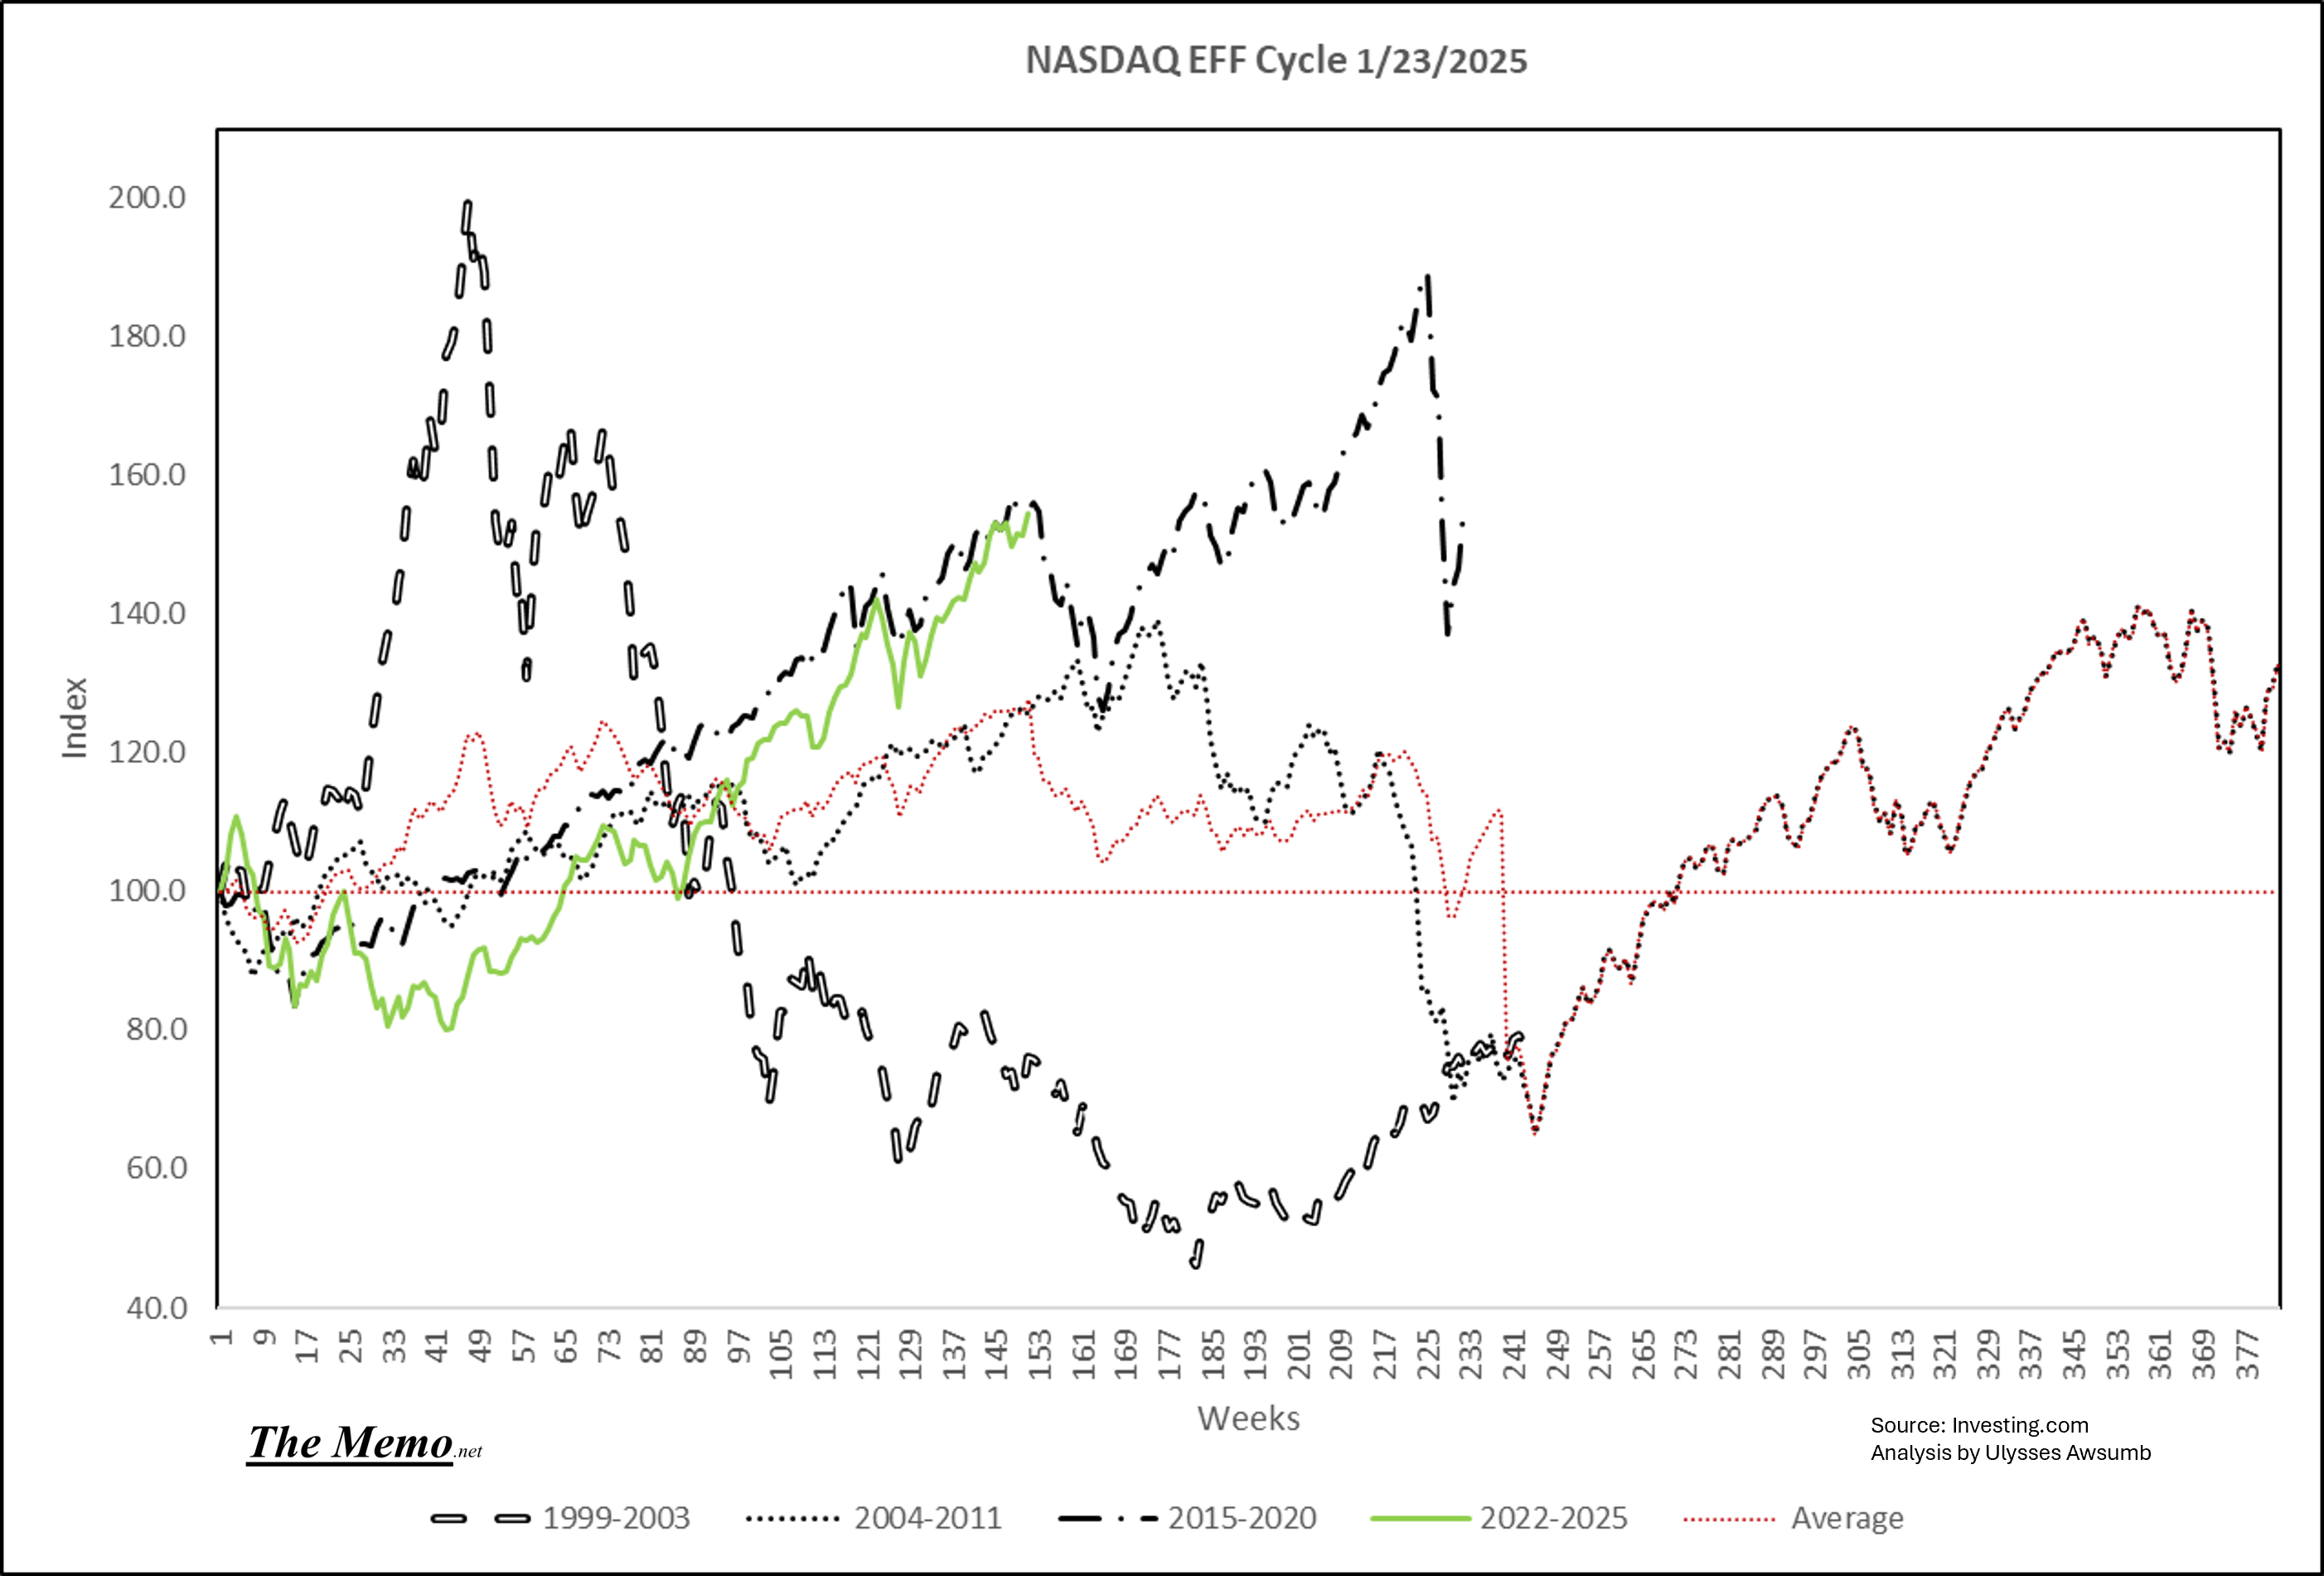
Equities
NASDAQ
Measured yesterday. The first and third cycle went down from here, with just couple more weeks for cycle 2. Look at how close we’re tracking 2015-2020.