Date: May 27th 2025
Time: 10:00am

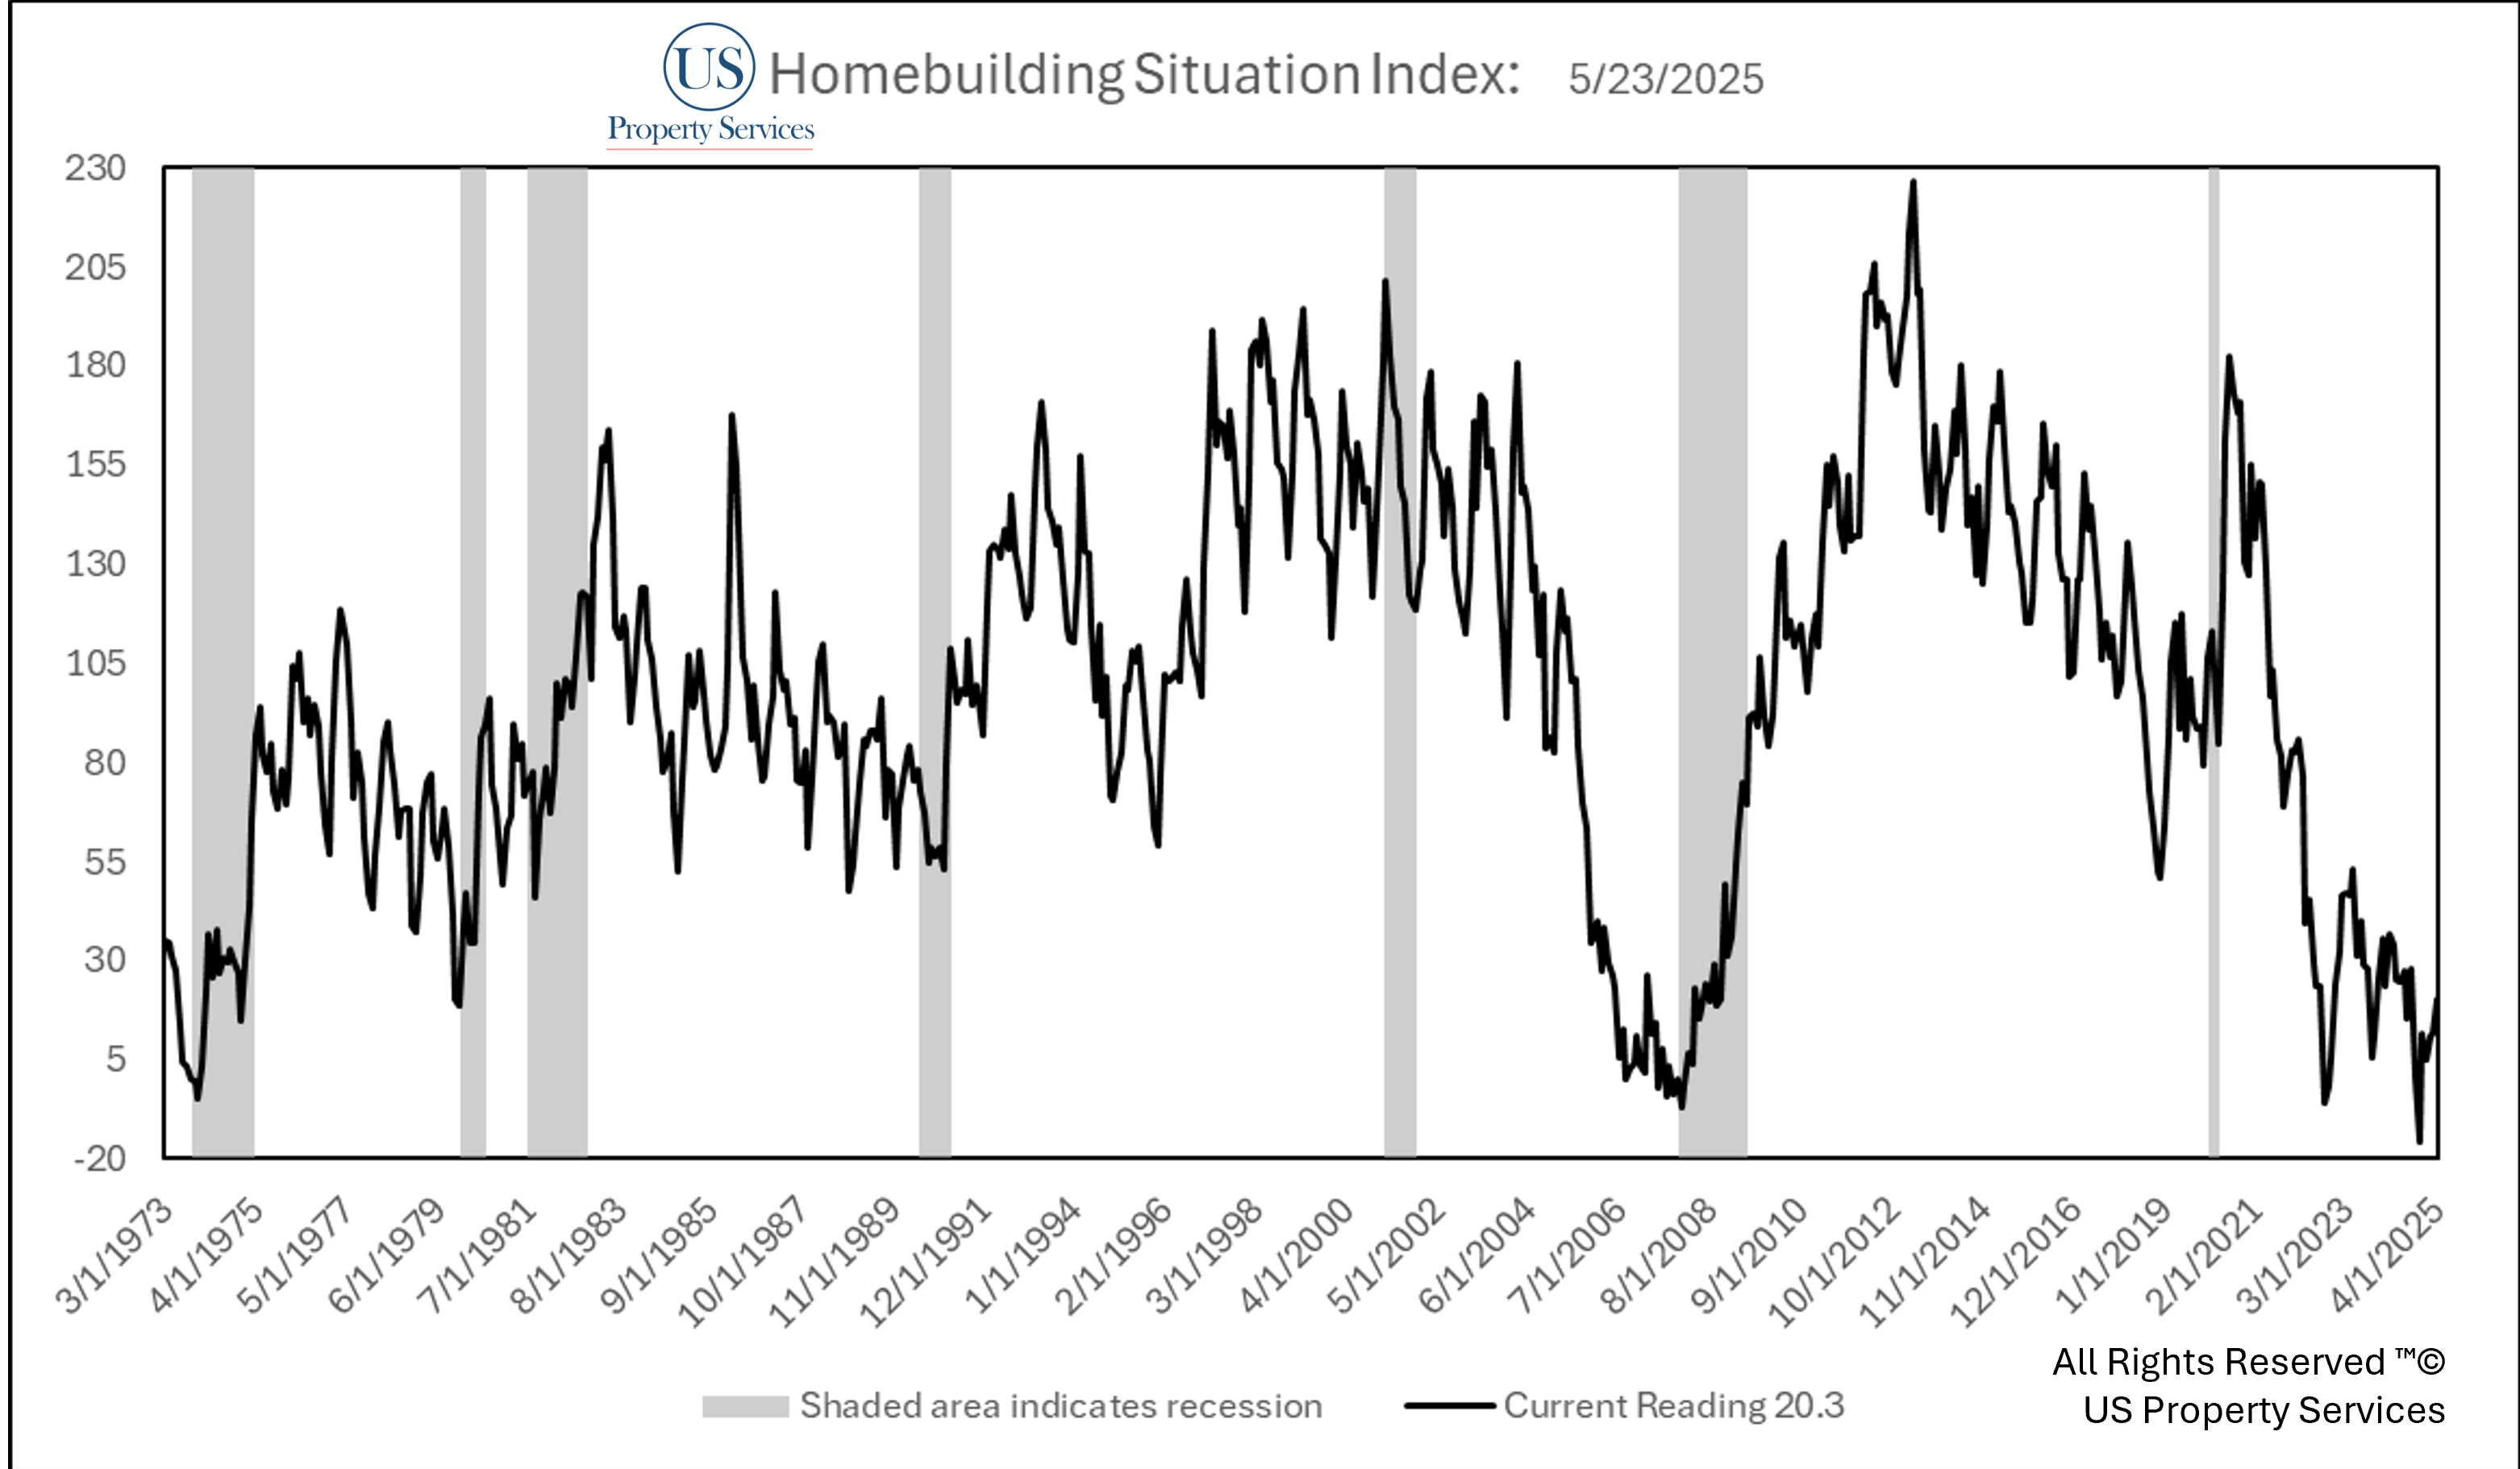
The Homebuilding Situation stands at 20.3 This is 79.7 points below the Average Situation for Homebuilders. The situation improved by 1.6 points from the prior month.
Sales
April saw a 3 year high of 68,000 units sold. This is the most sales since February 2022. March’s 69,000 sales were revised down by 9+% to 63,000 sales. This is an abnormally large revision downward from the Census Bureau. None of these take into account increased sale cancellations. Both builder earnings and Redfin have reported increased cancellations through May 2025.
Inventory
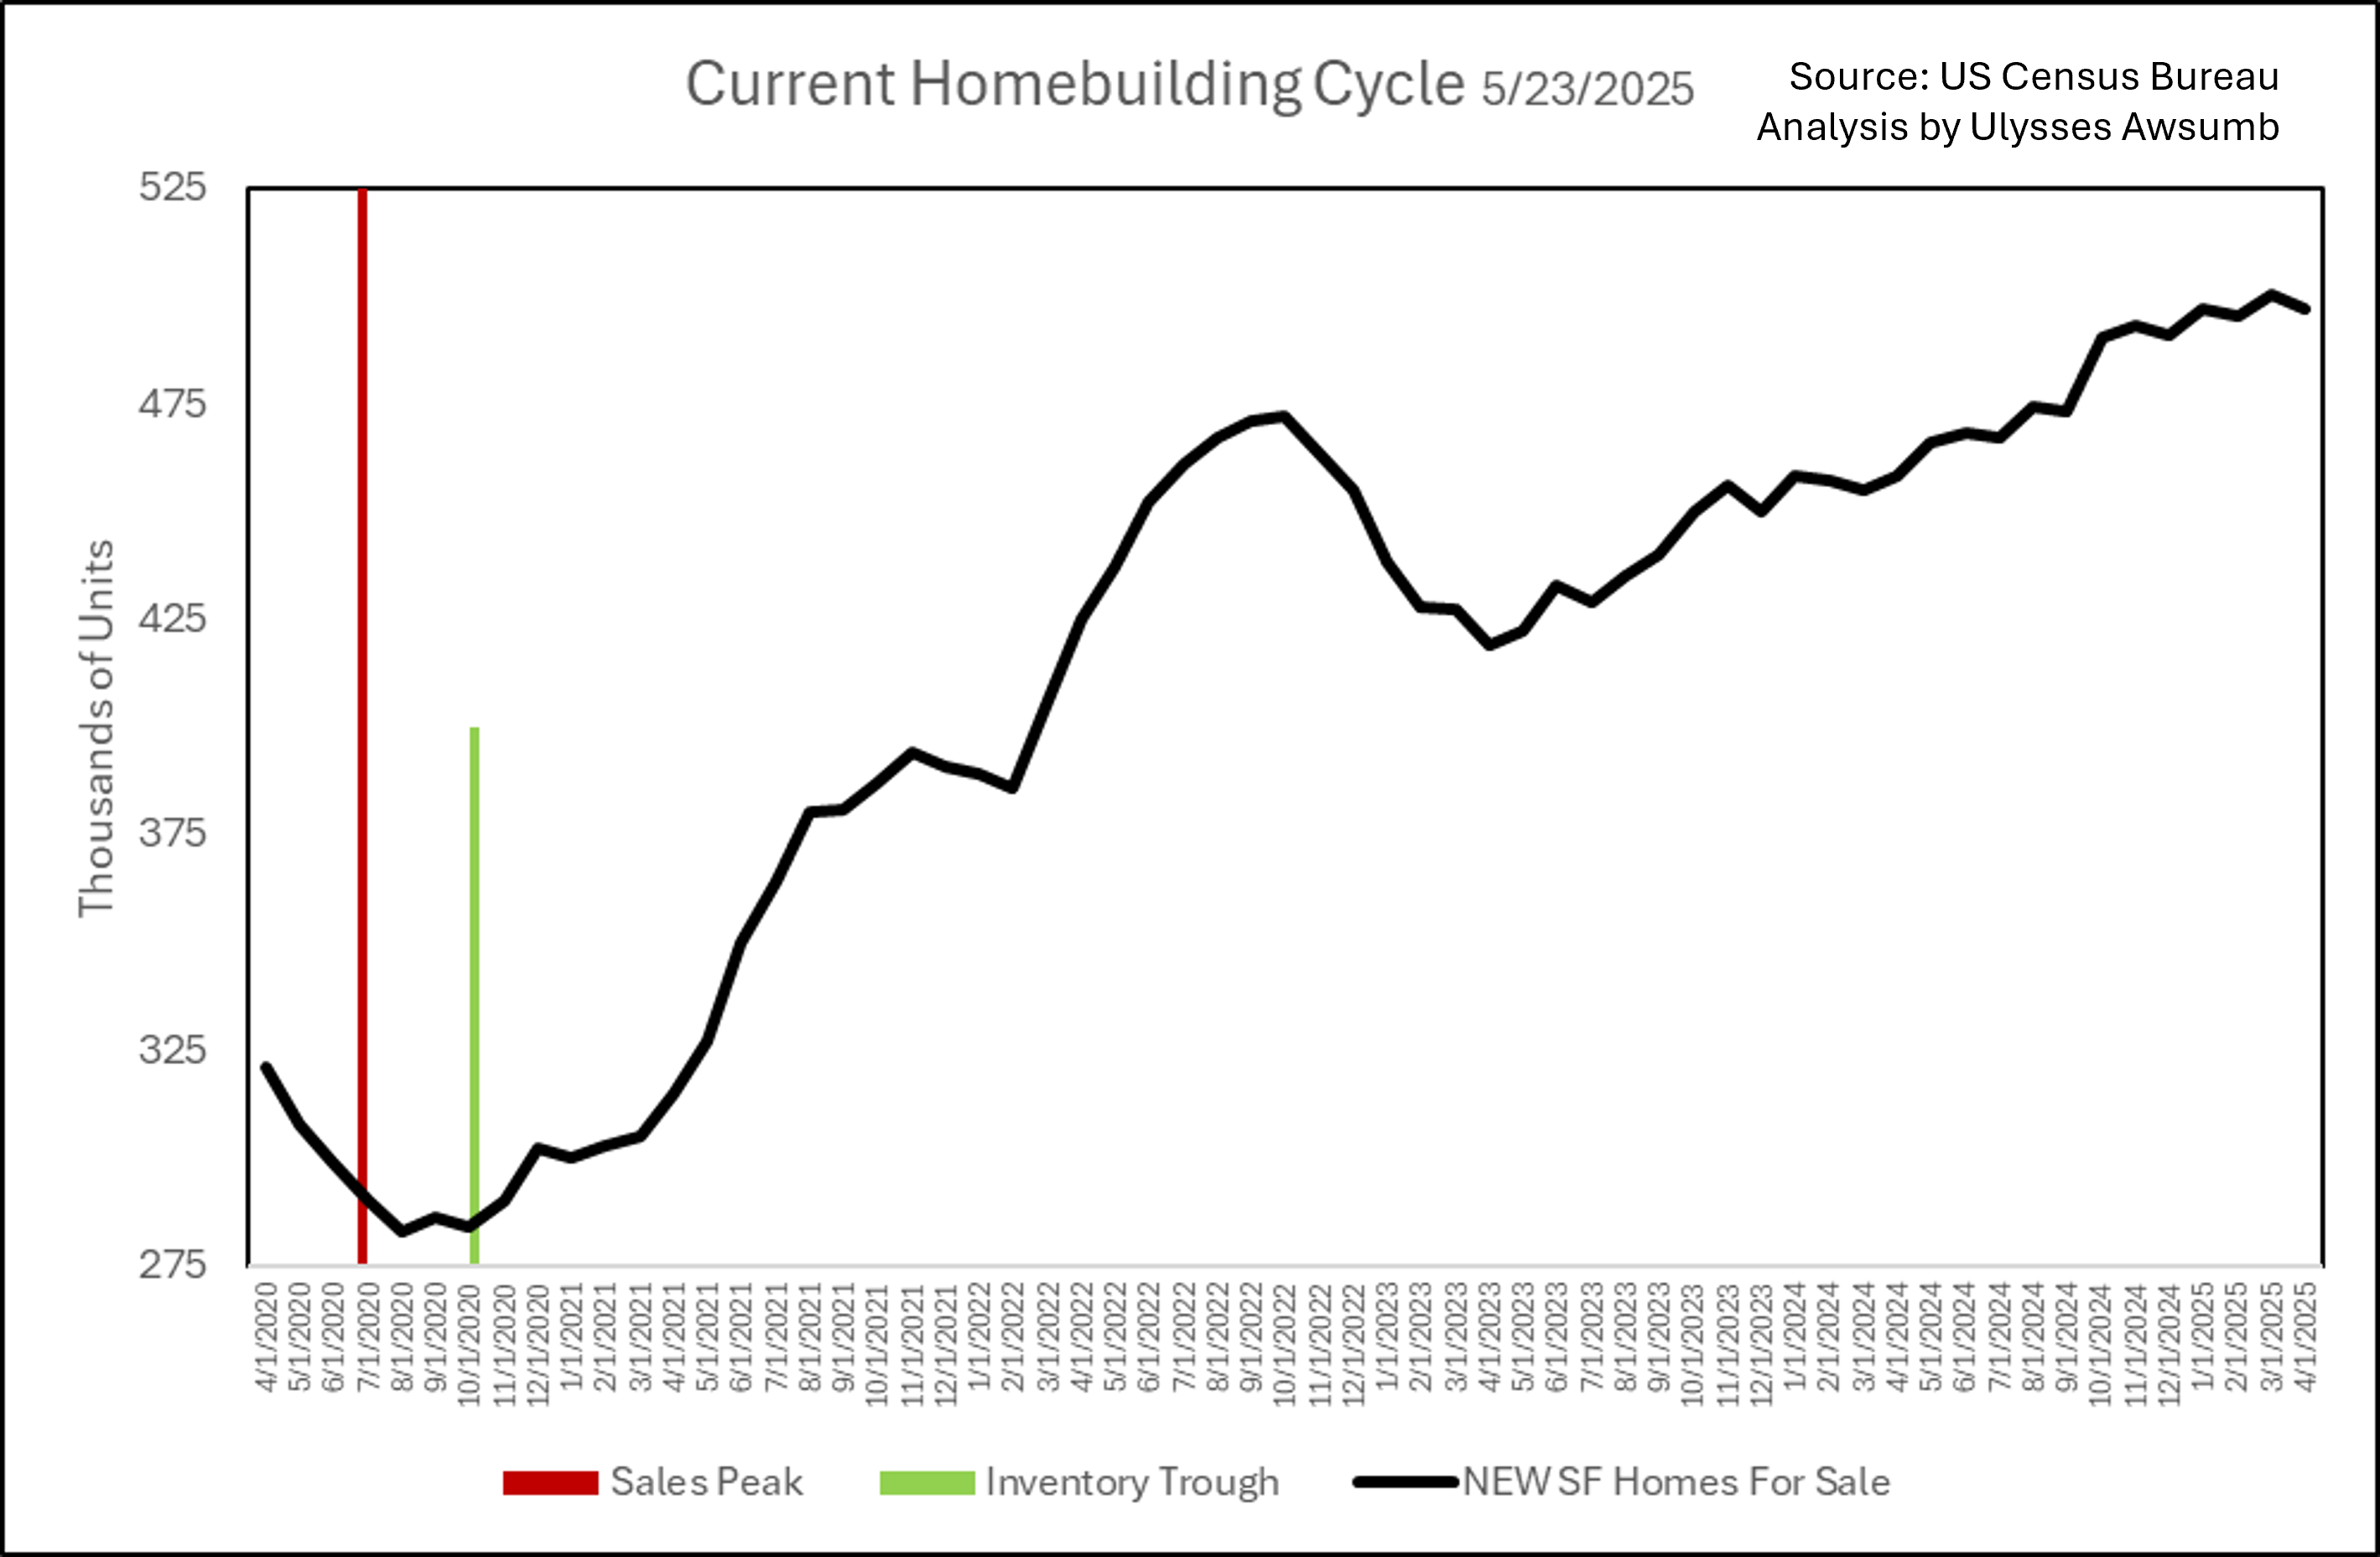
There are 497,000 new single family homes for sale . Down 3k monthly on revised March numbers The past 7 months have been revised to remain between 490,000-497,000. March revisions of Note included revising inventory to 500,000 units for sale on a non seasonally adjusted basis. The most inventory since November 2007, which saw 508,000 units for sale. It should be noted, this is currently the most inventory in recorded history outside of the two years from November 2005-November 2007. June 2006 was the peak inventory month at 570,000 units for sale.
Price Direction
Price decreased year over year by -1.95%. The Median Sale Price for a New Home was $407,200, up from month over month. March price was revised from $403,600 to $403,700. The past 4 months received revisions to pricing.
Mortgage Rates
Mortgage rate increased by 1.12% month over month. April’s average 30yr Fixed Mortgage Rate was 6.73%.
Additional Commentary:
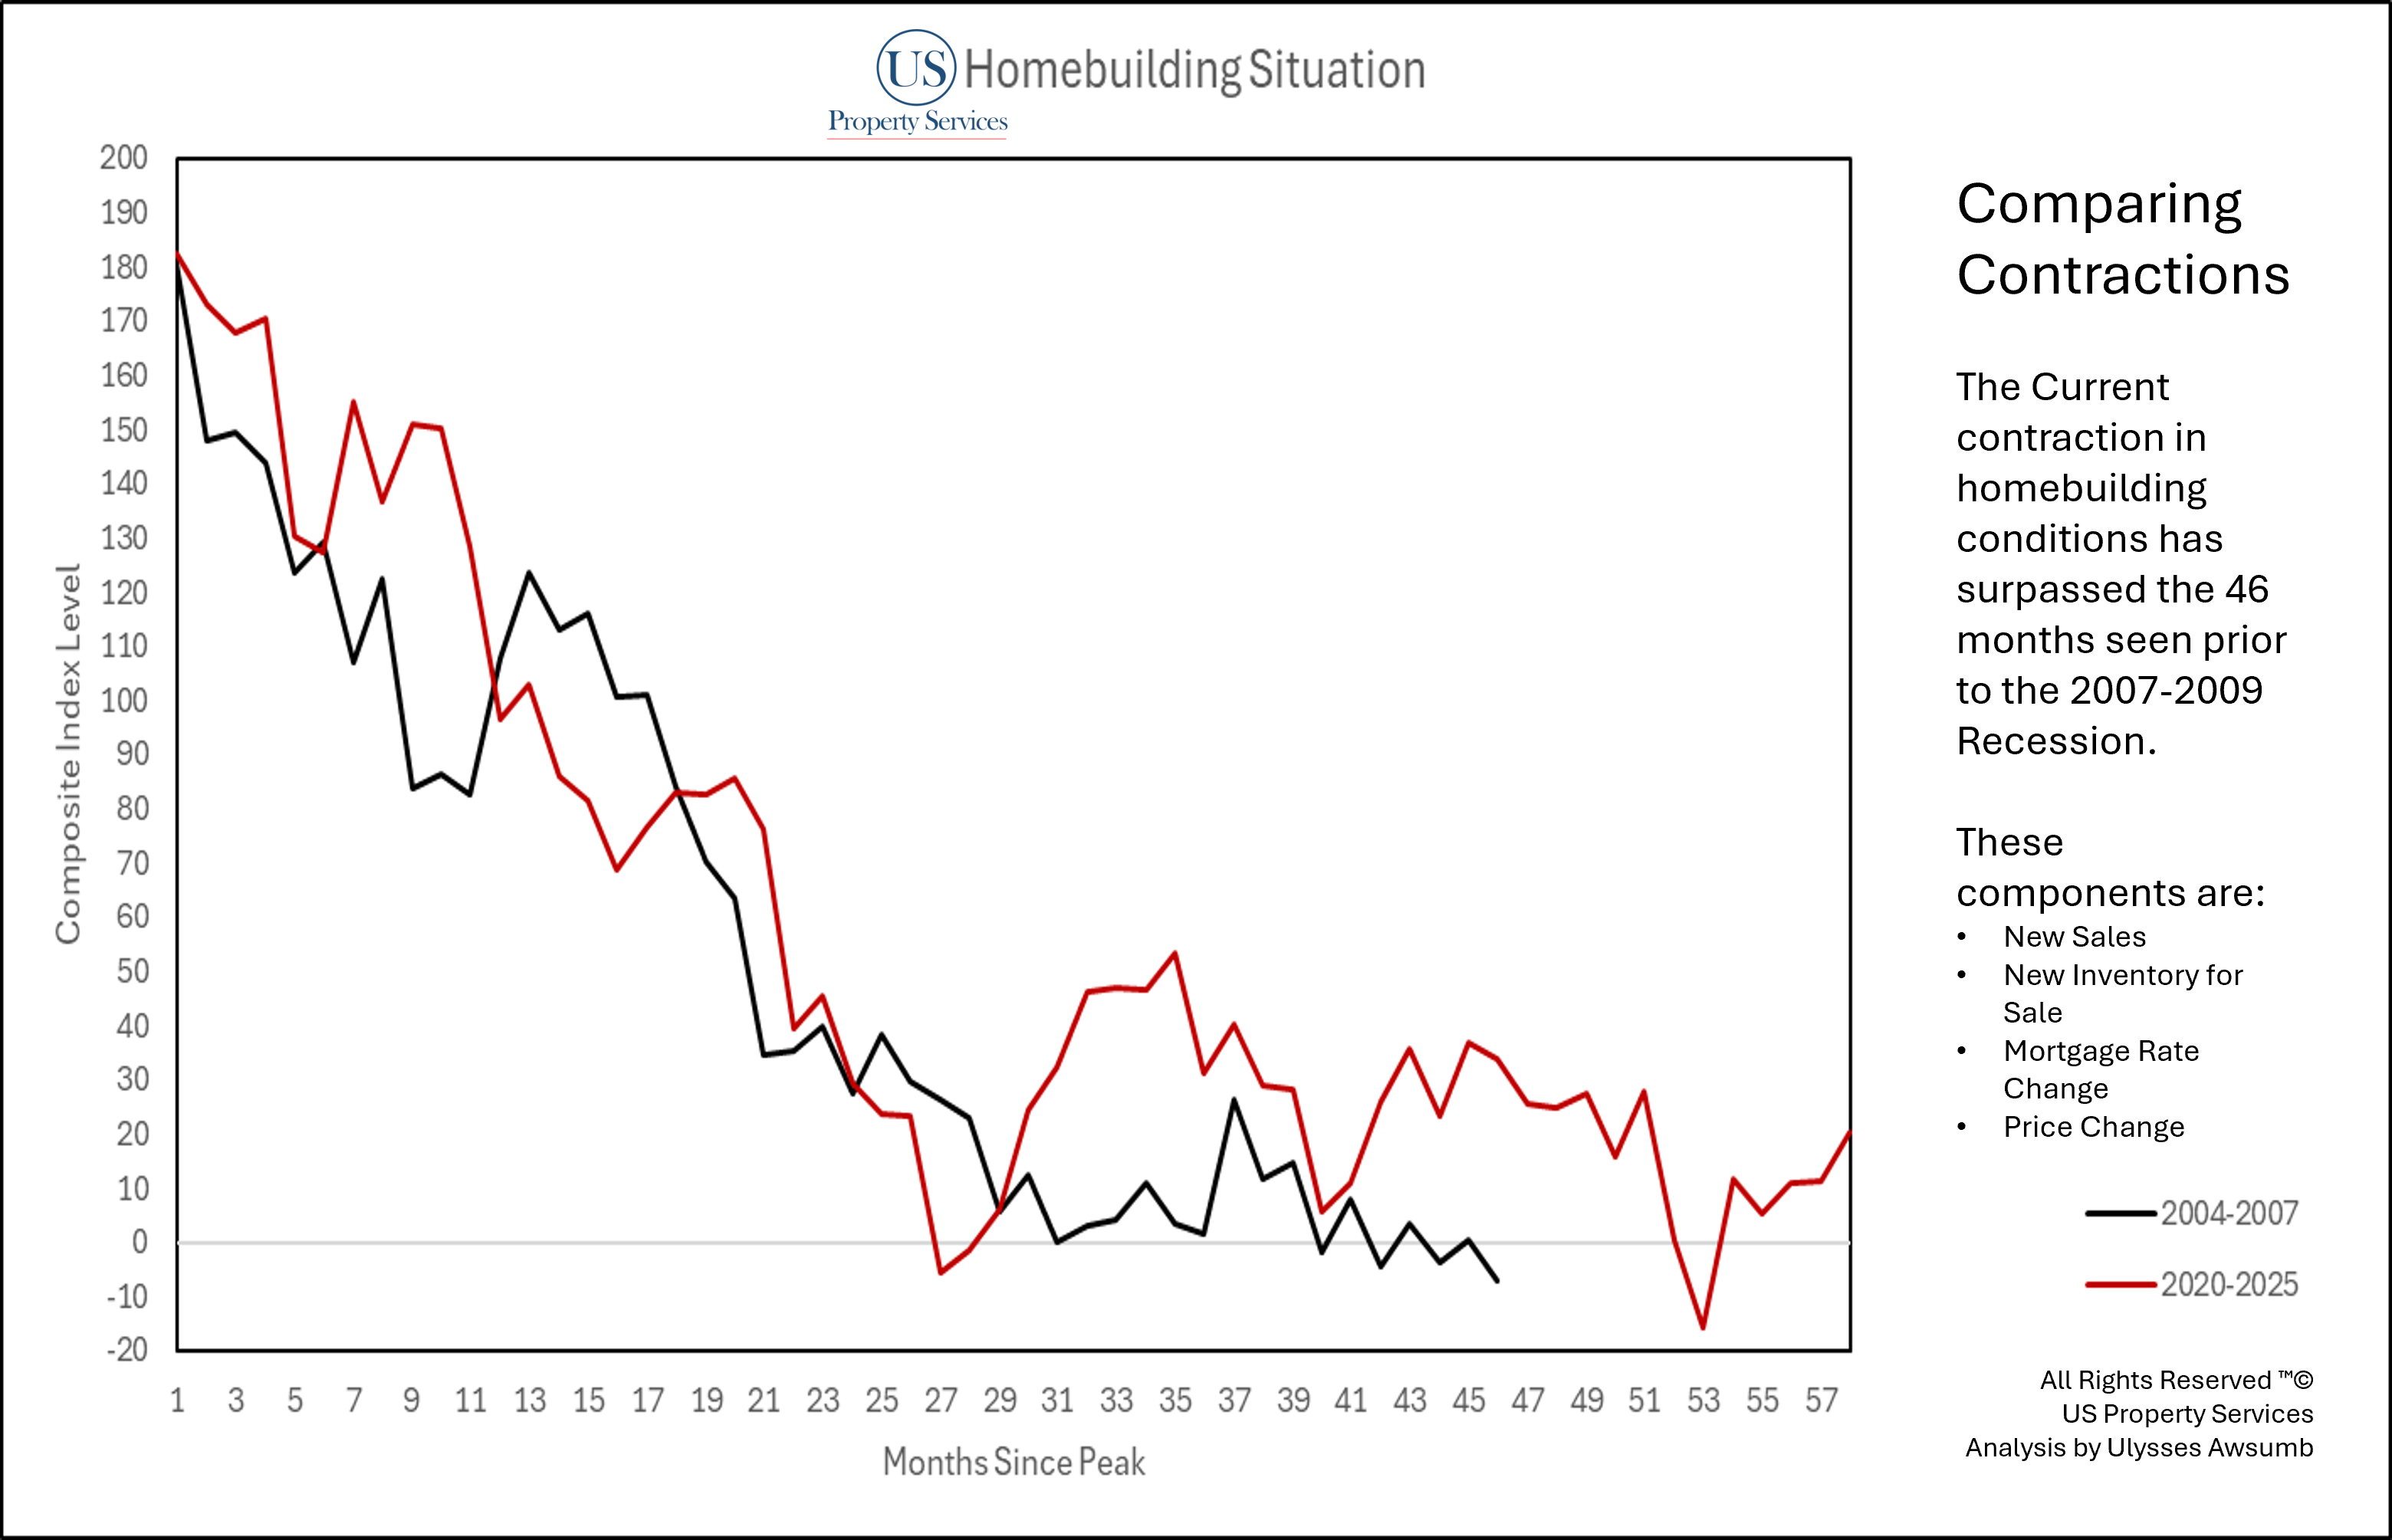
The Current contraction in favorable conditions for homebuilding has now lasted longer than the decline in conditions prior to the 2007-2009 Recession. The Homebuilding situation reached its trough at -7.15 in December 2007 as compared to the current lowest reading -15.84 in November 2024.
It remains to be seen if the trend of improvement continues. There are 3 factors that will weigh heavily moving forward:
Price Contraction
While pricing has declined for 30 months now, the median sale price will likely contract further through the year to move inventory.
Spring Starts
The inventory started during spring at peak sales months may not be absorbed as quickly. March and April sales are historically higher, but the 3 year high mark this April is likely an anomaly given mortgage rates.
US Bond Market
Measuring economic cycles by days from first raise of Federal Funds rates, we have reached the cyclical average time frame for bond rates reducing, which would in turn lower mortgage rates. Given the turmoil in markets, any reductions in rates may come when market sentiment has already shifted to demanding lower actual pricing.
Additional items to keep an eye on are the Government’s responses to the current situation. Director of Federal Housing Finance Agency William Pulte (of the Pulte Homes family) has become a vocal critic of Federal Reserve Chair Jerome Powell over Federal Funds Rates (which do not set mortgage market rates) and has publicly stated his desire to create new incentives through Government Sponsored Enterprises for homebuilders. GSE’s such as Fannie Mae, Freddie Mac as well as Govt. Entities like FHA. It should be noted, the Director has a longstanding Fued with the current executive team in place at Pulte Homes, and used DR Horton as a recent example of builders that “need help”. DR Horton being the largest homebuilder in the Nation. Potential actions may not have the intended consequences desired.
One additional item to note, that market analysts seem to ignore at their own peril, that has large carry cost implications for builders, is the number of “Spec Homes” (speculative) that have yet to be started. These are 100% completed lots, that have a SPECIFIC home tied to the lot via permit at the local building office. As in, these are speculative builds, and only that home plan as permitted may be constructed on the lot. This number had already surpassed the pre “GFC” crisis level, but just hit a 35% year over year increase since last April.

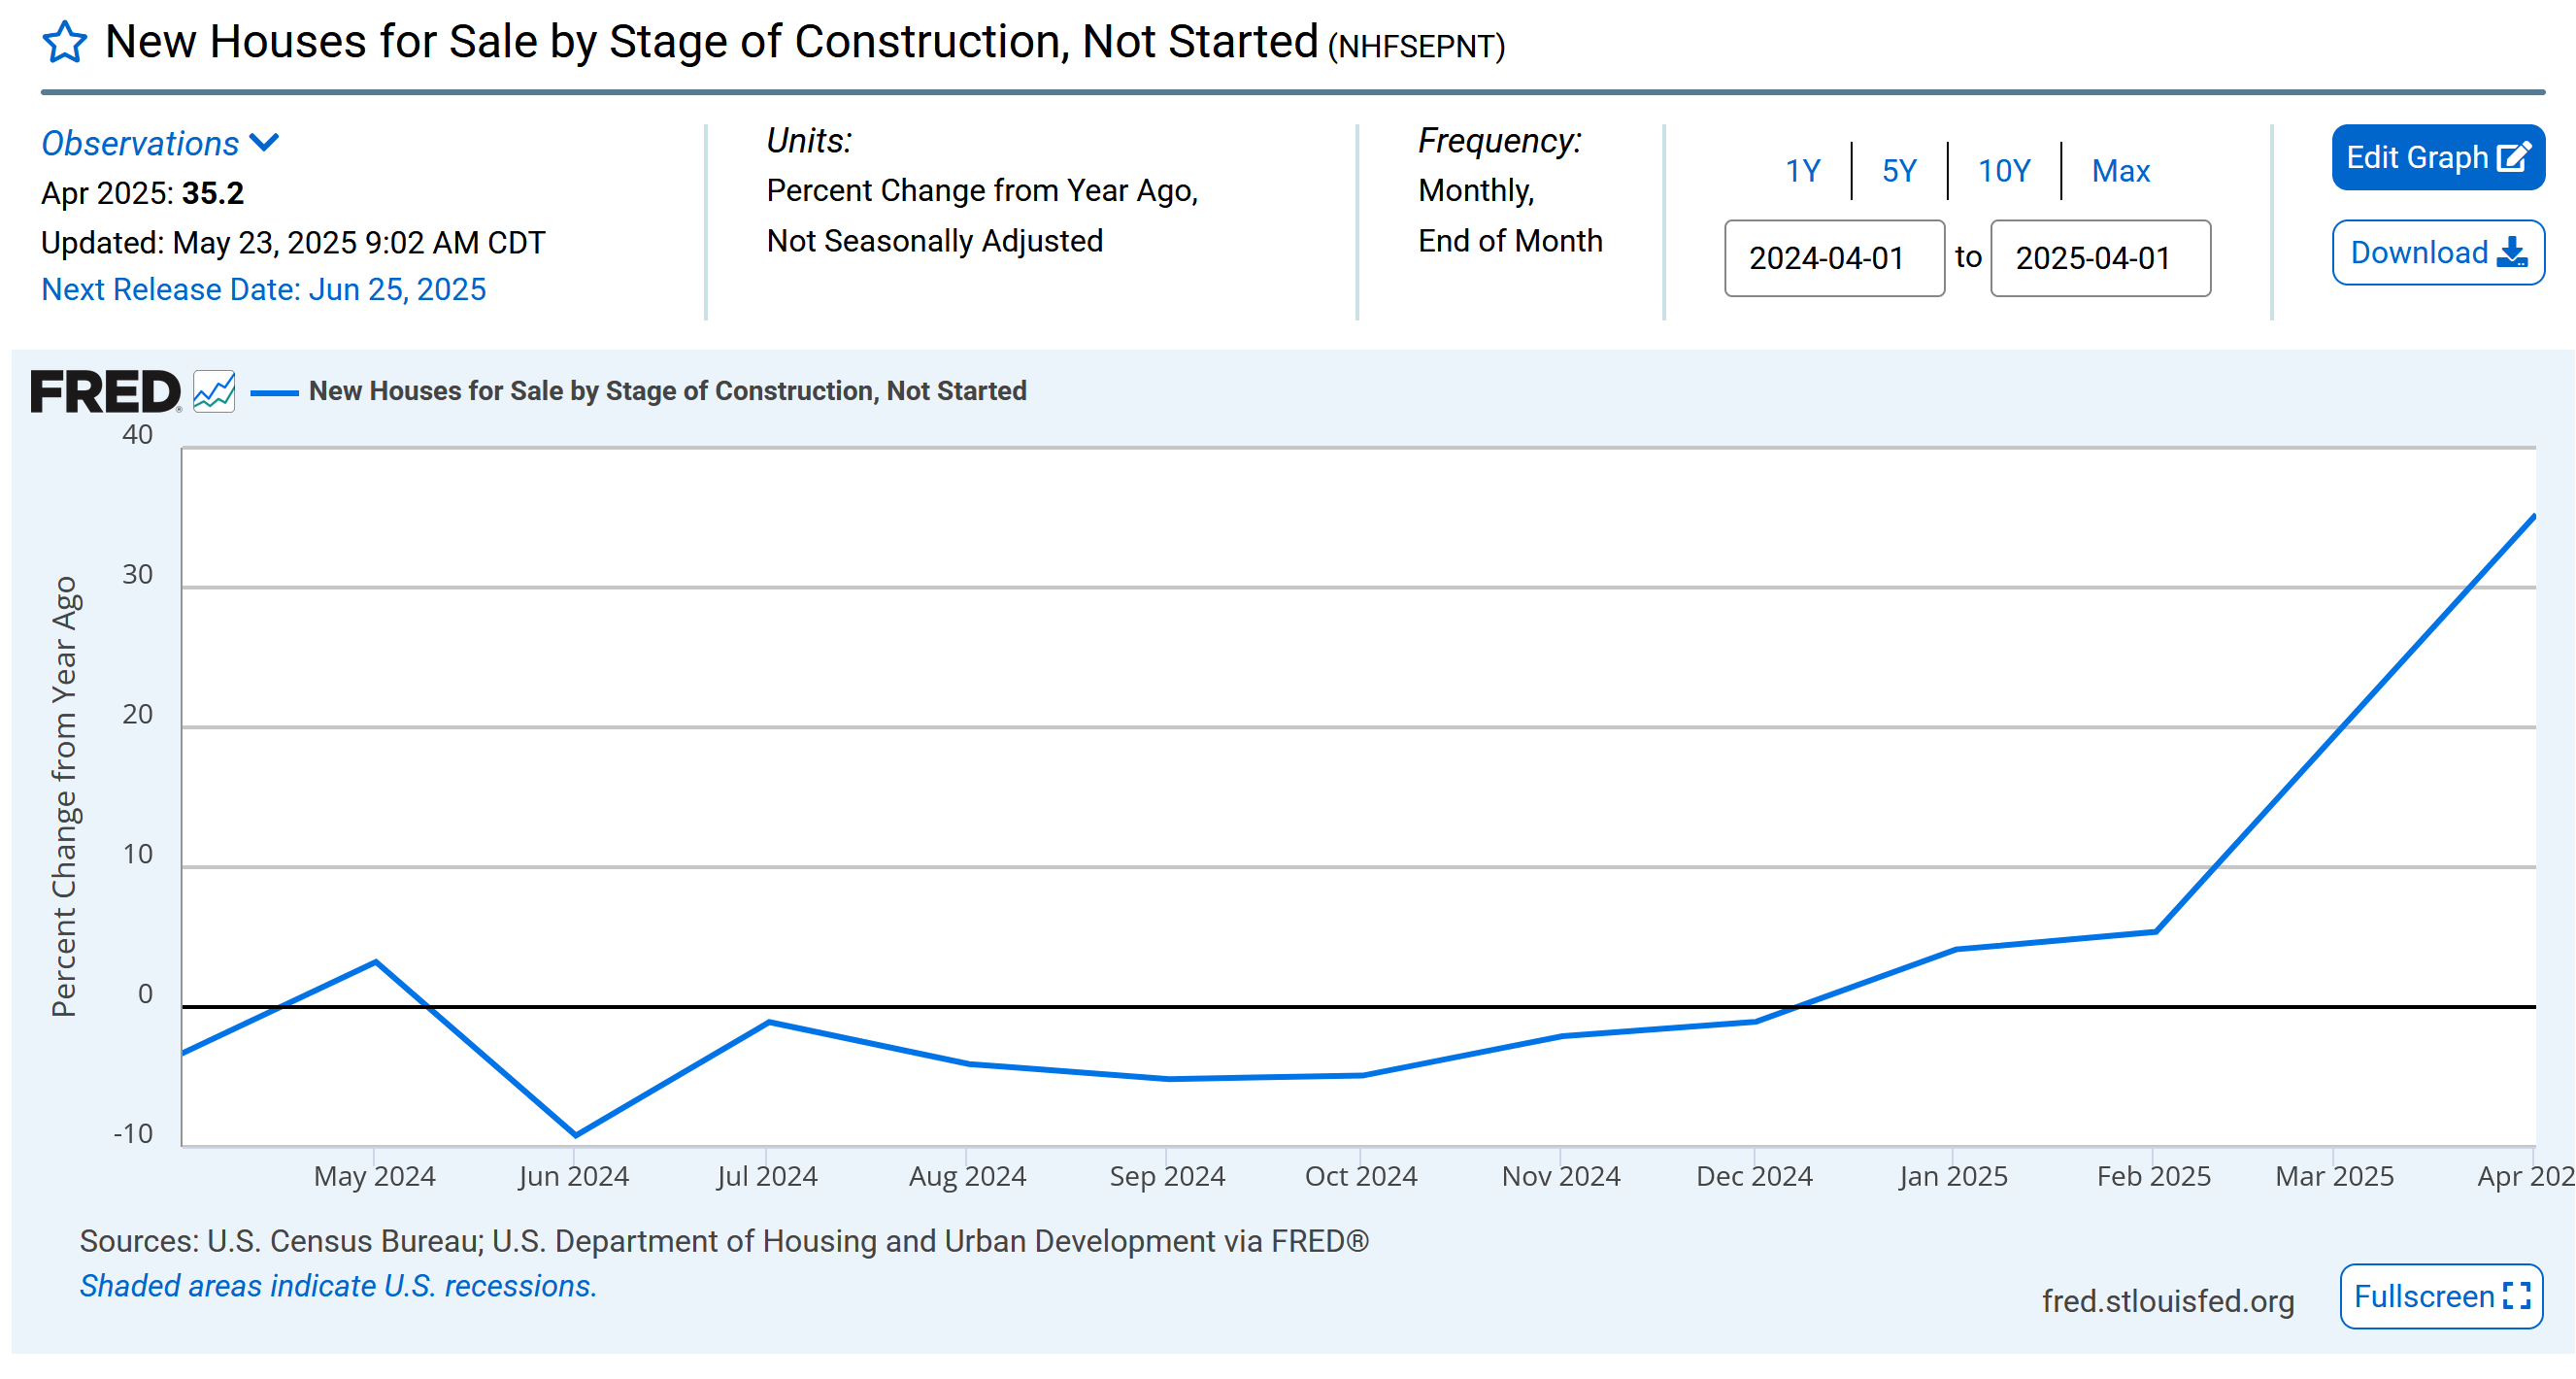
This keeps the market within 12% of the all time record of Spec homes for sale in the US.

Where is the pain being felt? In Net Income to the largest builders. Q1 earnings and non calendar Q2 earnings reports have all pointed to decreased net income.
A 10% decline in sales at $4.5B requires an increase of 5% Gross margin to maintain income. As in 25% of $4.5B translates to 30% of $4.05B.
Continued increase in SG&A (Selling, General and Administrative) costs as incentive use ranging from: forward rate buy down purchases, closing cost assistance, to outright COGS categorized as incentives such as free upgrades/finishes put further pressure on builders
Increases in SG&A are not a 1:1 in Net Income, as seen in DR Horton Earnings. $DHI increased SG&A from 7.2% to 8.9% which translated to an in increase of 3.7% in cost.
The overall decrease in earnings per share was >26%.


In future publications I will explore the the earnings in greater detail.
The Homebuilding Situation may be improving, but the market negative effect on builders may only be getting started. Watch for more reports and conversations regarding lot supply and cost reduction efforts in the near future from the industry.

The Method and Research for the index is available Here:
https://www.uspropertyservices.com/homebuilding-situation-index