Date: August 28th 2025
Time: 7:40pm
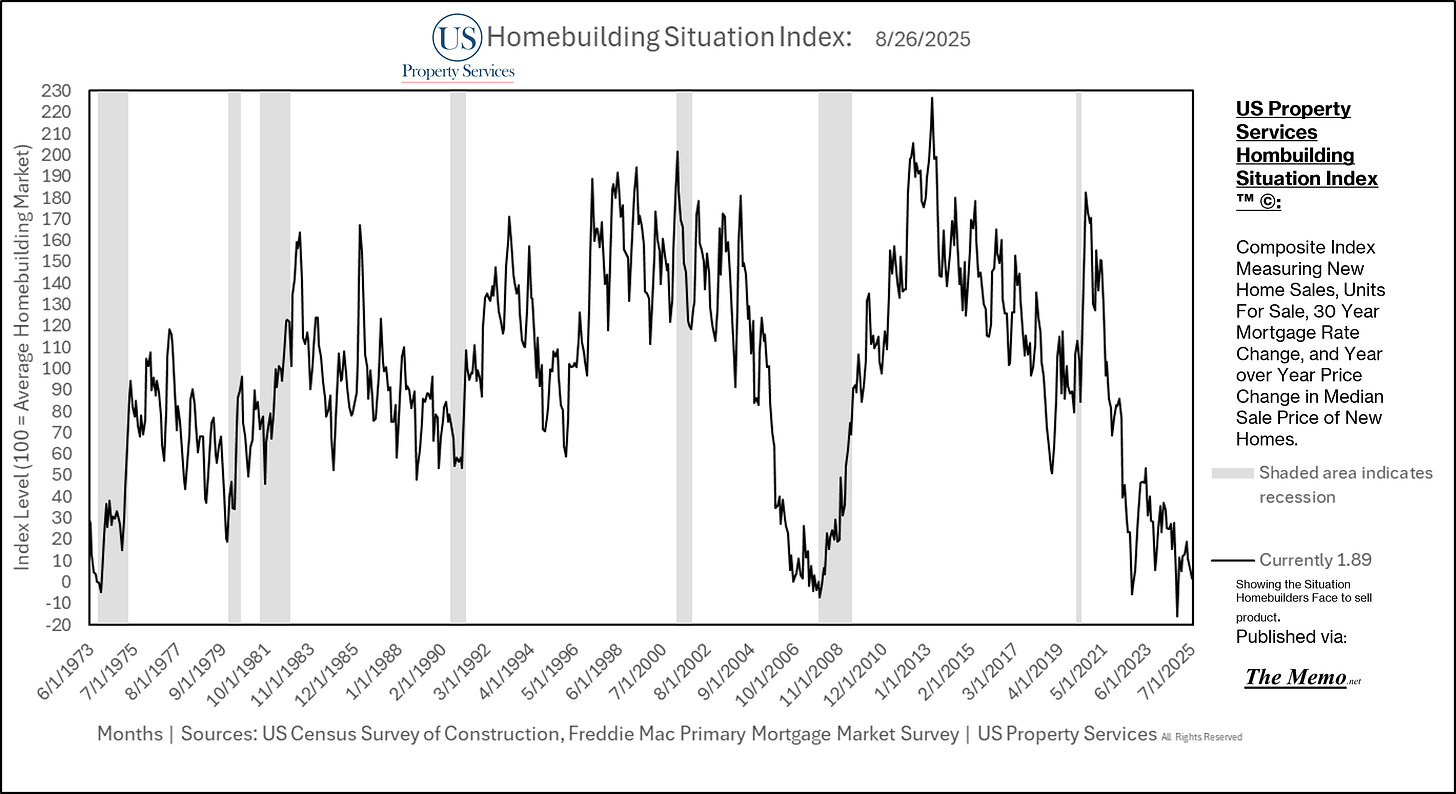
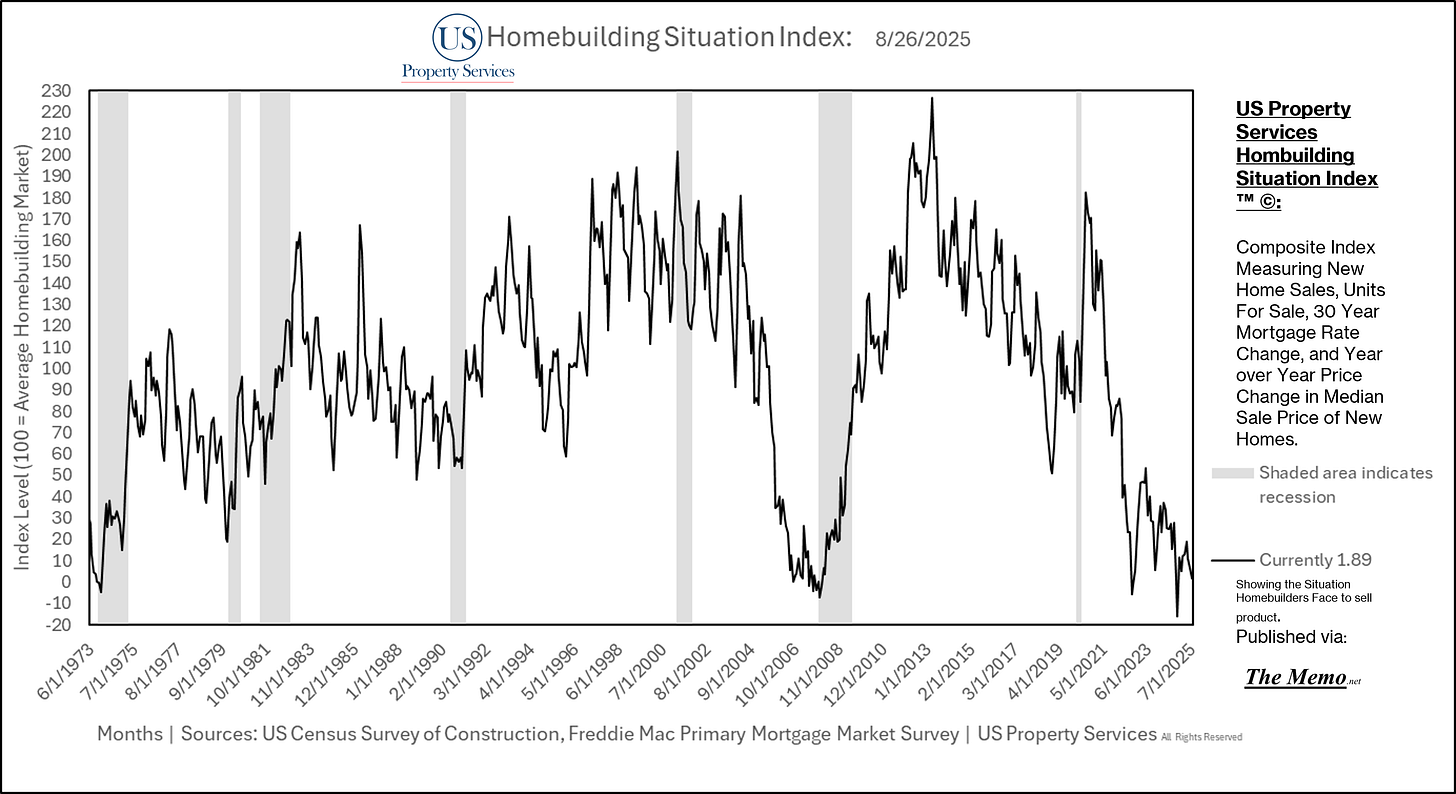
The Homebuilding Situation (Composite index measuring sales, inventory, price and mortgage rate direction change) from July 2025 stands at 1.89 This is 98.11 points below the Average Situation for Homebuilders. The situation increased by 2 points.
This report contains builder earnings analysis and Price Targets for 20 Metropolitan Statistical Areas, as well as the index.
Sales
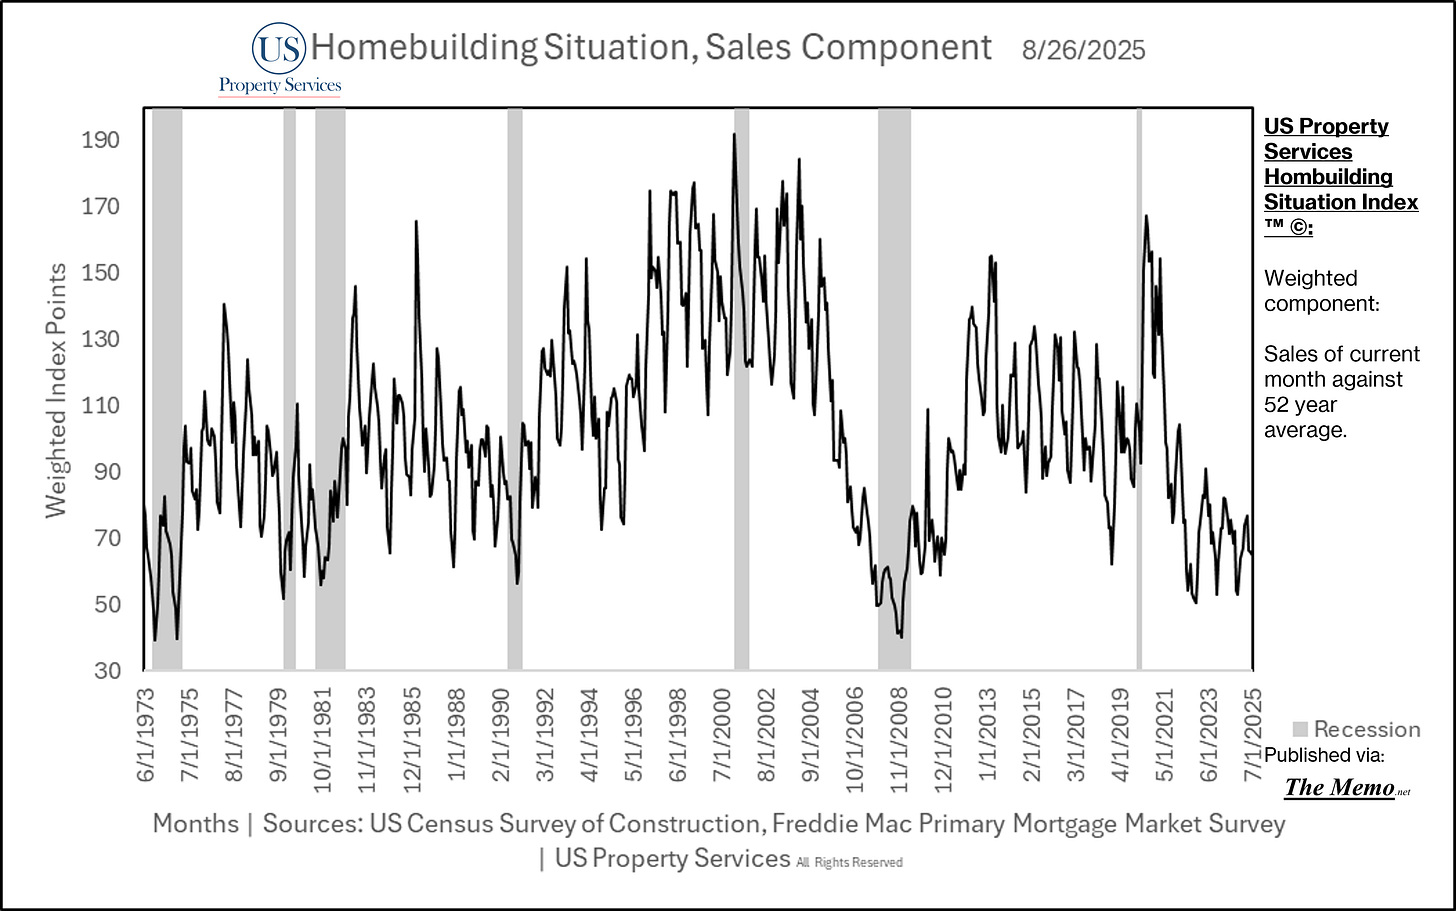
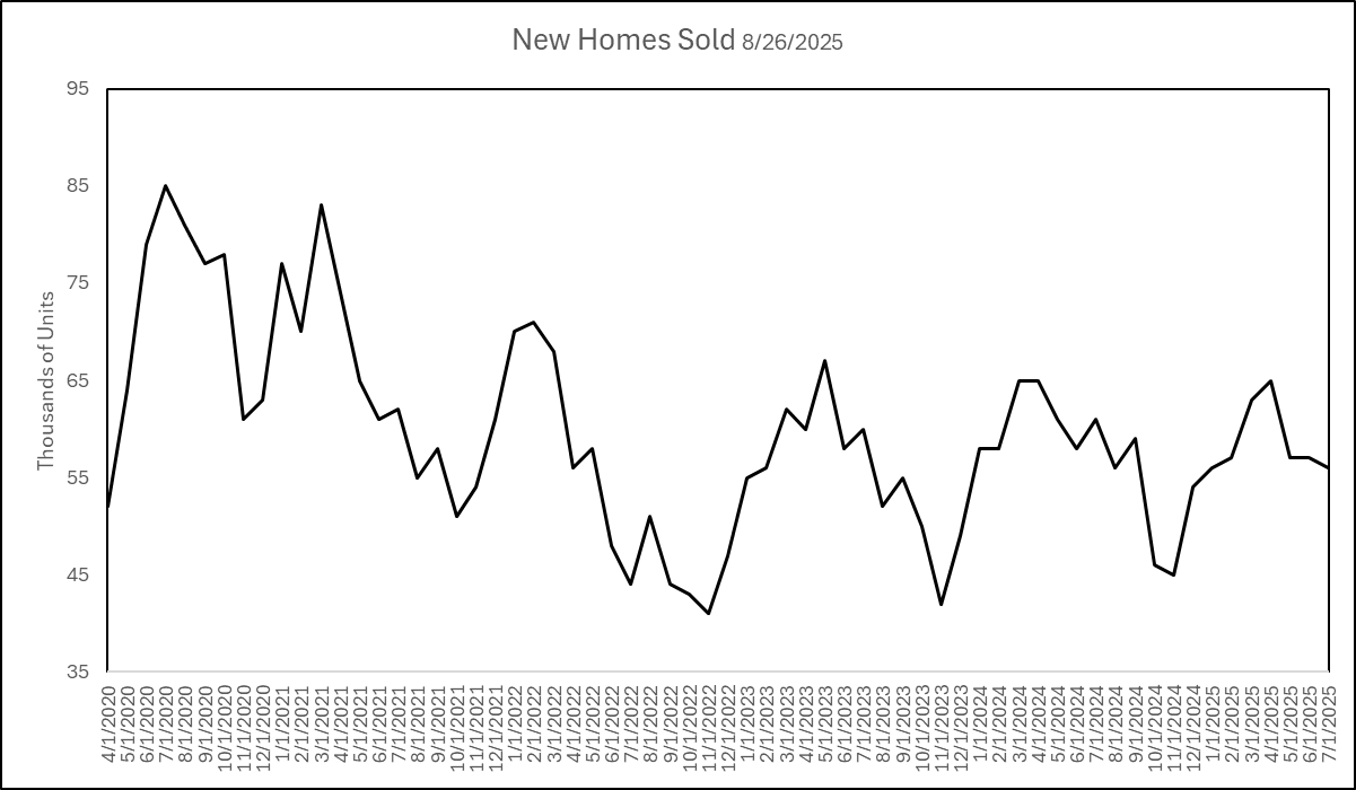
July sales fell to 56,000 units sold from 57,000 in June. 1,000 more than the average monthly sales rate across the last 52 years. Sales made up 64 points for the index.
Inventory
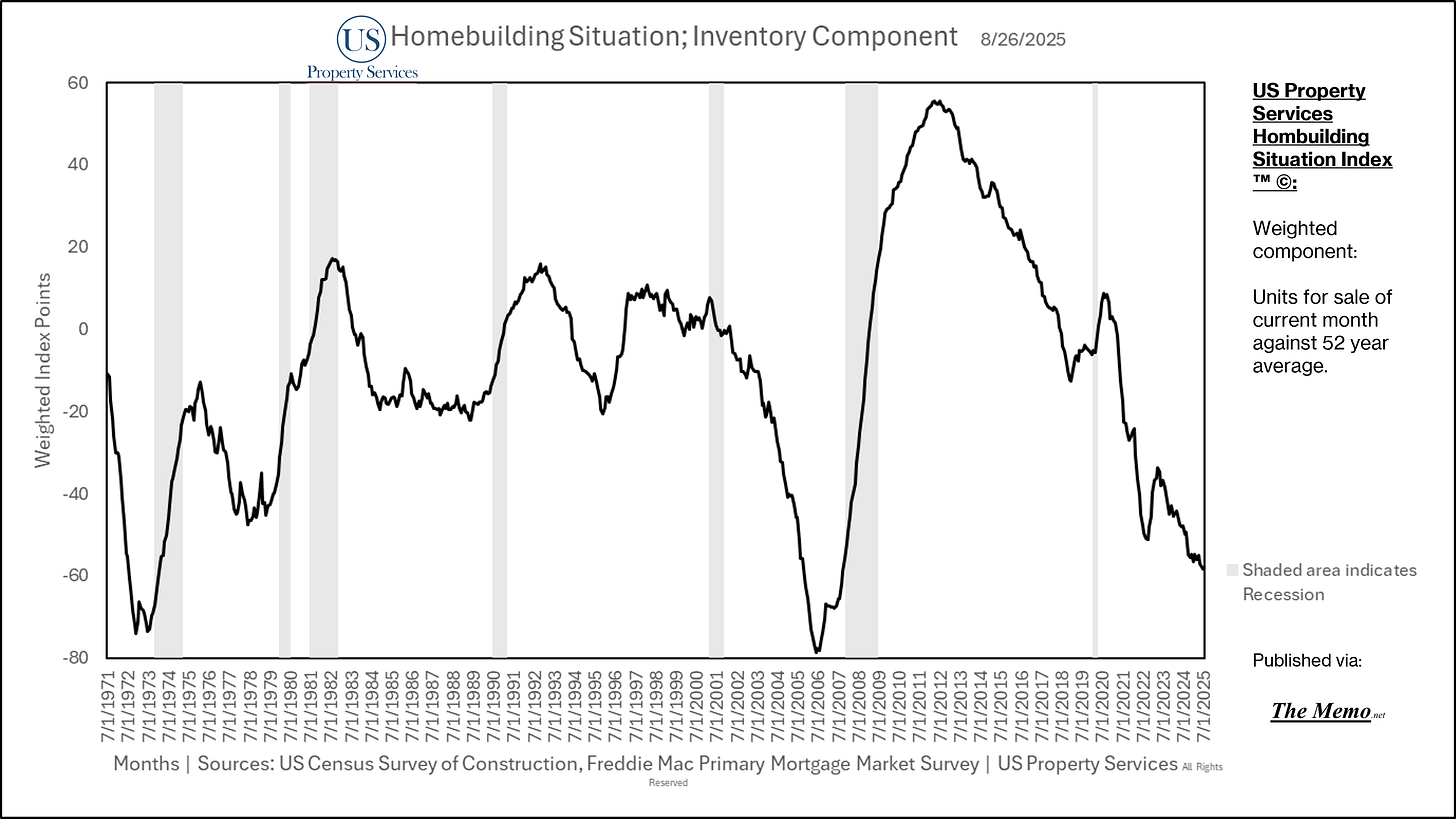
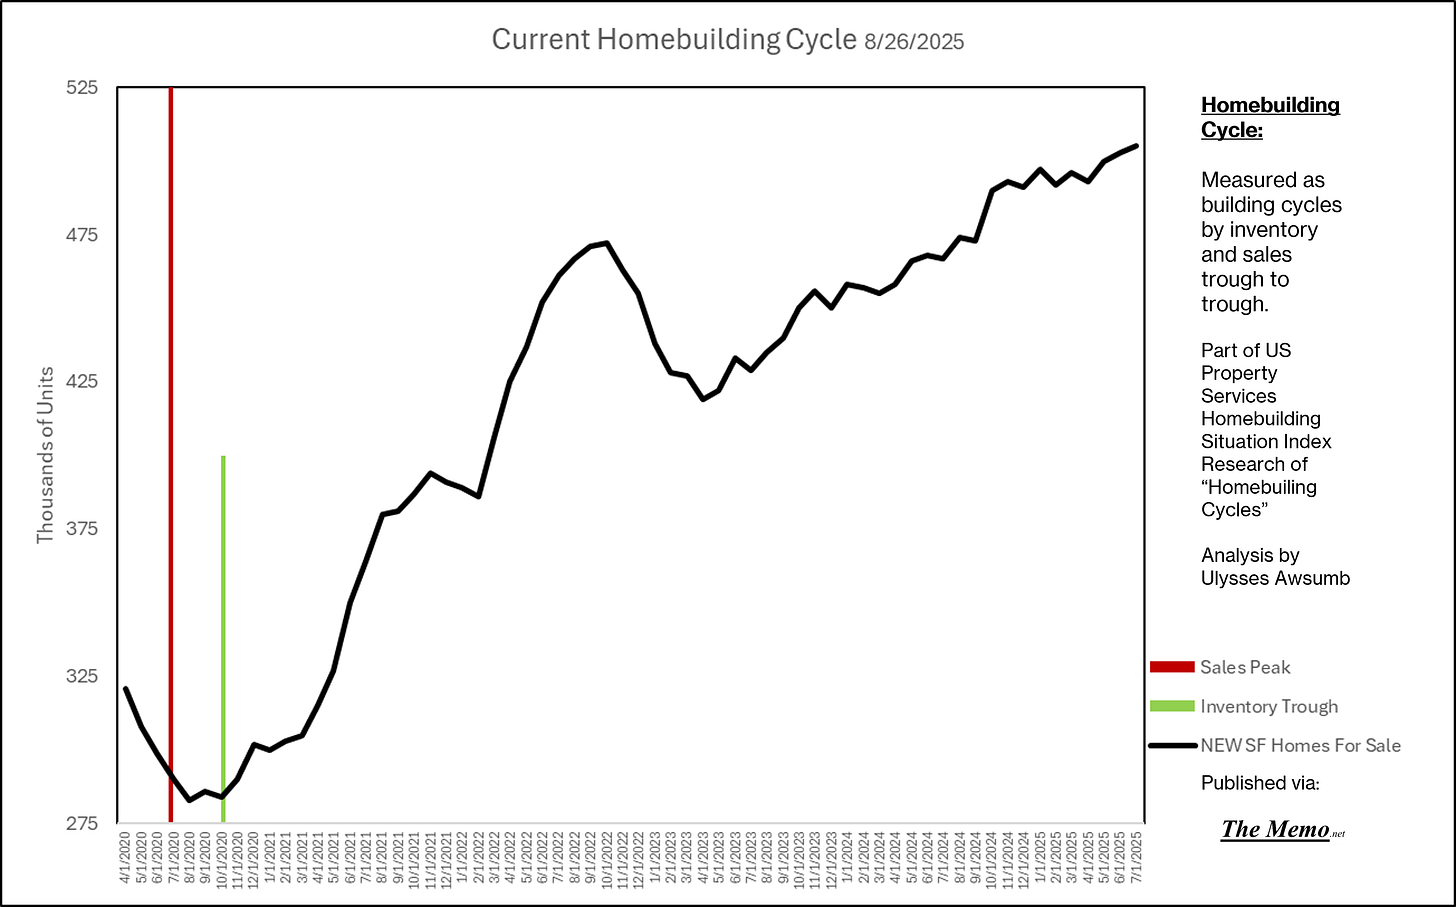
There are 505,000 new single family homes for sale . Up 2,000 over the past month (revised). The past 10 months have been revised to remain between 490,000-505,000. Last months 511,000 was revised down to 503,000. This is currently the most inventory in recorded history outside of the two years from November 2005-October 2007. Current inventory contributed -58 points to the index.
Sales do not include cancellation rates, which have been elevated this year. Current “speculative” inventory, consisting of completed homes for sale and lots with specific permitted homes for sale have reached 230,000 units (Completed units revised down).
Publicly traded builders by and large increased community count this year, increasing permitted spec homes for sale. Lennar was a leader in community count growth at 29% Year over year increase in active communities.
Price Direction
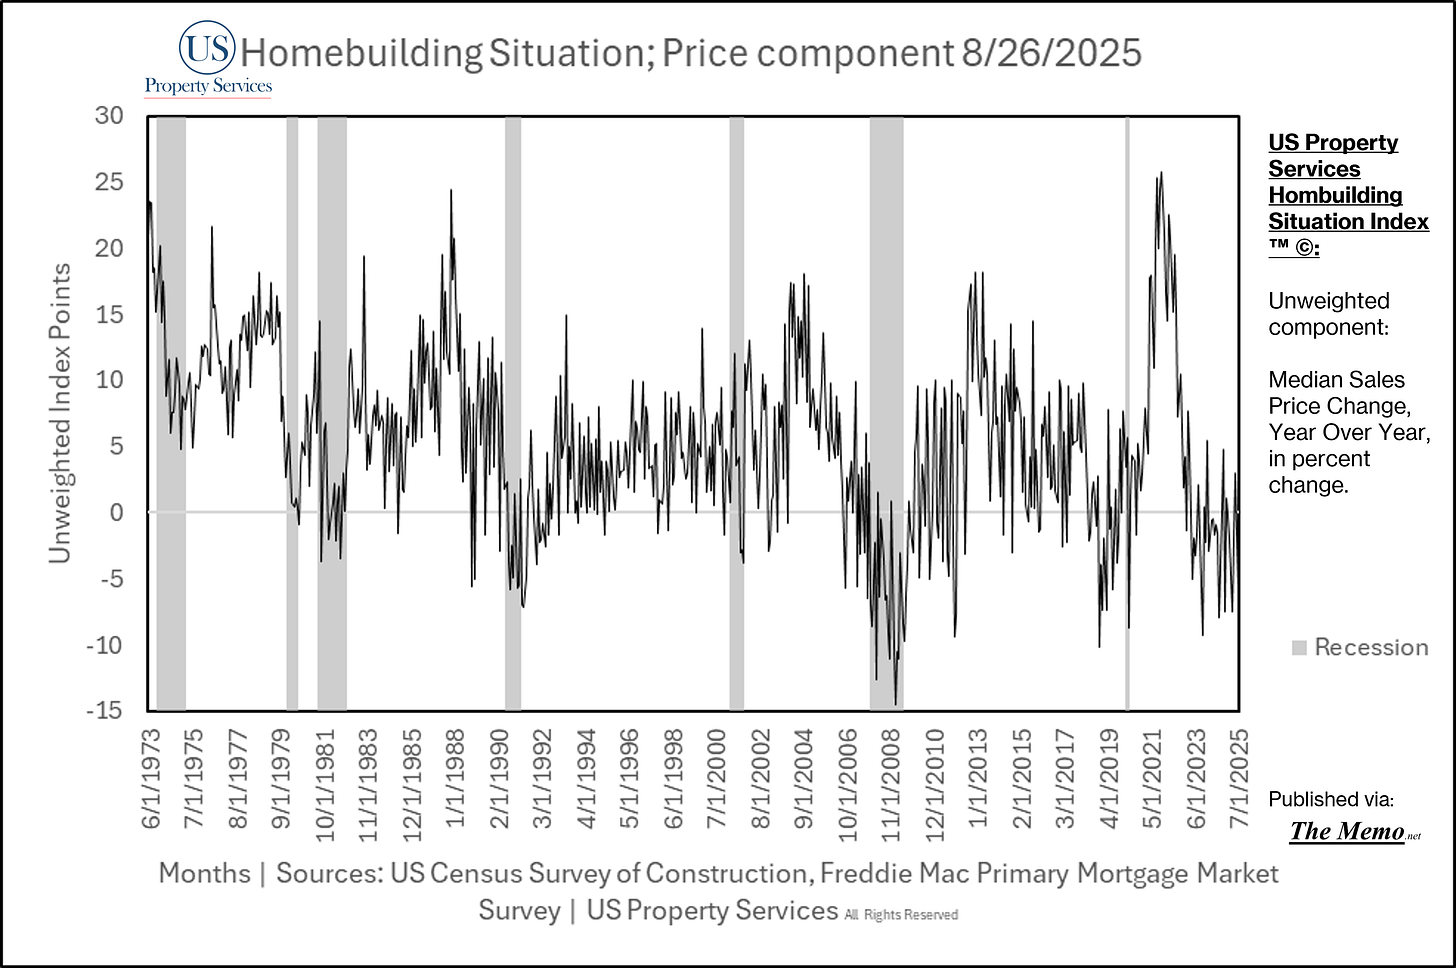
Median Sales Price decreased year over year by -5.9%. The Median Sale Price for a New Home was $403,800, down month over month after revisions as well. The past 4 months received revisions to pricing.
Mortgage Rates
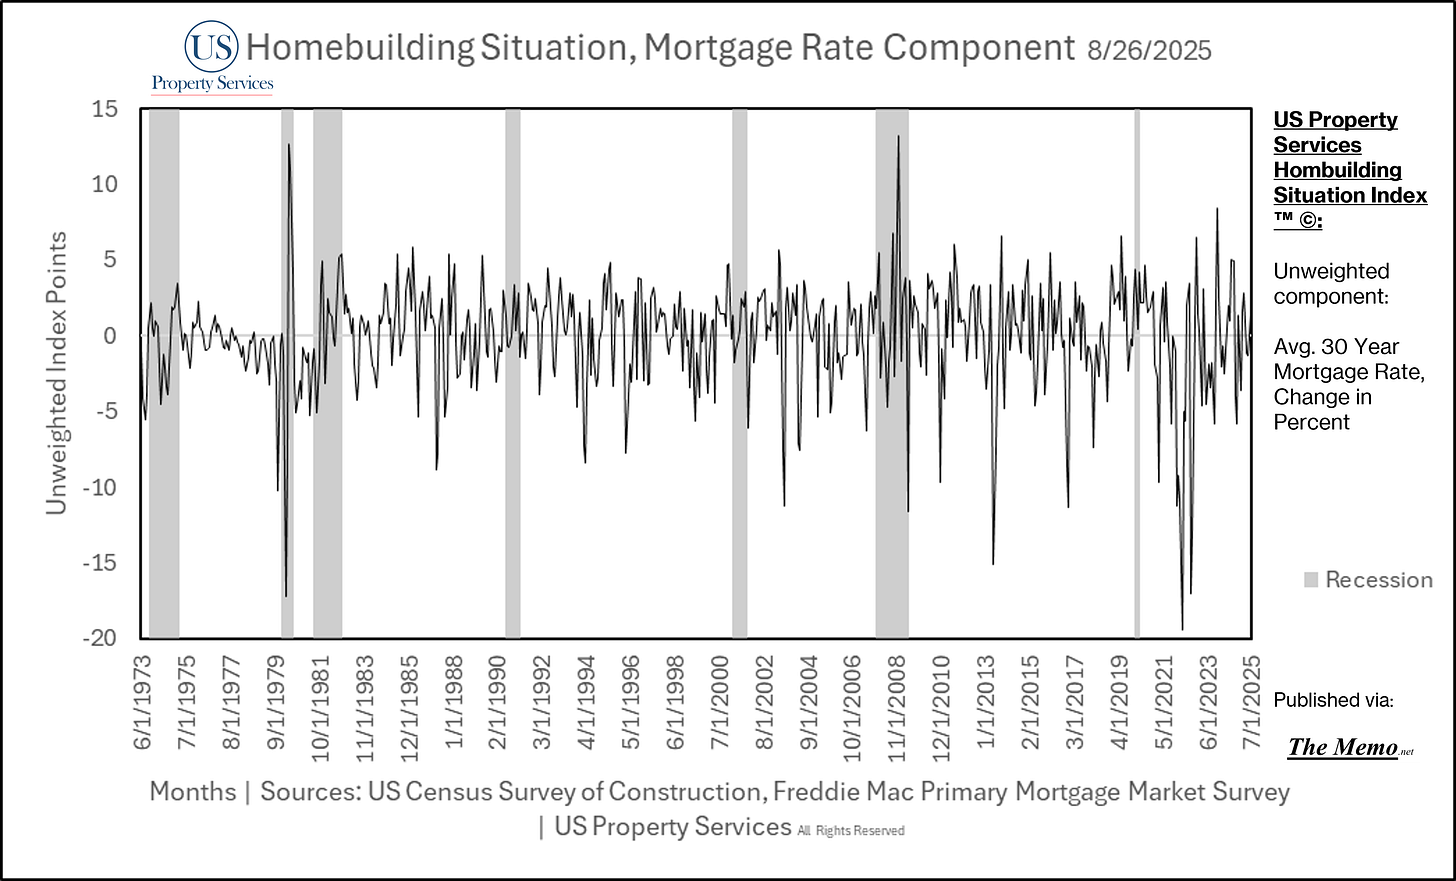
Mortgage rates decreased by 1.4% month over month. July’s average 30yr Fixed Mortgage Rate was 6.72%.
Additional Commentary:
Builder Earnings
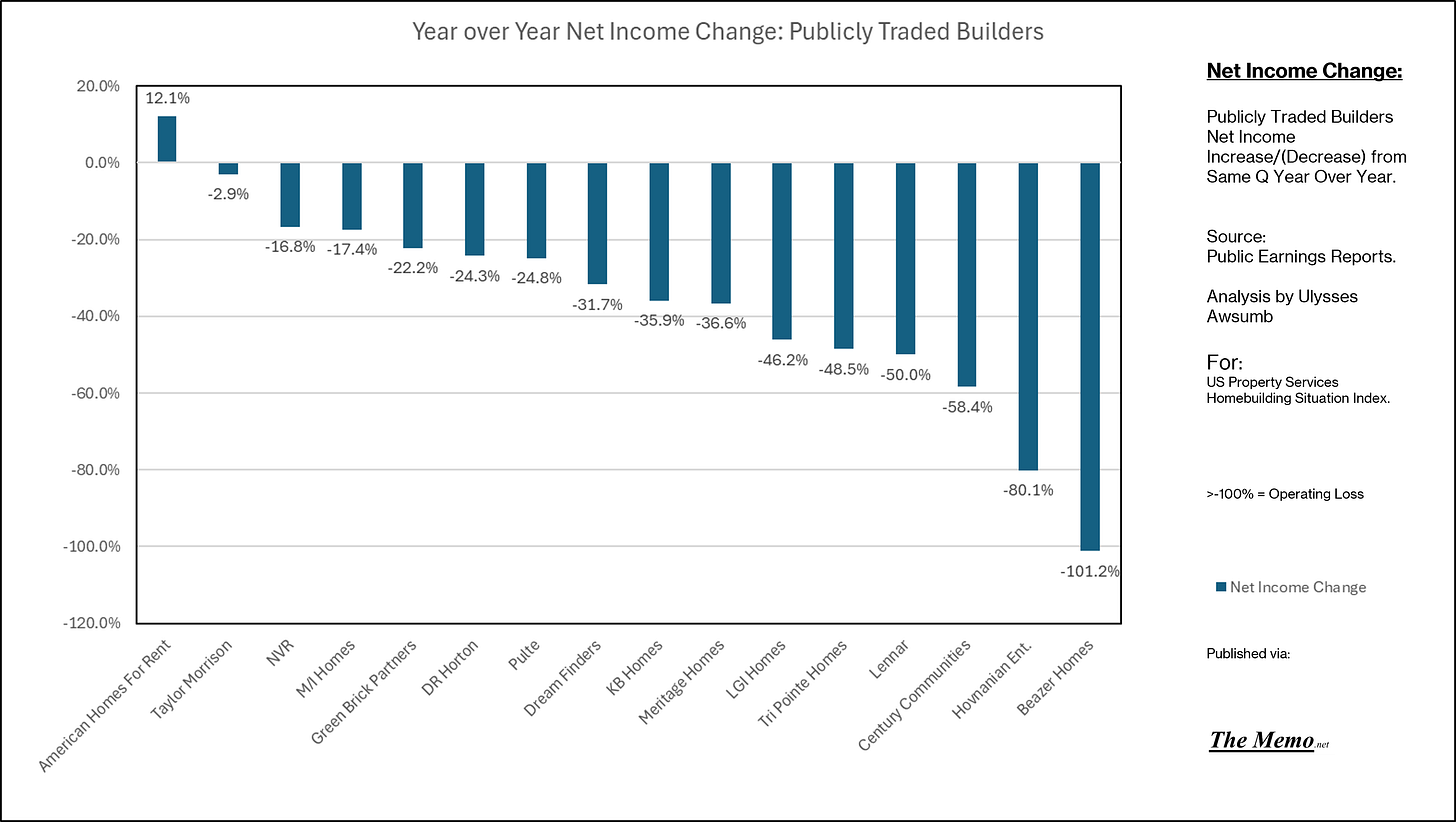
Q2 Earnings have been released for the majority of the 20 largest publicly traded homebuilders. Amongst the 16 builders analyzed, the average Net Income change on a same quarter year over year basis was -36.6%. The biggest change was -101.2% as Beazer Homes reported an operating loss. Rounding out the bottom 4, K Hovnanian saw net income decline -80%, Century Communities -58% and Lennar -50%.
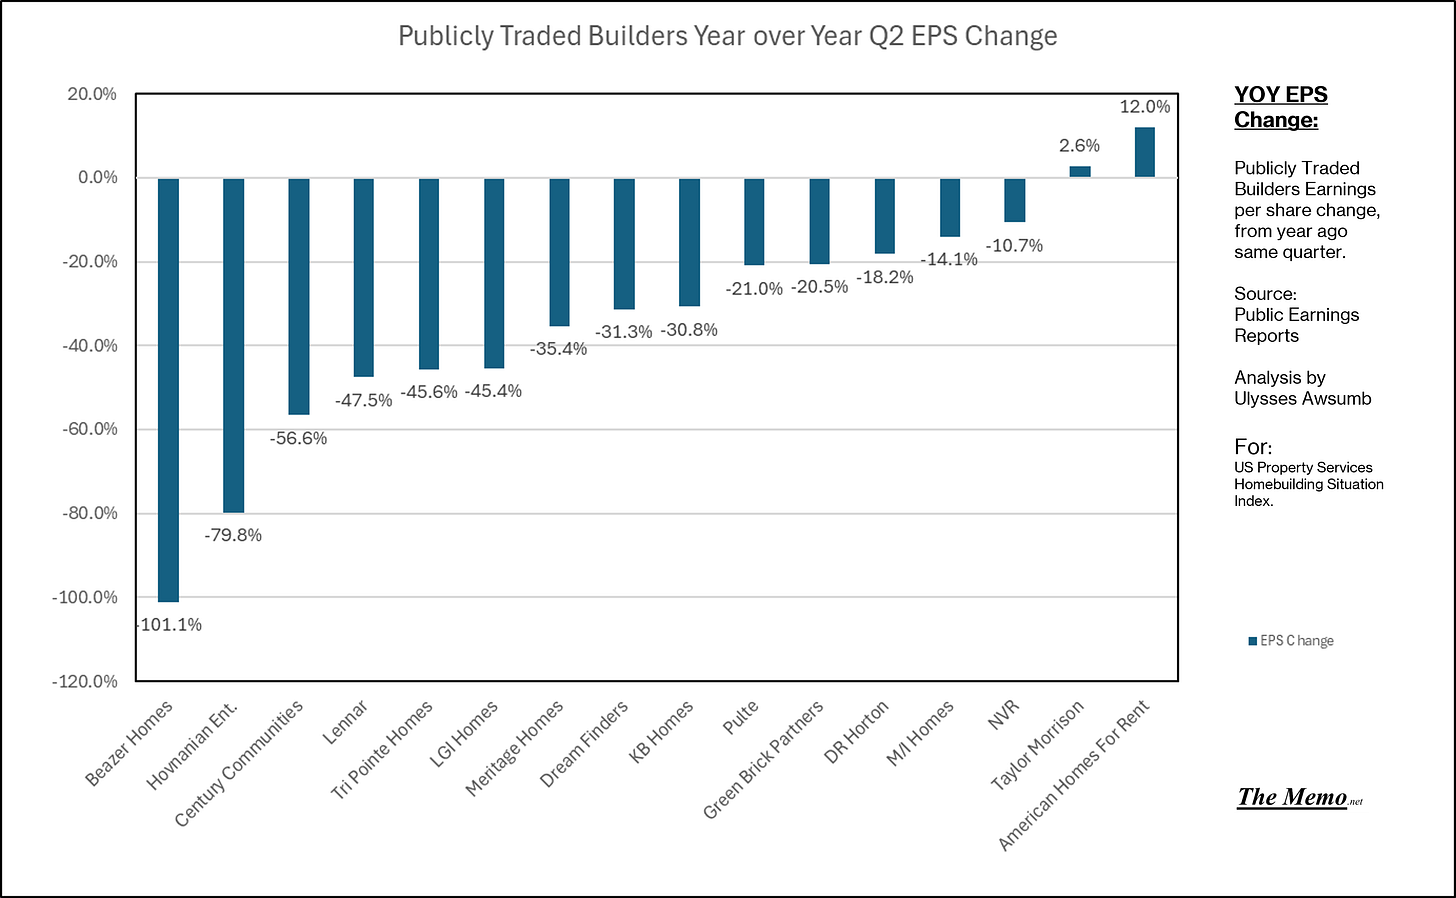
Only 2 saw increase in earnings per share. American Homes for Rent and Taylor Morrison. Only American Homes for Rent saw increased net income on the same basis.
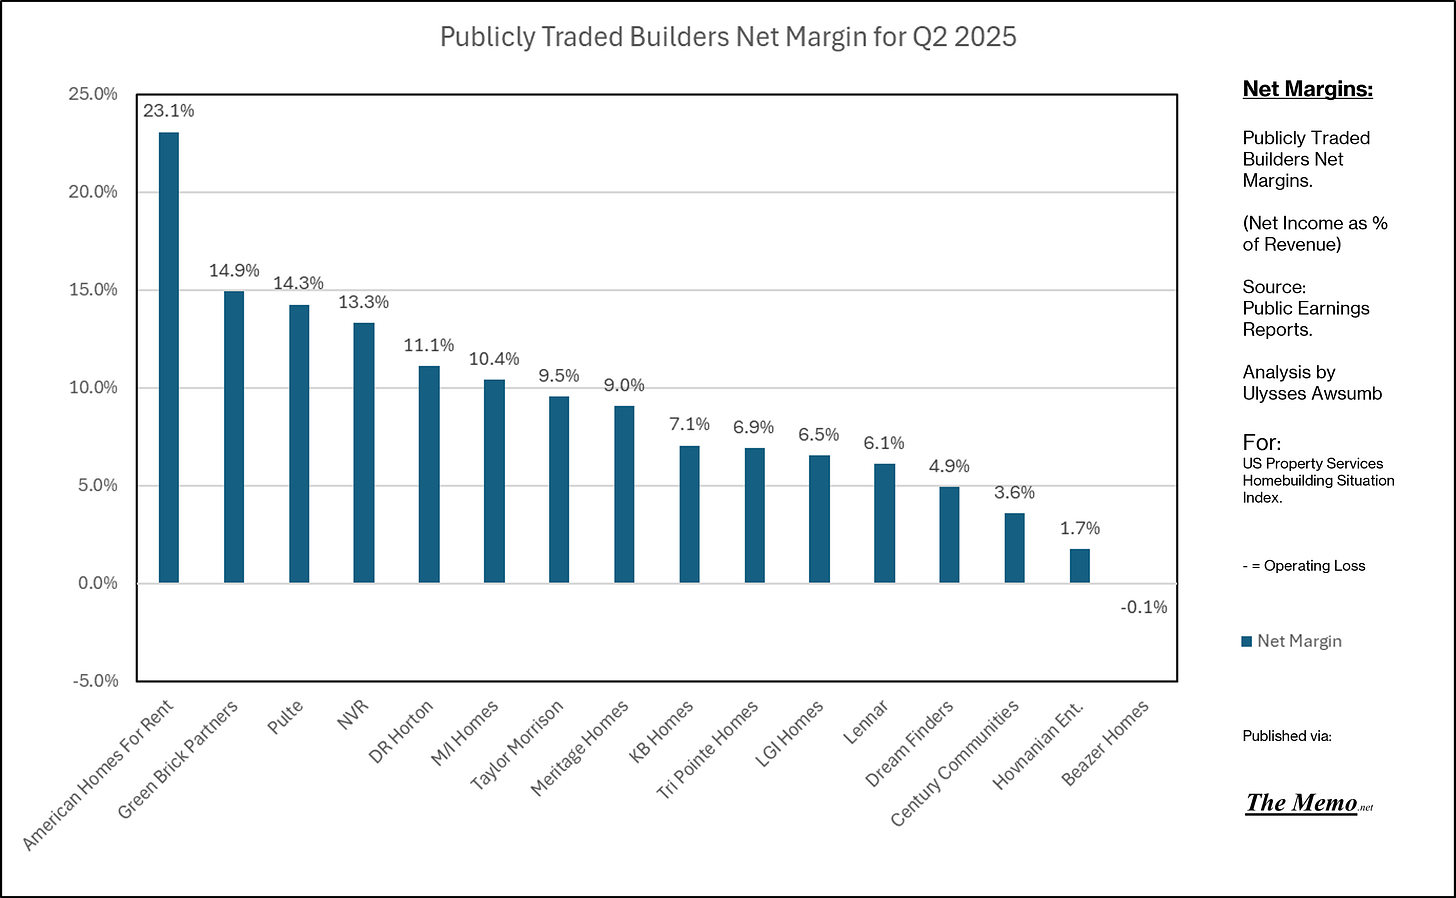
The average Net Margin for Builders analyzed came it at 8.9%, with Beazer Homes in negative territory and American Homes for Rent at 23% Net Margin. The only builder to exceed 15% net margin.
The combination of prices and rates present a challenging environment for builders, as two years of incentive to transact become heavy, compressing margins further. 10 of the 16 builders had single digit Net margins. 7 of which were below 7%.
While August likely provides a modest boost to closings for the seasonal strengths the month offers, the remainder of the year could see further sales stalling.
Builders will welcome the recent 19% decrease in lumber futures, bringing cost back to spring level, and should look for ways to further compress costs as an alternative method to induce sales and avoid operational losses in major markets.
Price Targets
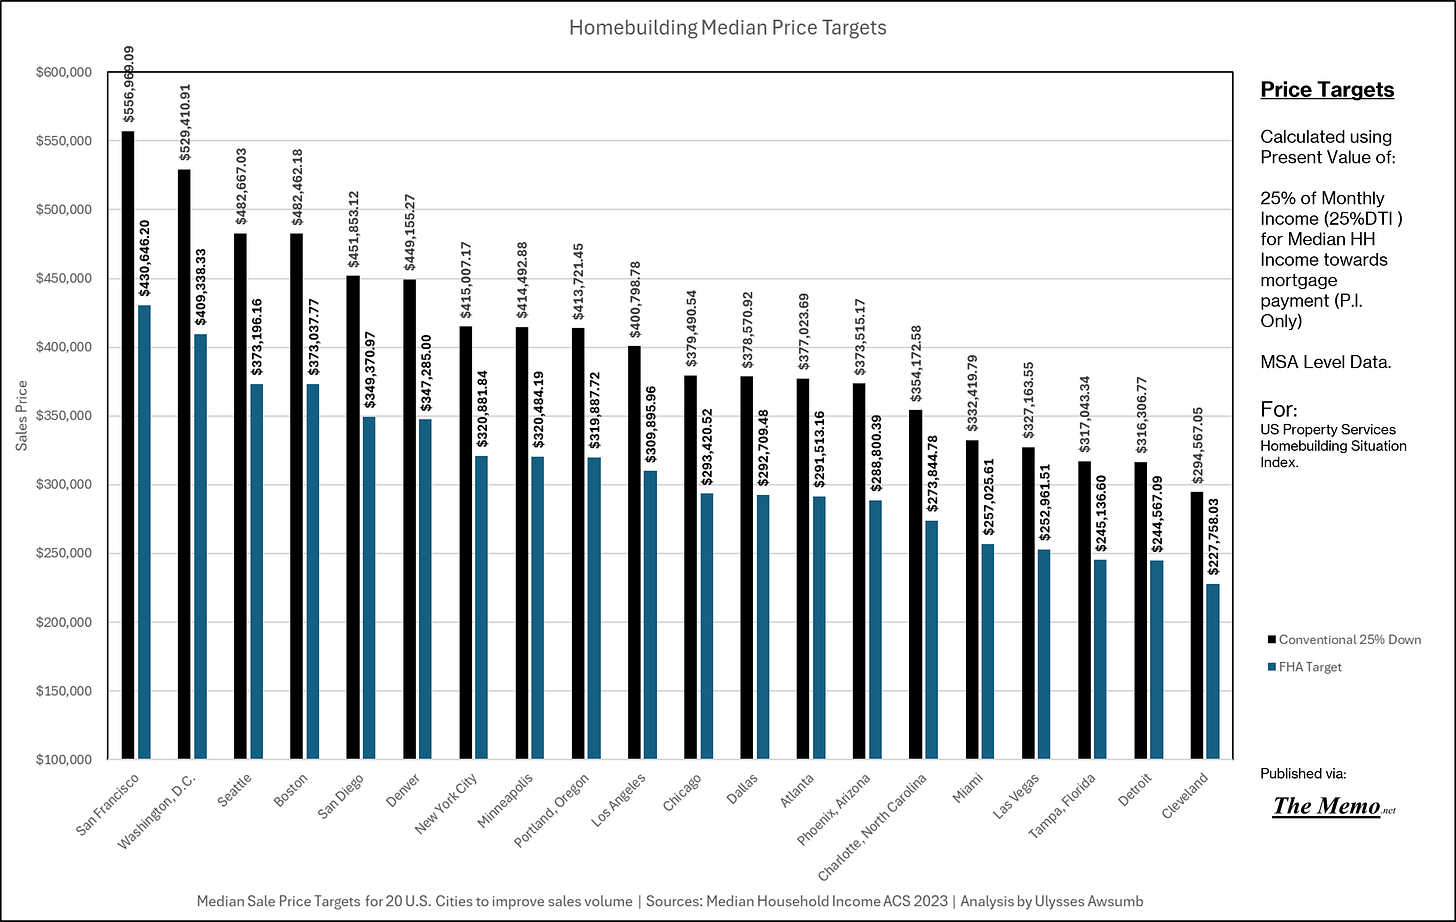
A study of the same 20 Metropolitan Statistical Areas (MSAs) and Cities used for the S&P Global Case Shiller 20 City Home Price Index reveals much of the battle builders have faced reducing prices and increasing selling and general administrative (SG&A) cost for 2 years, to balance sales beyond their current bounding on average.
The 20 MSAs comprise a total population of 112,594,464 people as of the 2023 US Census American Community Survey (ACS). This should not be confused with marketshare or households.
The Median Household Income for these 20 MSAs was $89,515 with ranges from $67-127,000. By using a 25% DTI (Debt to income) ratio, Median Price targets have been calculated for two sales methods. (25% of monthly income used to approve mortgage).
Those two methods consist of:
Conventionally financed buyers with down payments of 25% of purchase price
FHA financed buyers, with 3% of purchase price down payments
For Conventionally financed buyers in these areas, the overall Median Price target is $390,144, supposing buyers have a $97,536 down payment. (
For FHA, the overall Median Price Target is $301,658 with a down payment of $9,049.
To further highlight the conventional finance decline ($494,500 Median Price to $403,800) over two years, the average time to save the required down payment, if one were to save the exact mortgage payment long enough for the required down payment, is 52 months.
To further expand sales targets using FHA, Median Price Targets should expect to decline as much as another $103,000 unless and until both incomes increase, and or rates decrease. Dramatically.
A note: The Federal Reserve Federal Funds Effective Rate does not set mortgage rate targets.
The research and method for the index can be found here: US Property Services
Charts
Sources:
US Census Bureau: Survey of Construction; New Residential Sales
Freddie Mac Primary Mortgage Market Survey
Public Builder Earnings, 10-Q/Press Releases/Quarterly Presentations
US Census Bureau American Community Survey
US Property Services (All Rights Reserved)
Analysis by Ulysses Awsumb


