Date: September 25th 2025
Time: 7:00am

Today marks the 1 year anniversary of the very first published US Homebuilding Situation Index. In that time, the index has lead the way, as a leading index should, from seeing the situation deteriorating in Q4 2024 to seeing the rise of the August 2025 sales all ahead of when “analysts” and “Consensus” could imagine. But then again, when you’re scanning the horizon as you drive, you see and react differently than when you’re staring at the pavement in front of the hood. Just drive down your local highway en route to work, and you’ll notice the traffic jams form at bends and hills for no particular reason, other than not seeing whats more than 2 feet in front of the car.
Or, go ahead and layout a new house from foundation to finish, while keeping it flush, plumb and level, with a string, tape measure, pencil/notepad and your own wallet. Spacial awareness required.
This report contains analysis of Lennar’s most recent Earnings, and compares Lennar’s Fiscal Quarter Earnings to the US Census Bureau Survey of Construction data.
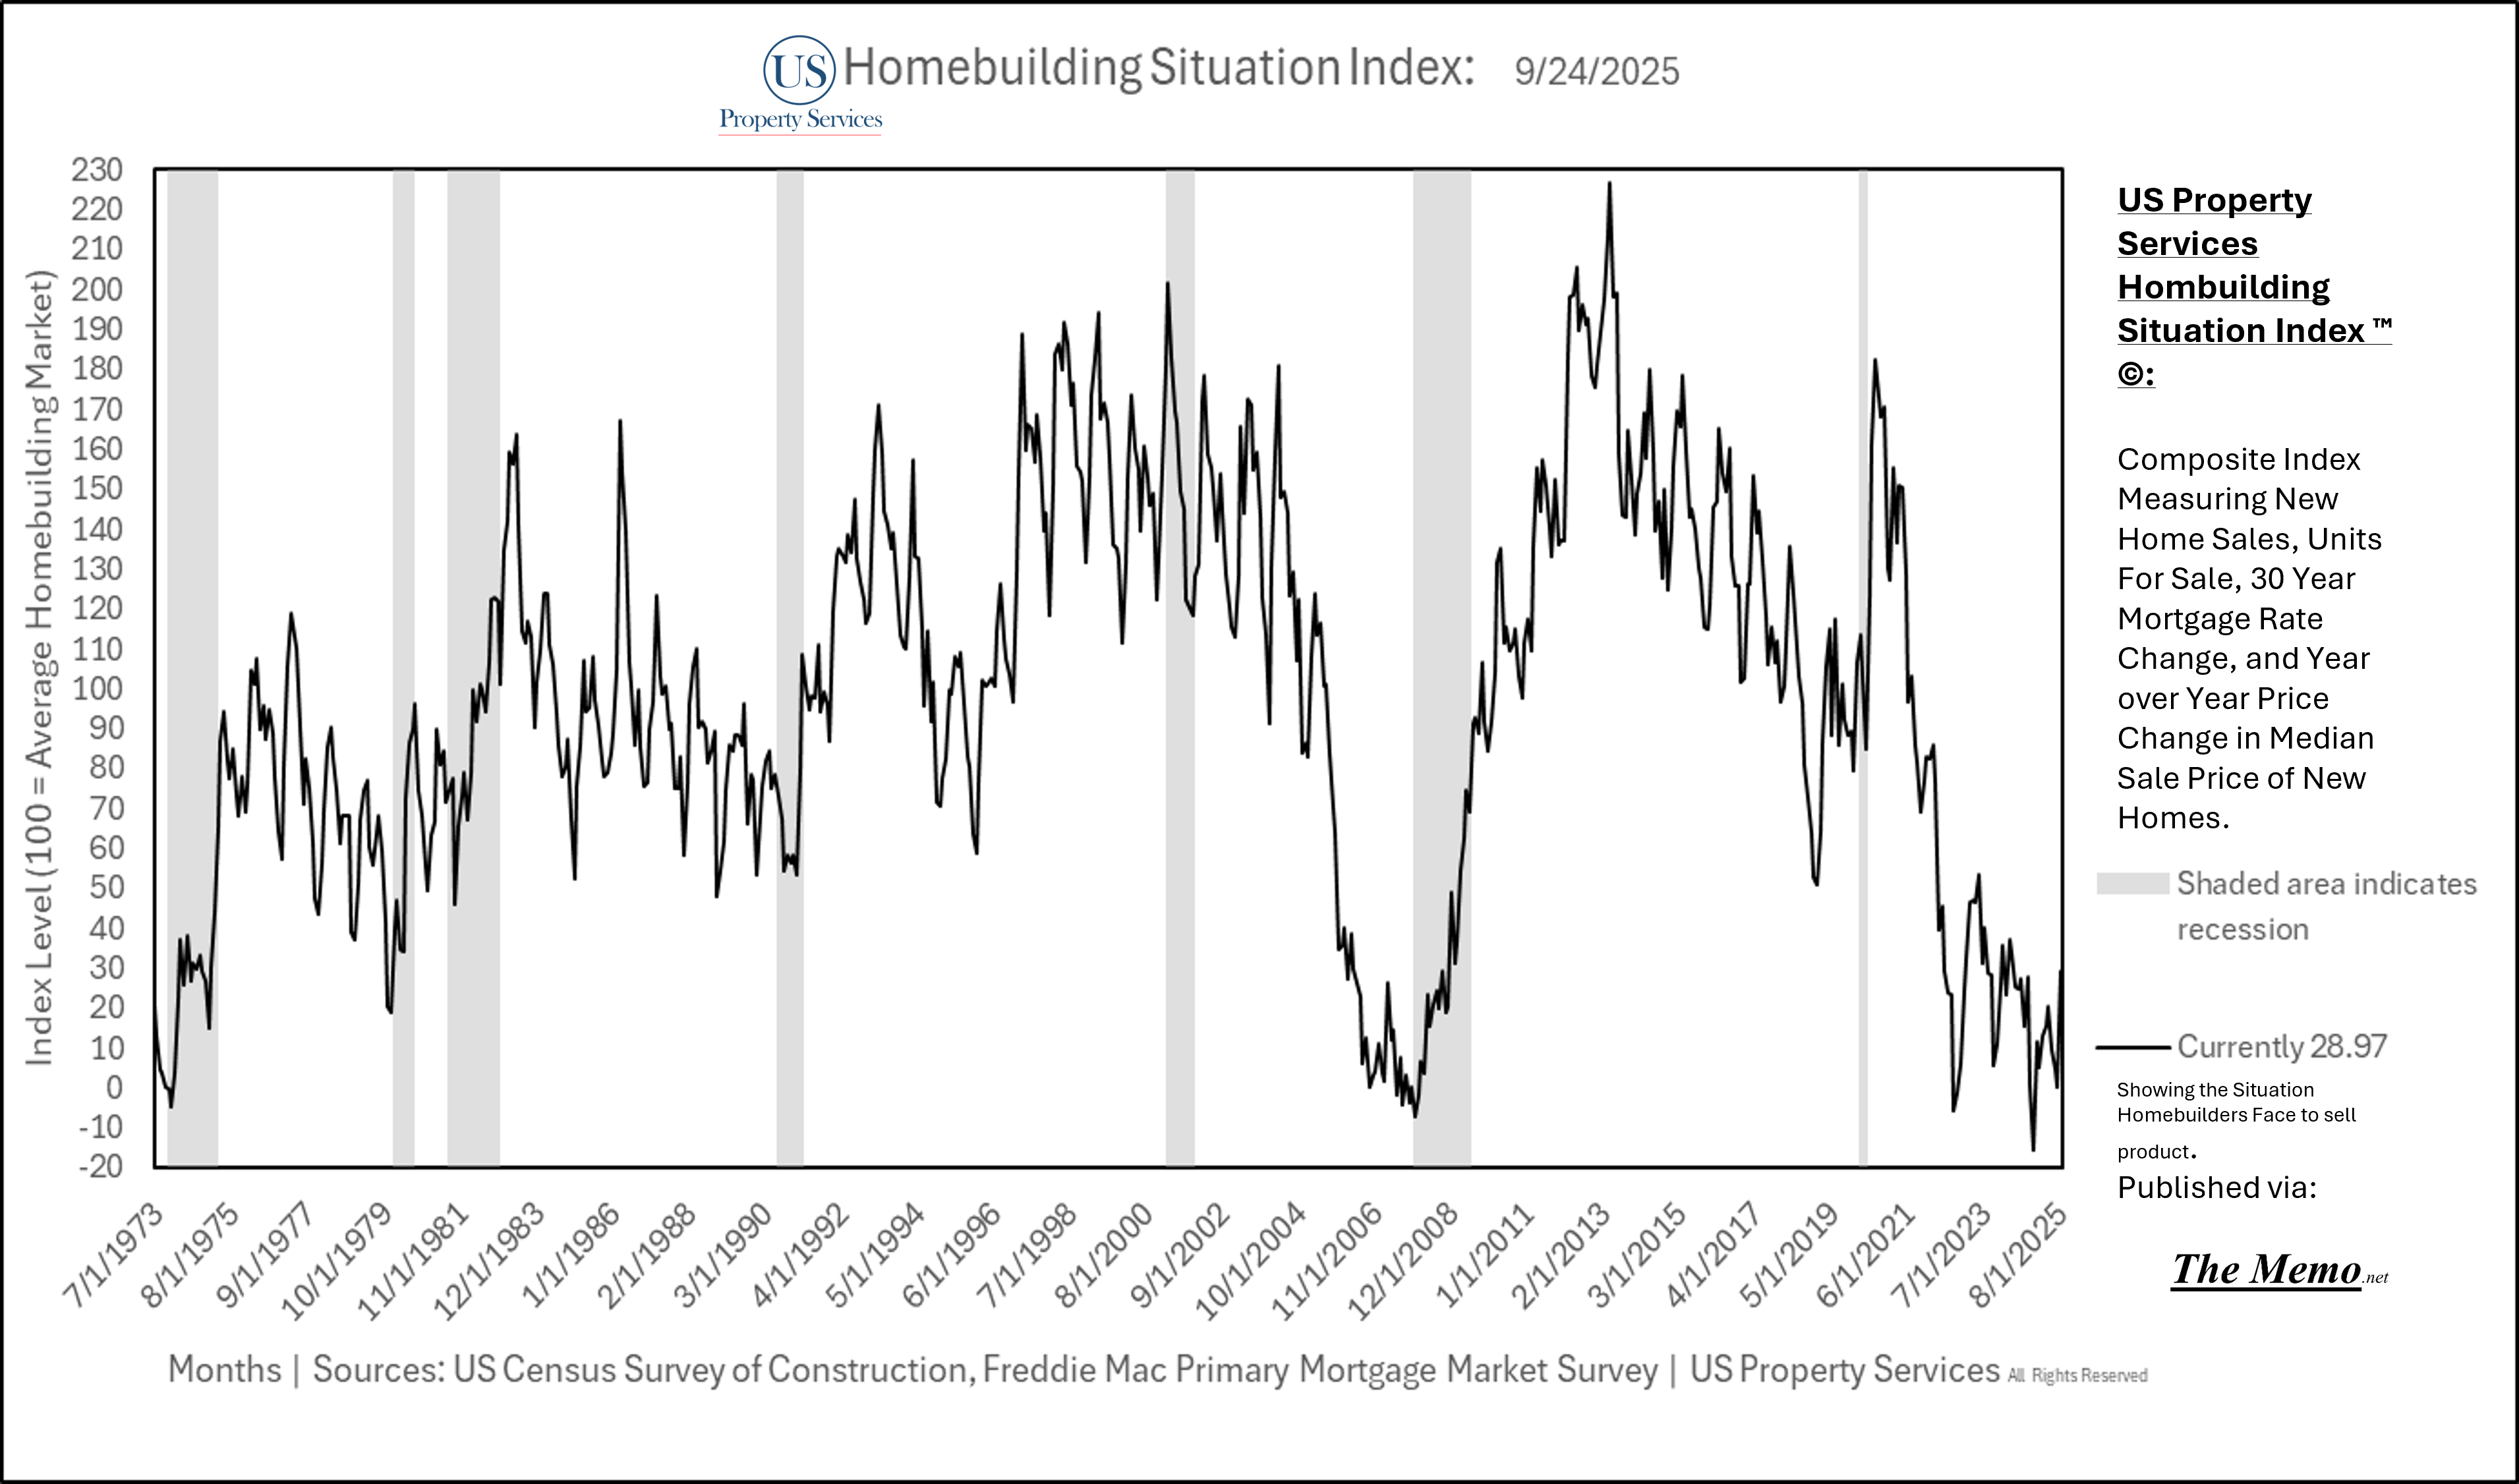
The Homebuilding Situation (Composite index measuring sales, inventory, price and mortgage rate direction change) from August 2025 stands at 28.97 This is 71.03 points below the Average Situation for Homebuilders. The is the best situation since April 2024.
Sales
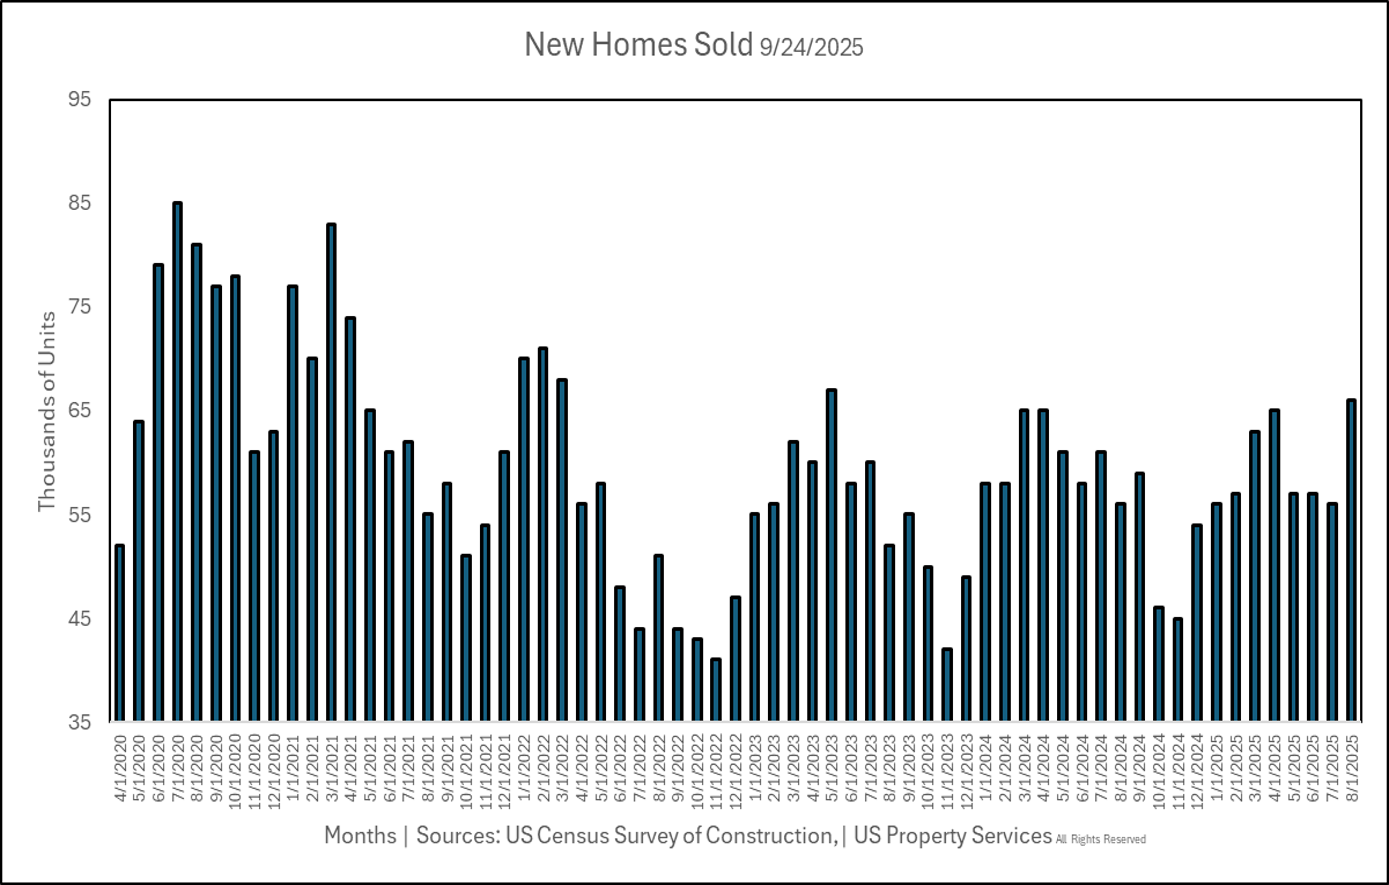
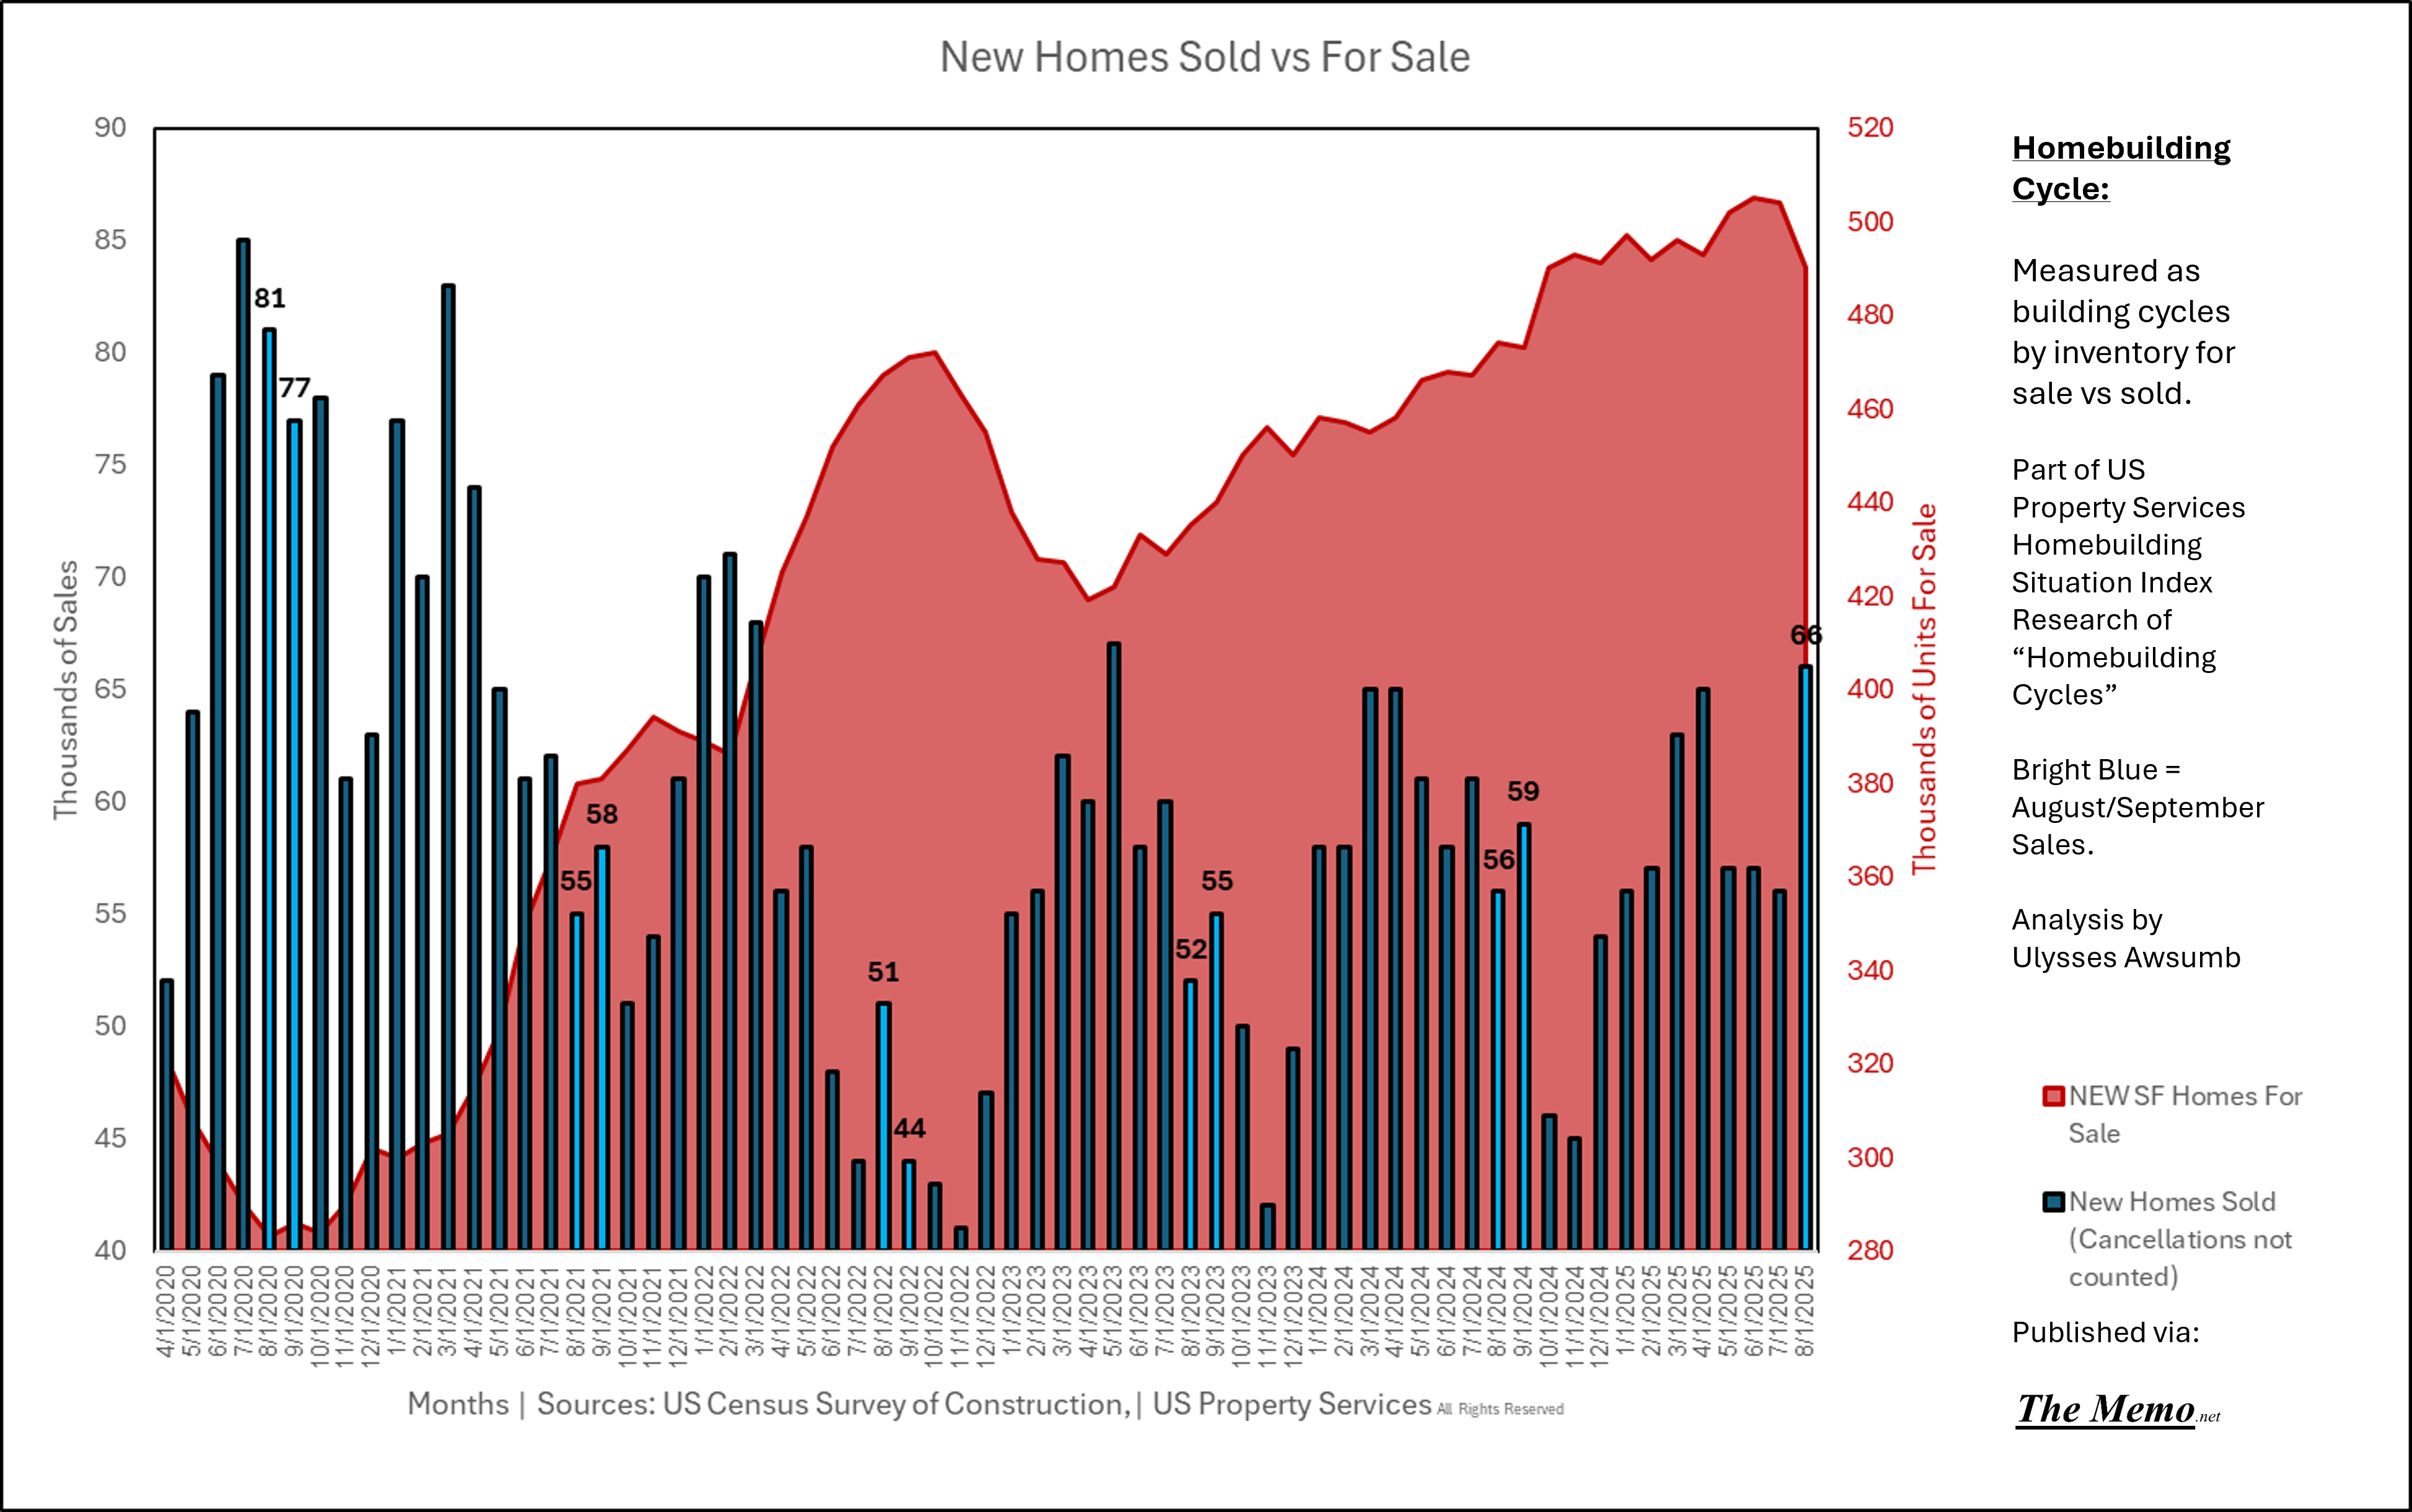
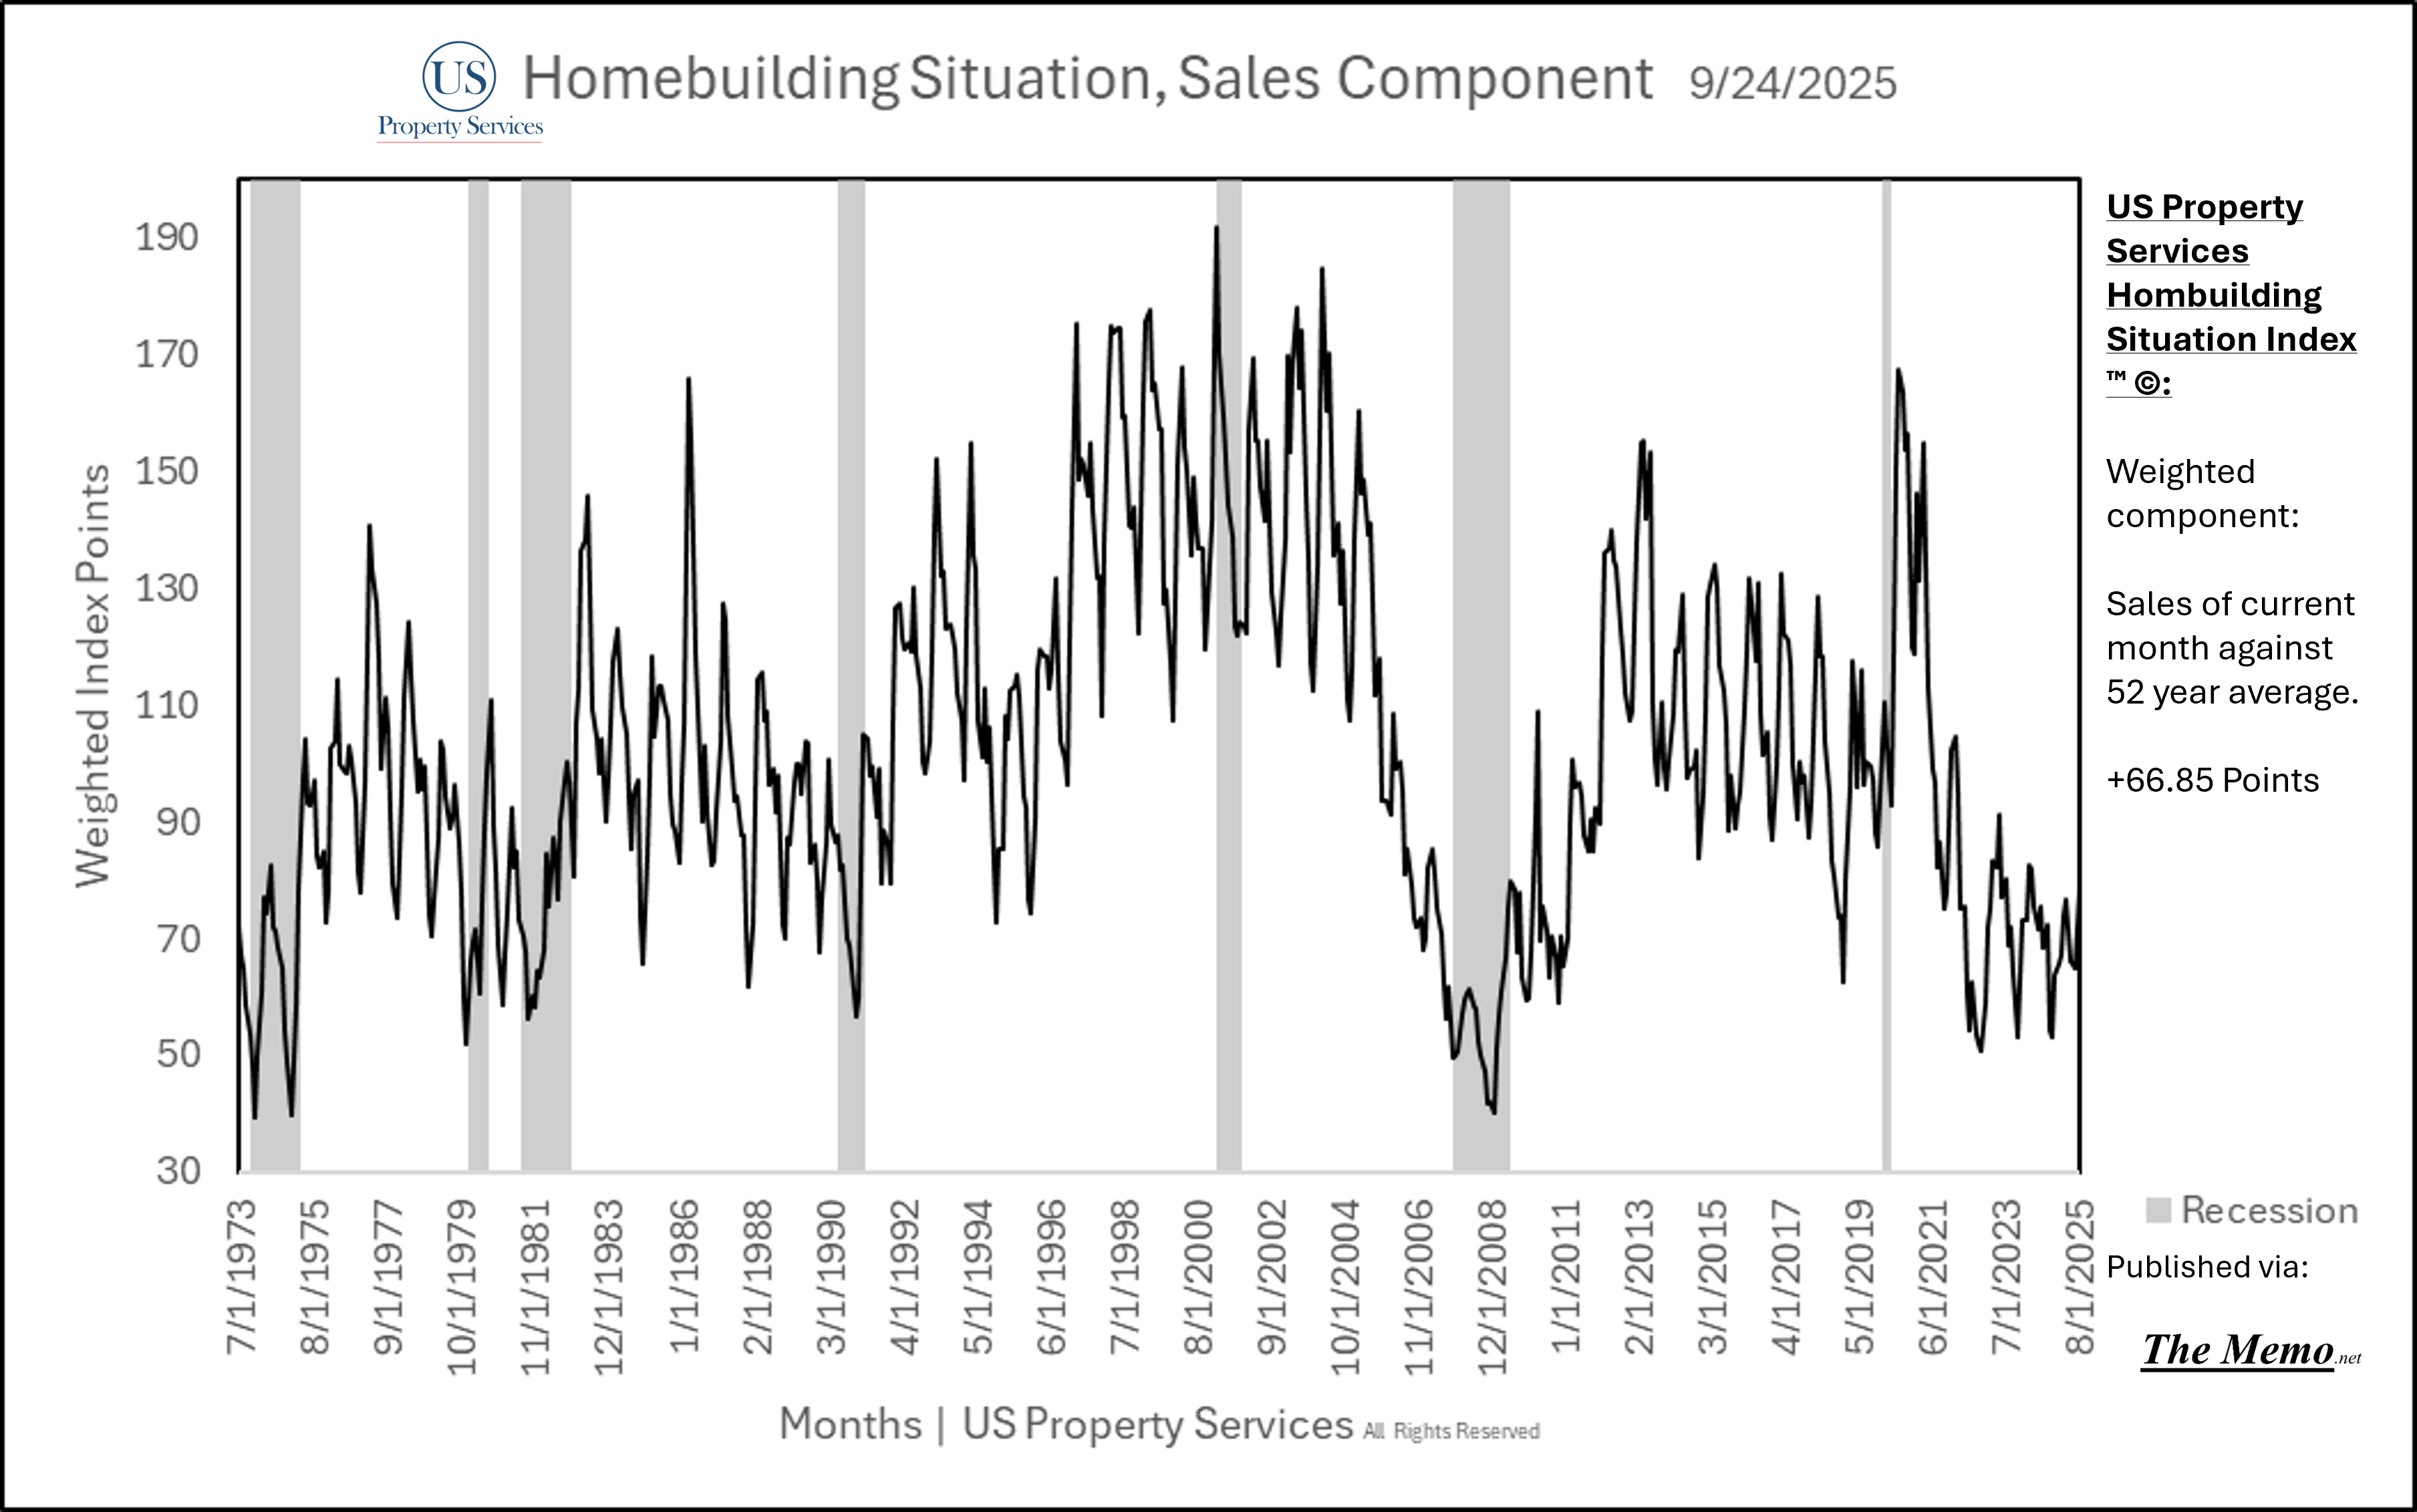
August sales jumped to 66,000 units sold from 56,000 in July. 11,000 more than the average monthly sales rate across the last 52 years. Sales made up 66.85points for the index, up from 64.
I believe this warrants a special note: from what I see, from analysts in the space to everyday friends, this number doesn’t seem to garner the attention it deserves. 50-60,000 sales in one month, is roughly equivalent to the size of an entire 5th ring suburb (pick your MSA) in new homes sold every month. The number of new homes sold in one year, the lowest year of the current cycle (2022) saw 641,000 new homes sold. That’s 4,000 fewer homes than the entire population of Detroit Michigan. 2020’s 822,000 new homes sold, is the equivalent of the population of San Francisco California. No seasonal adjustment necessary.
Inventory
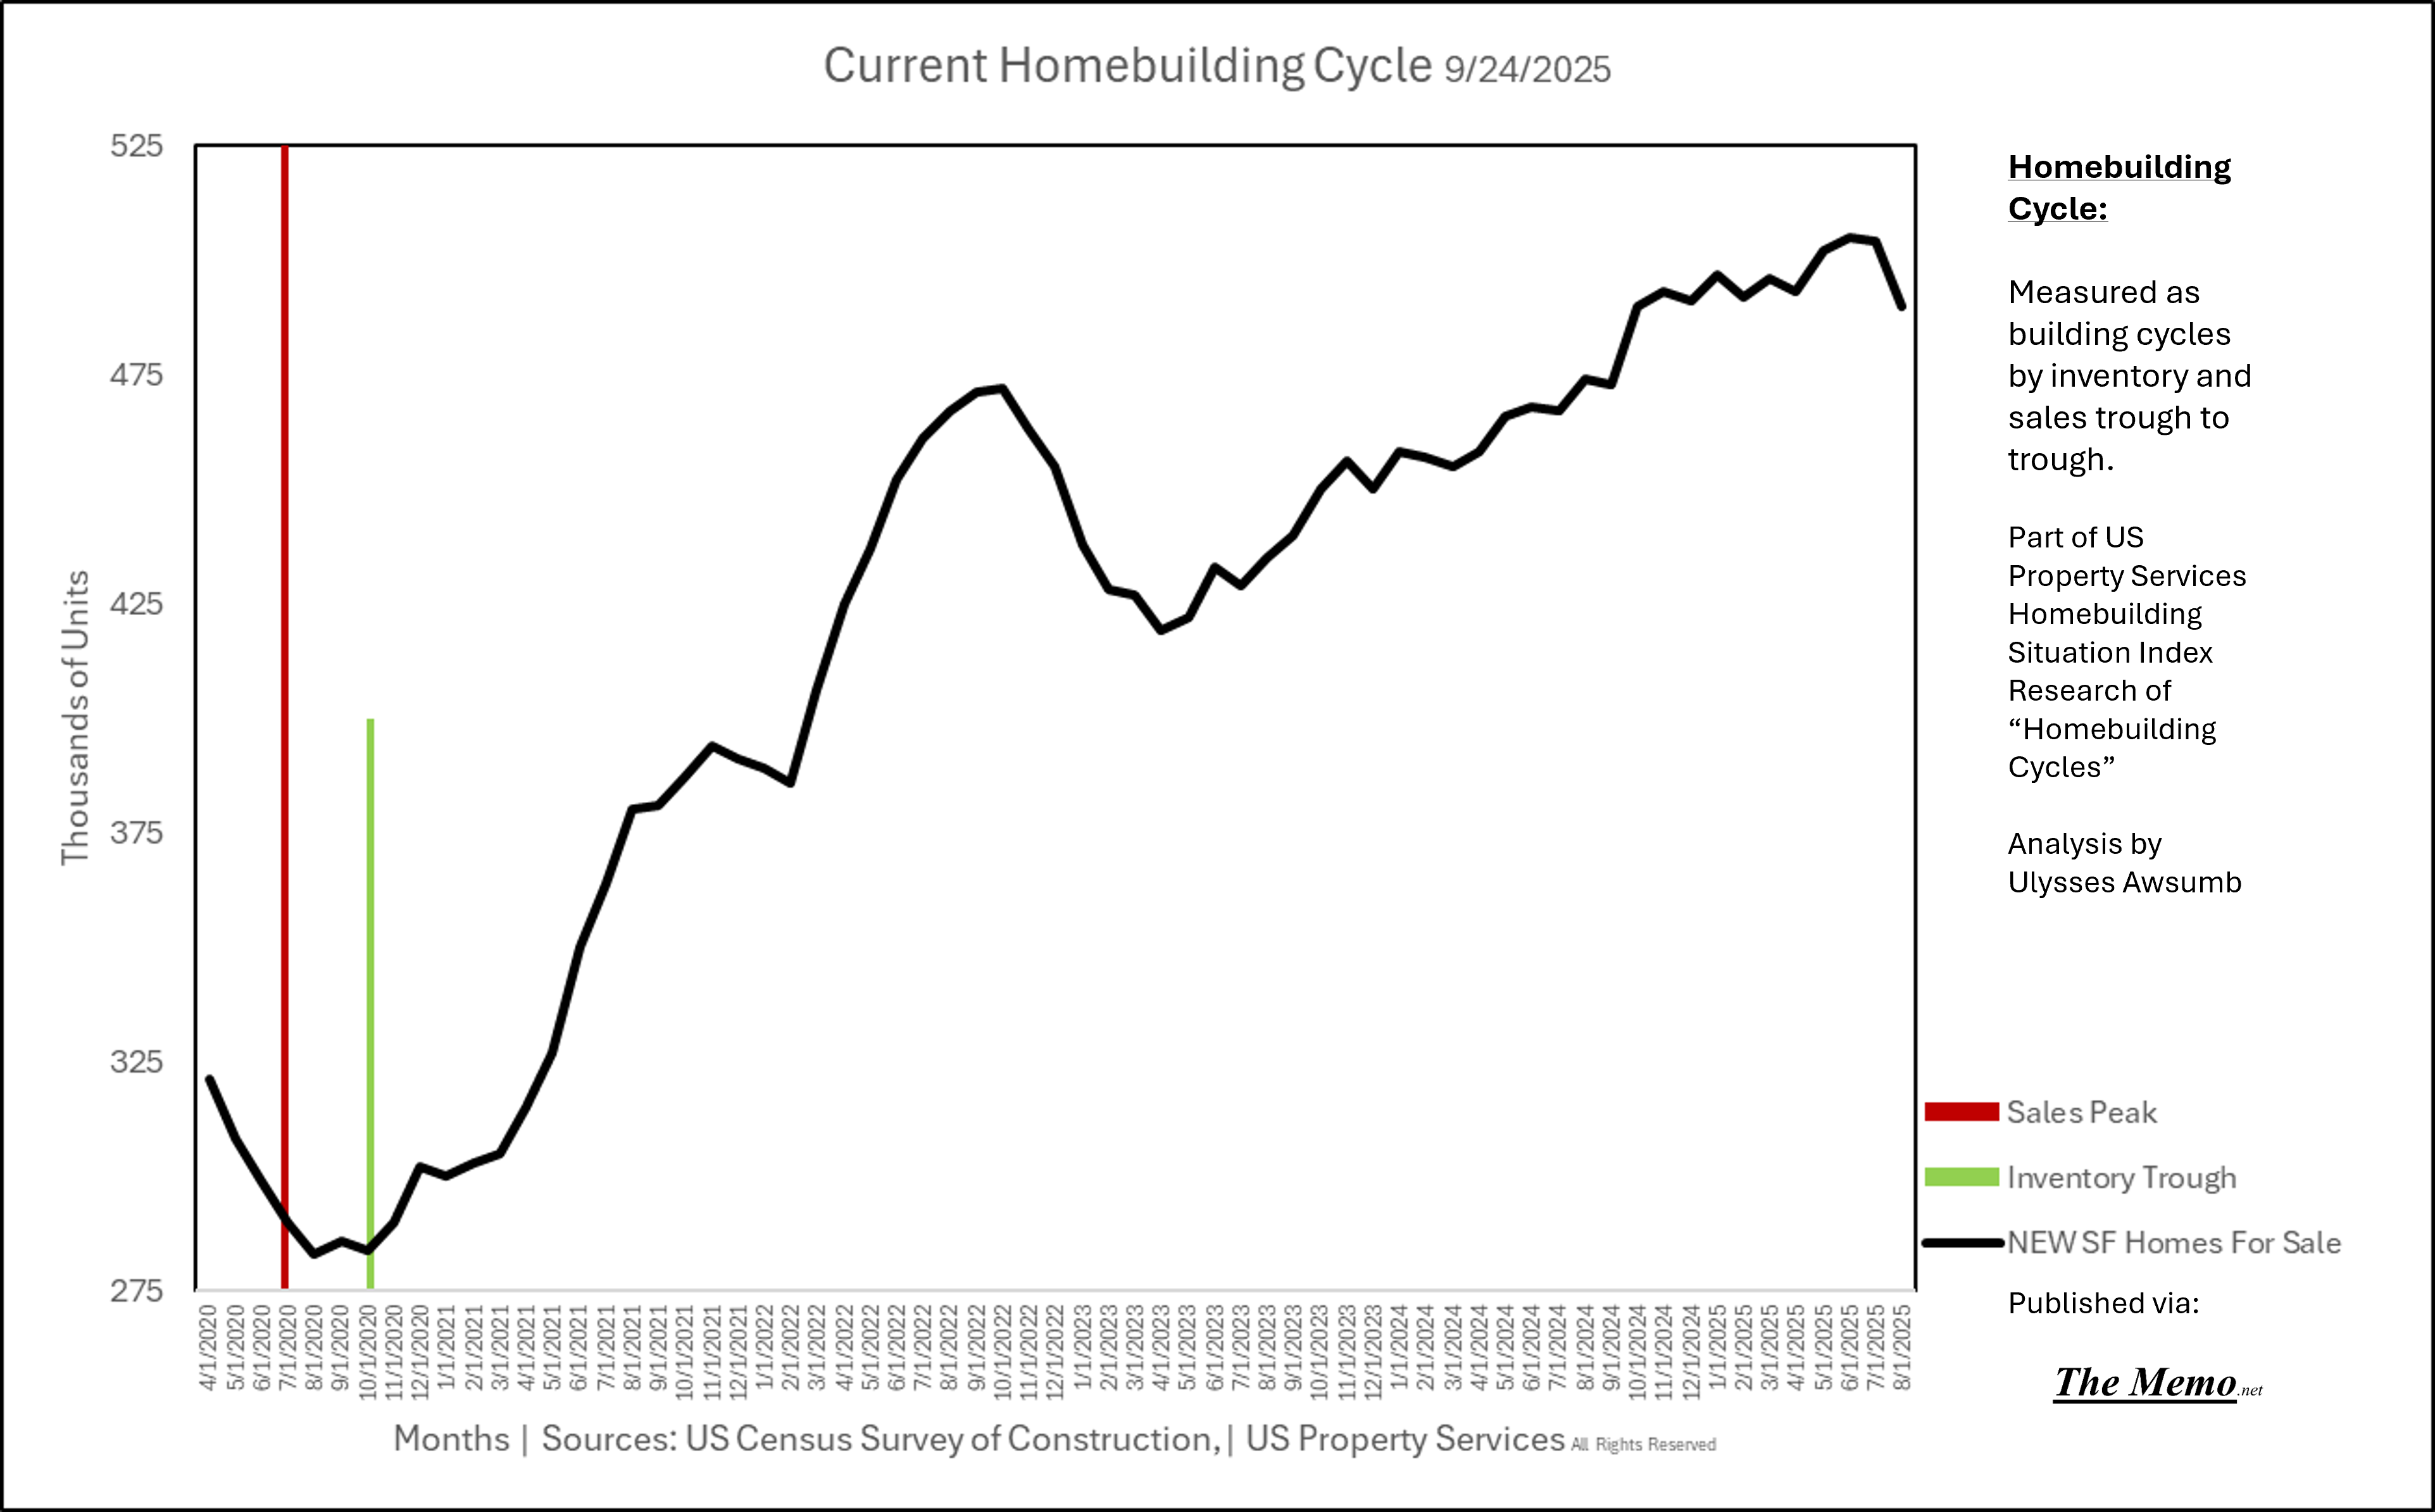
There are 490,000 new single family homes for sale . Down 14,000 over the past month (revised). The past 12 months have been revised to remain between 490,000-505,000. Last months 508,000 was revised down to 504,000. This is currently the most inventory in recorded history outside of the two years from November 2005-October 2007. Current inventory contributed -53.5 points to the index. The average number of new home for sale every month, since 1971, is 319,000. In other words, current inventory is 53% above average. After downward revisions.
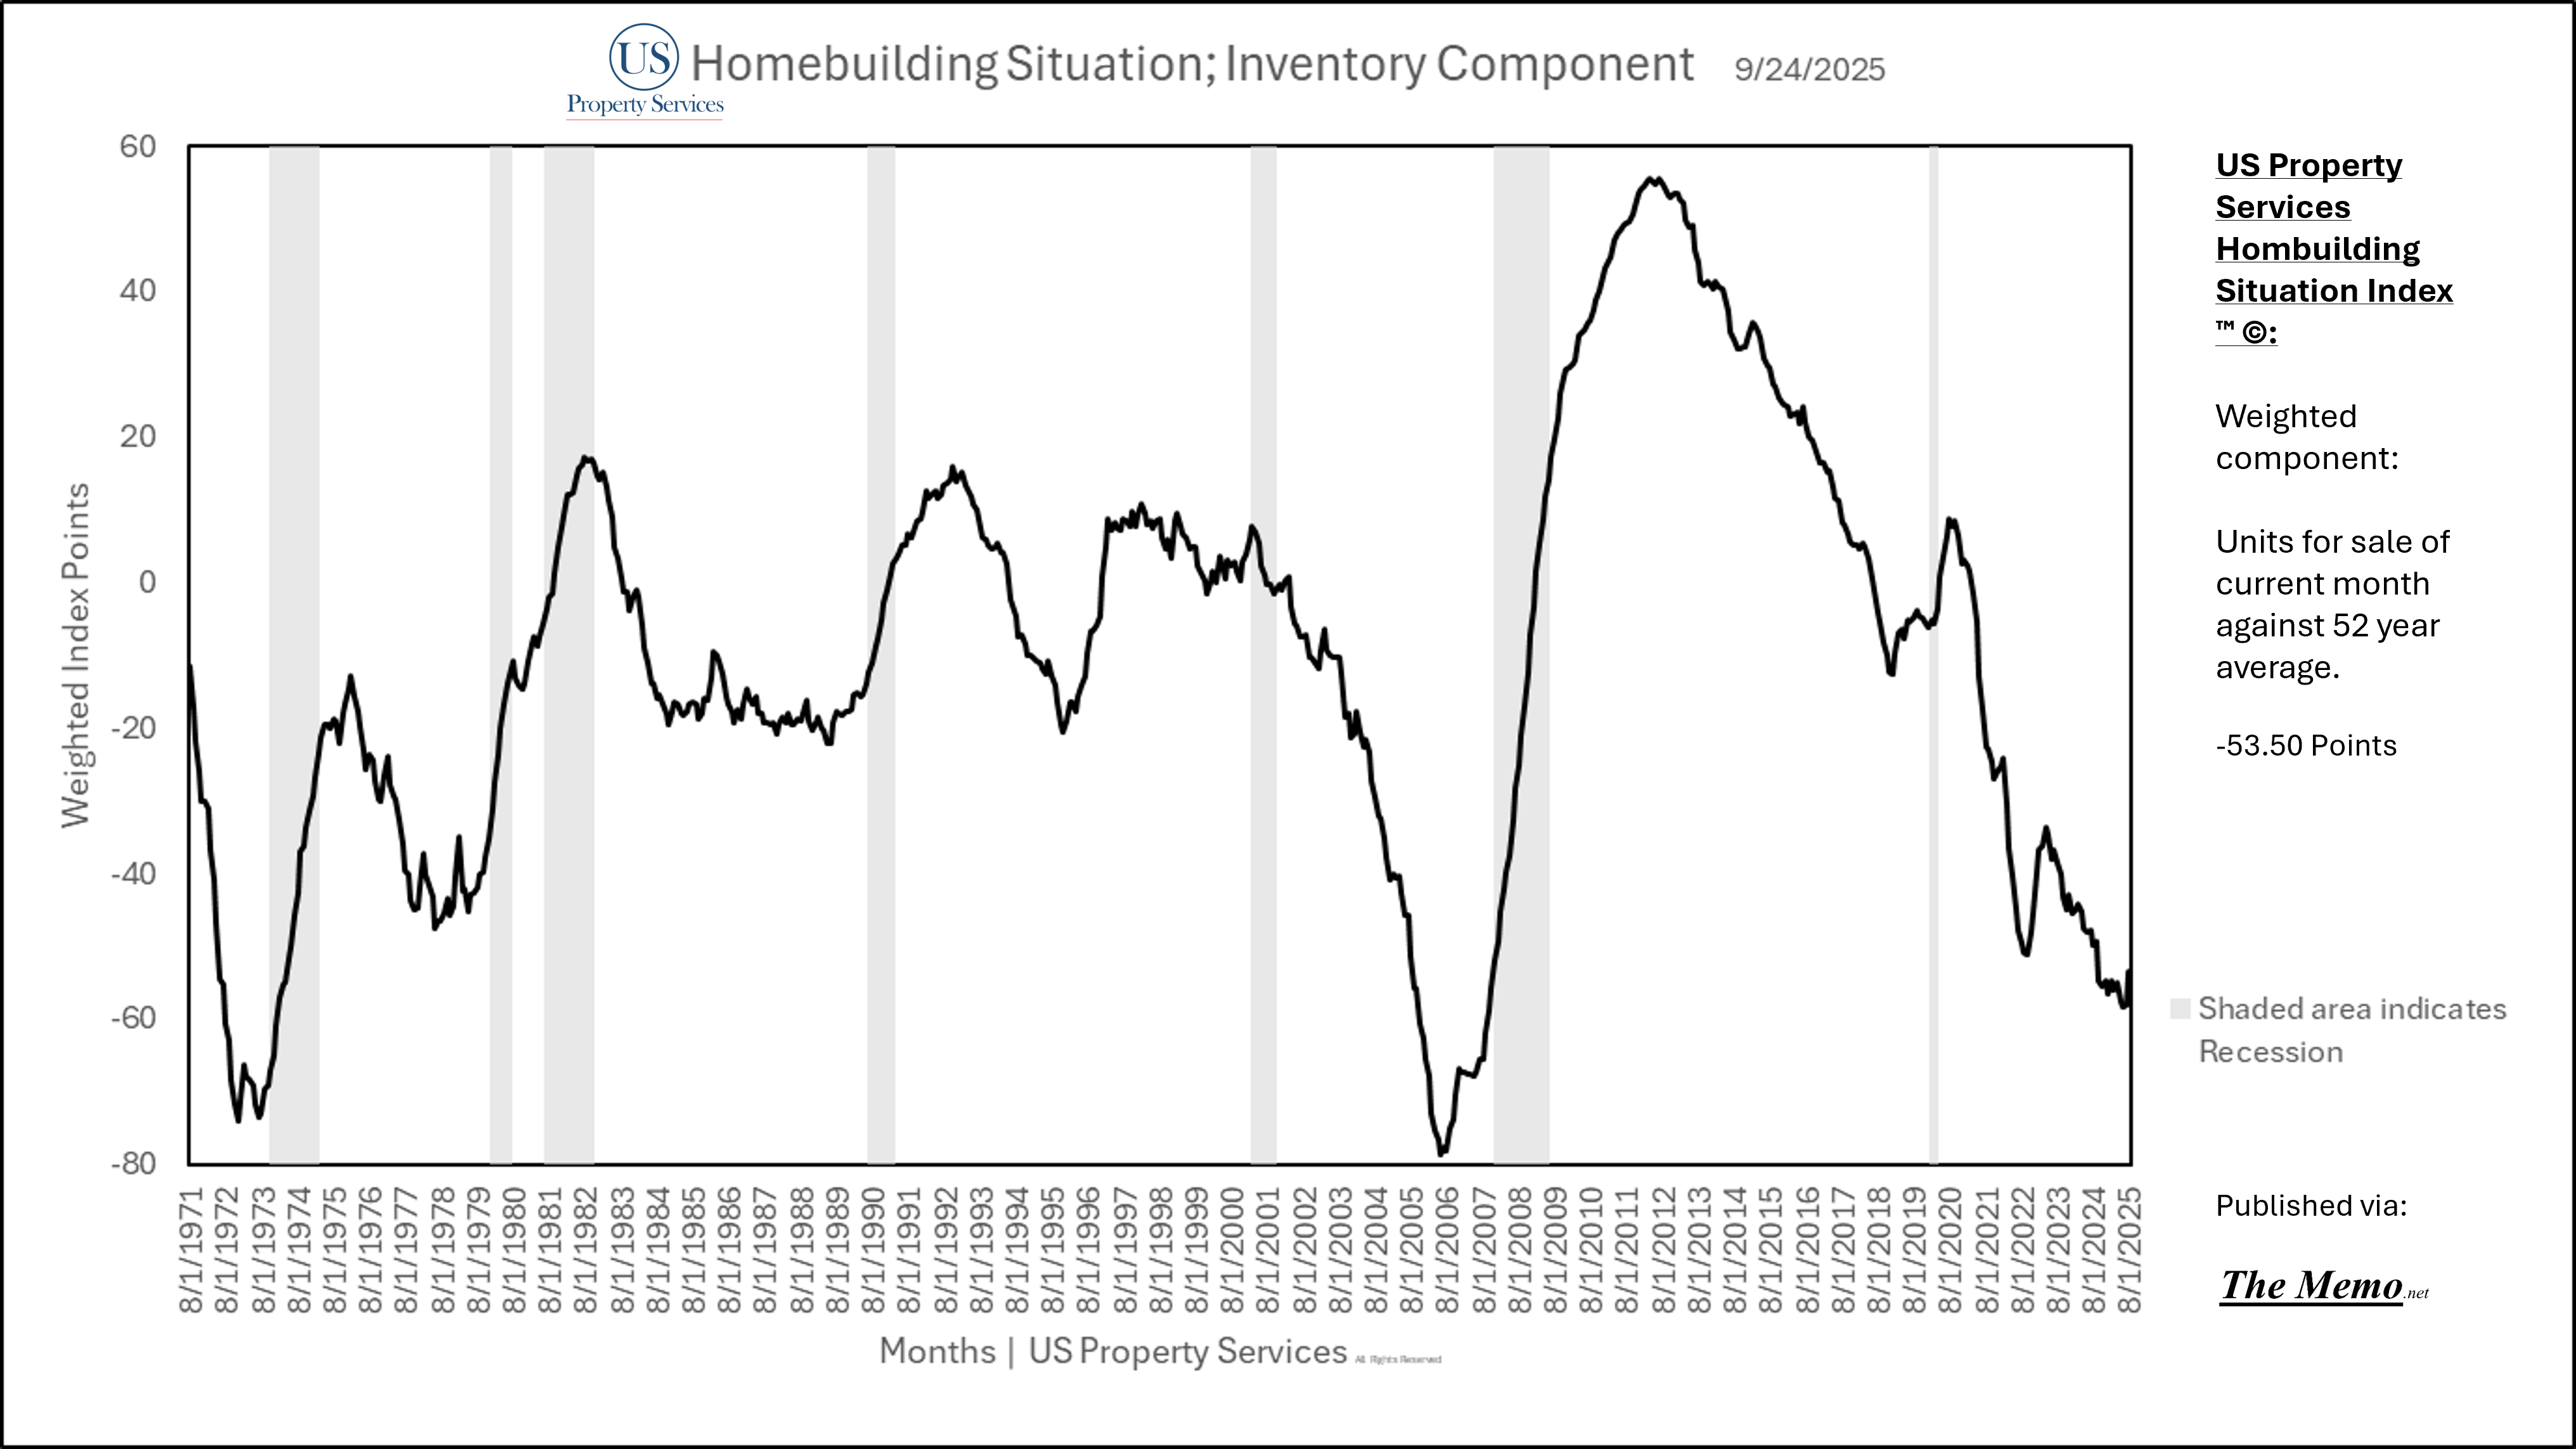
Sales do not include cancellations, which have been elevated this year. Current “speculative” inventory, consisting of completed homes for sale and lots with specific permitted homes for sale have reached 228,000 units , down 2,000 units month over month. This is within 15% of the all time high spec inventory.
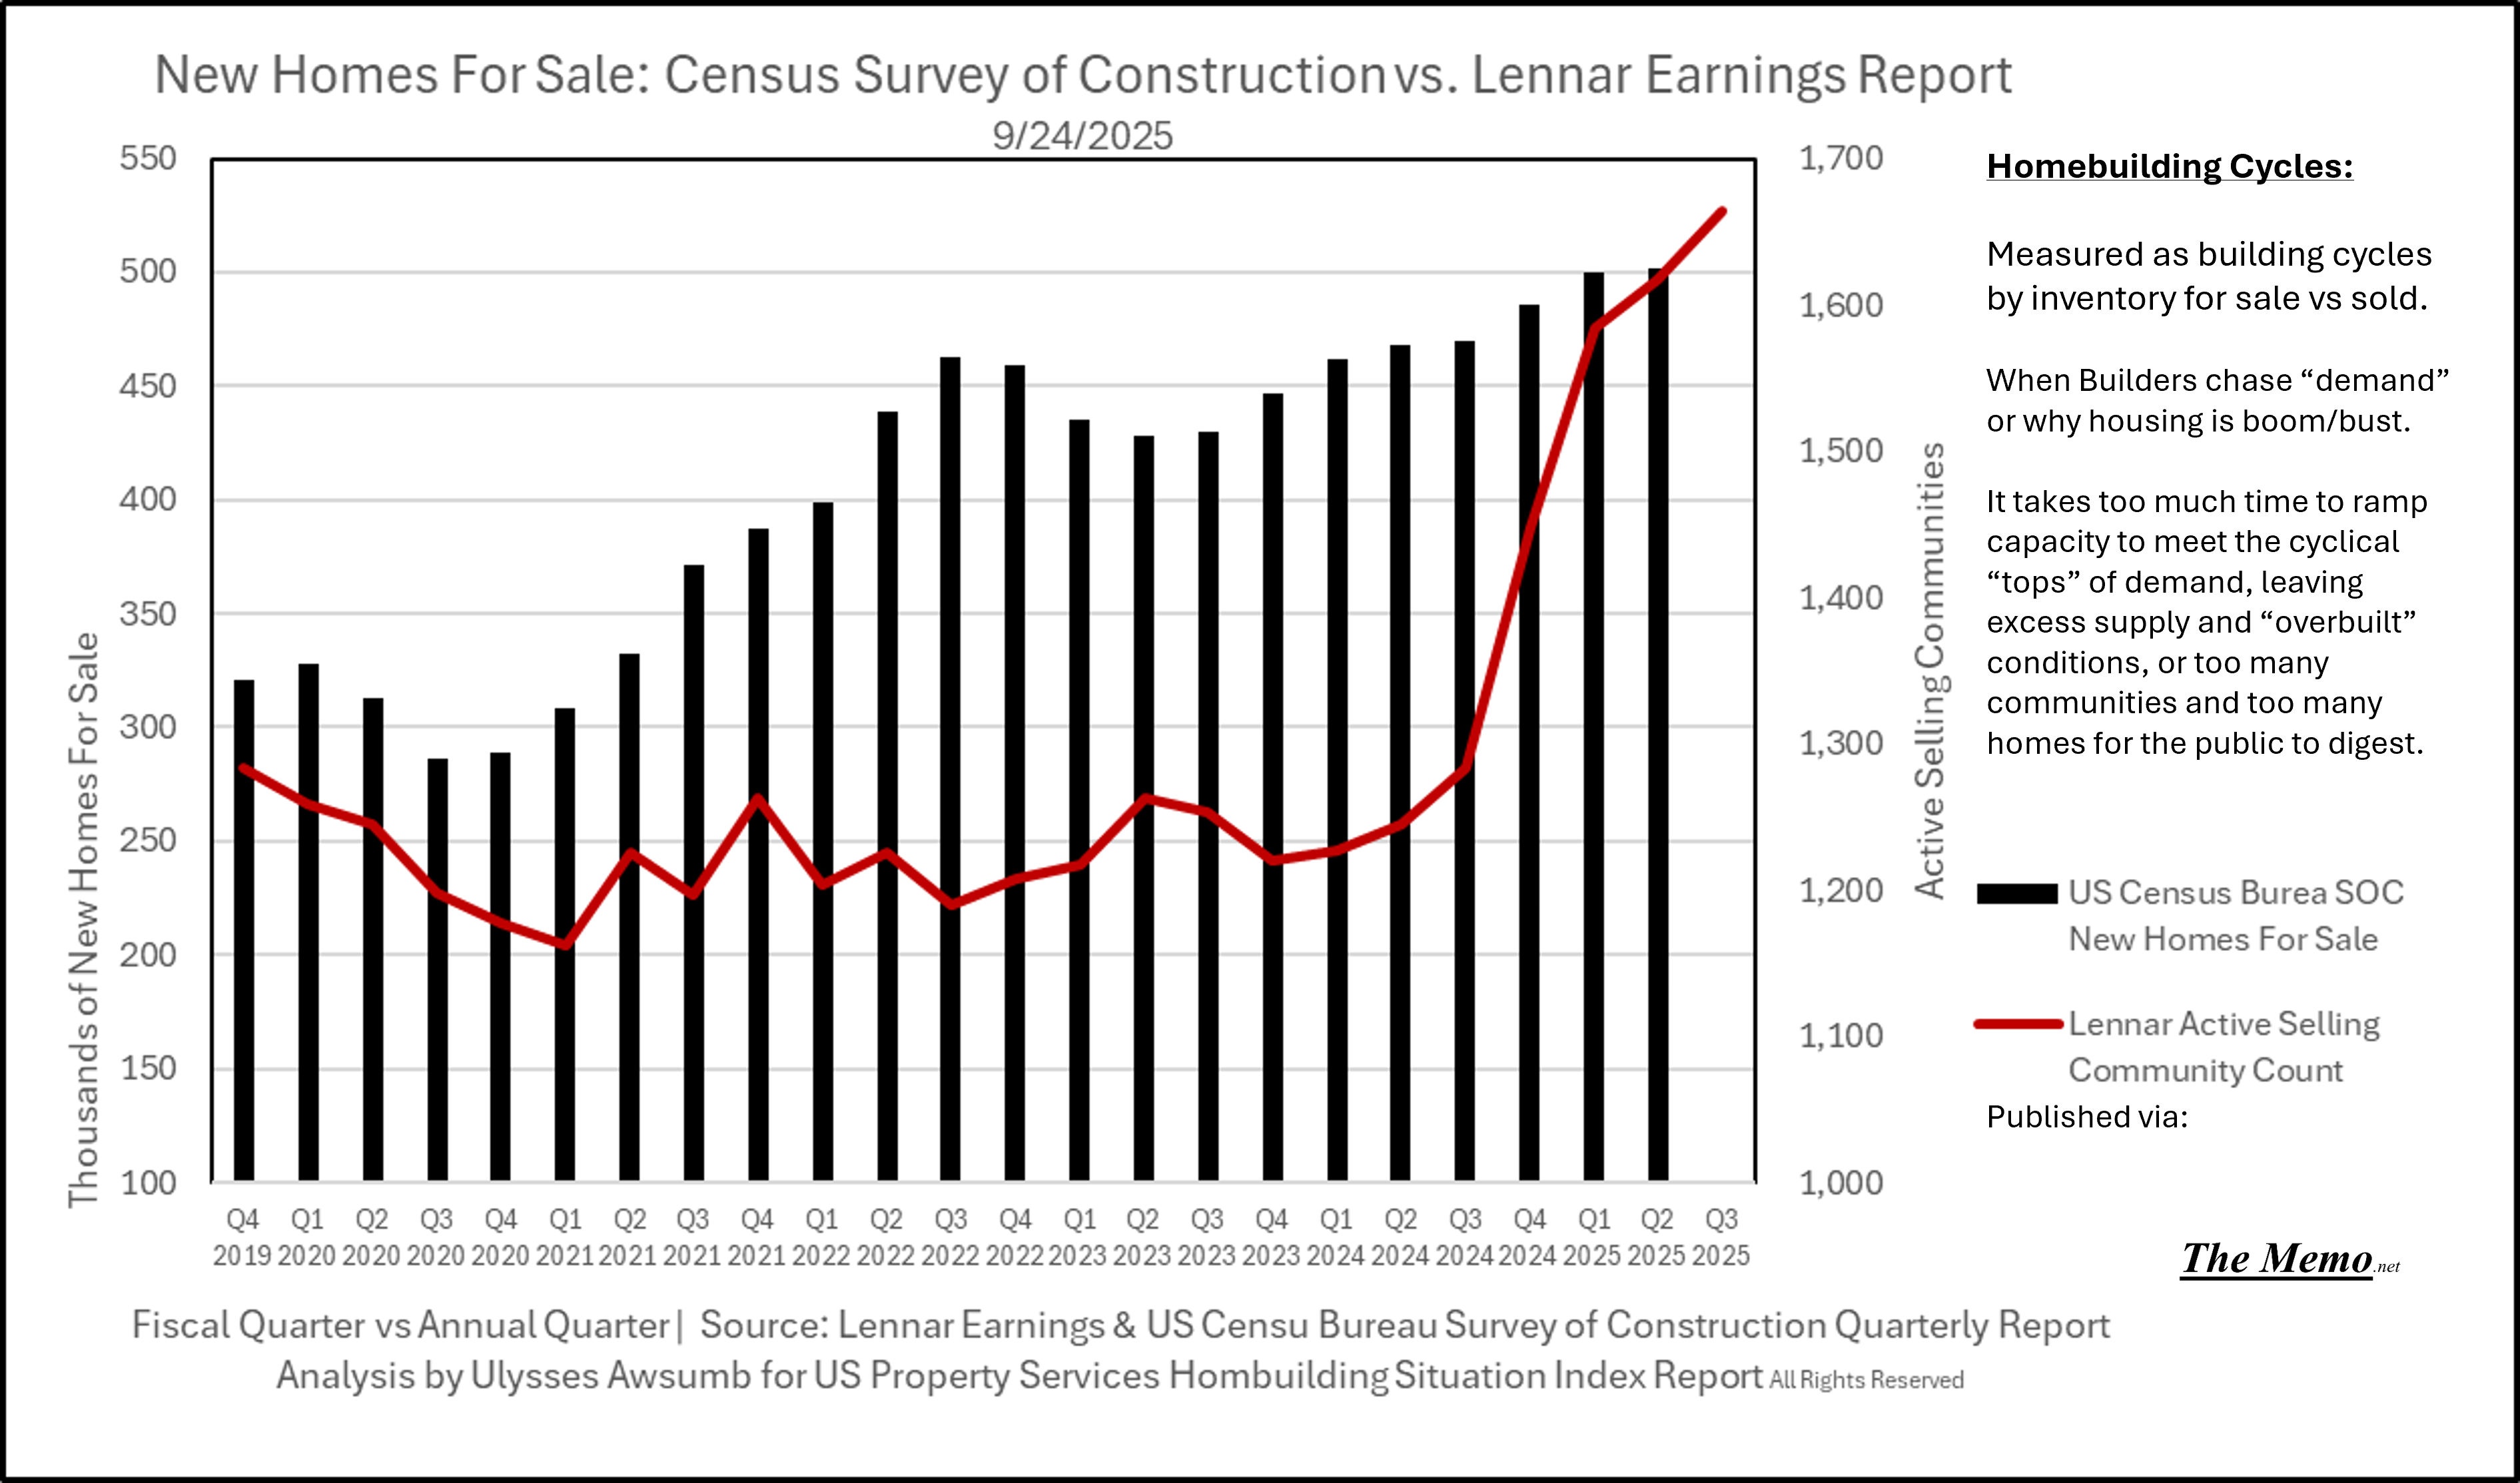
Publicly traded builders b(u)y and large increased community count this year, increasing permitted spec homes for sale. Lennar was a leader in community count growth at 29% Year over year increase in active communities as of last week’s Q3 earnings report.
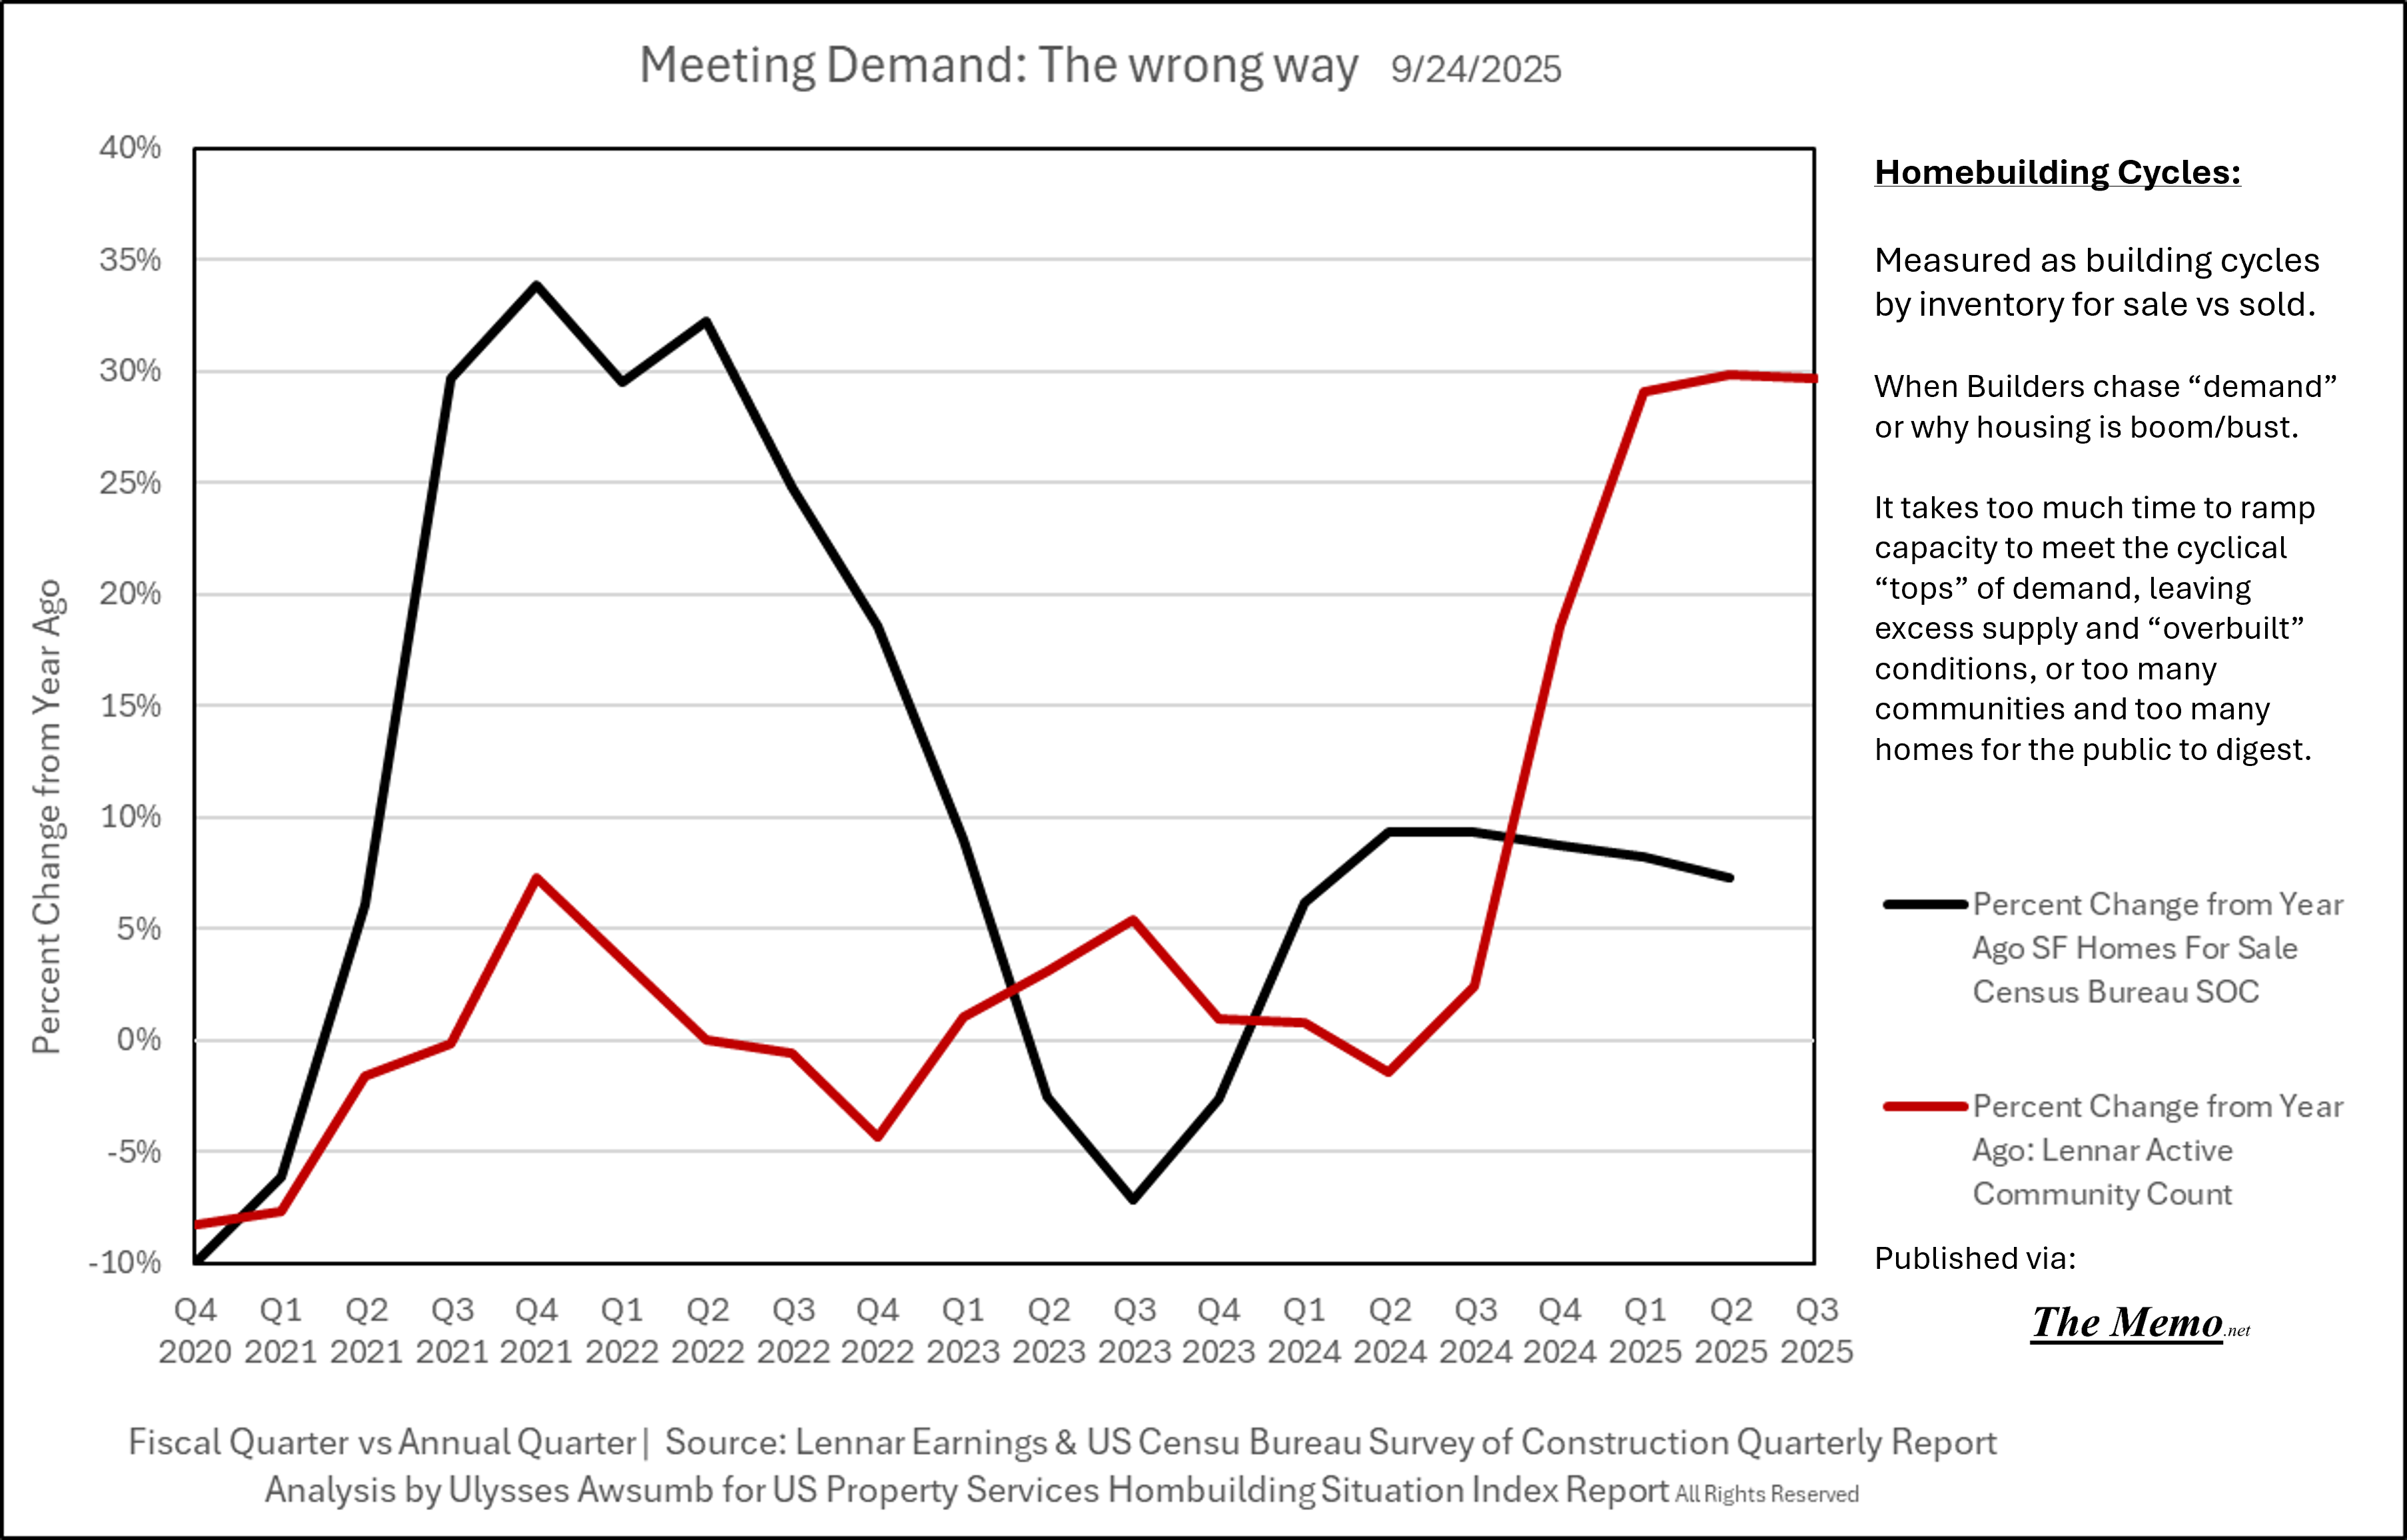
On a community count level, Lennar has: 381 more communities at the end of their Q3 2025 Fiscal year than they had at Q3 End of Fiscal Year 2024.

The number of homes for sale may, and should, statistically speaking, increase again.
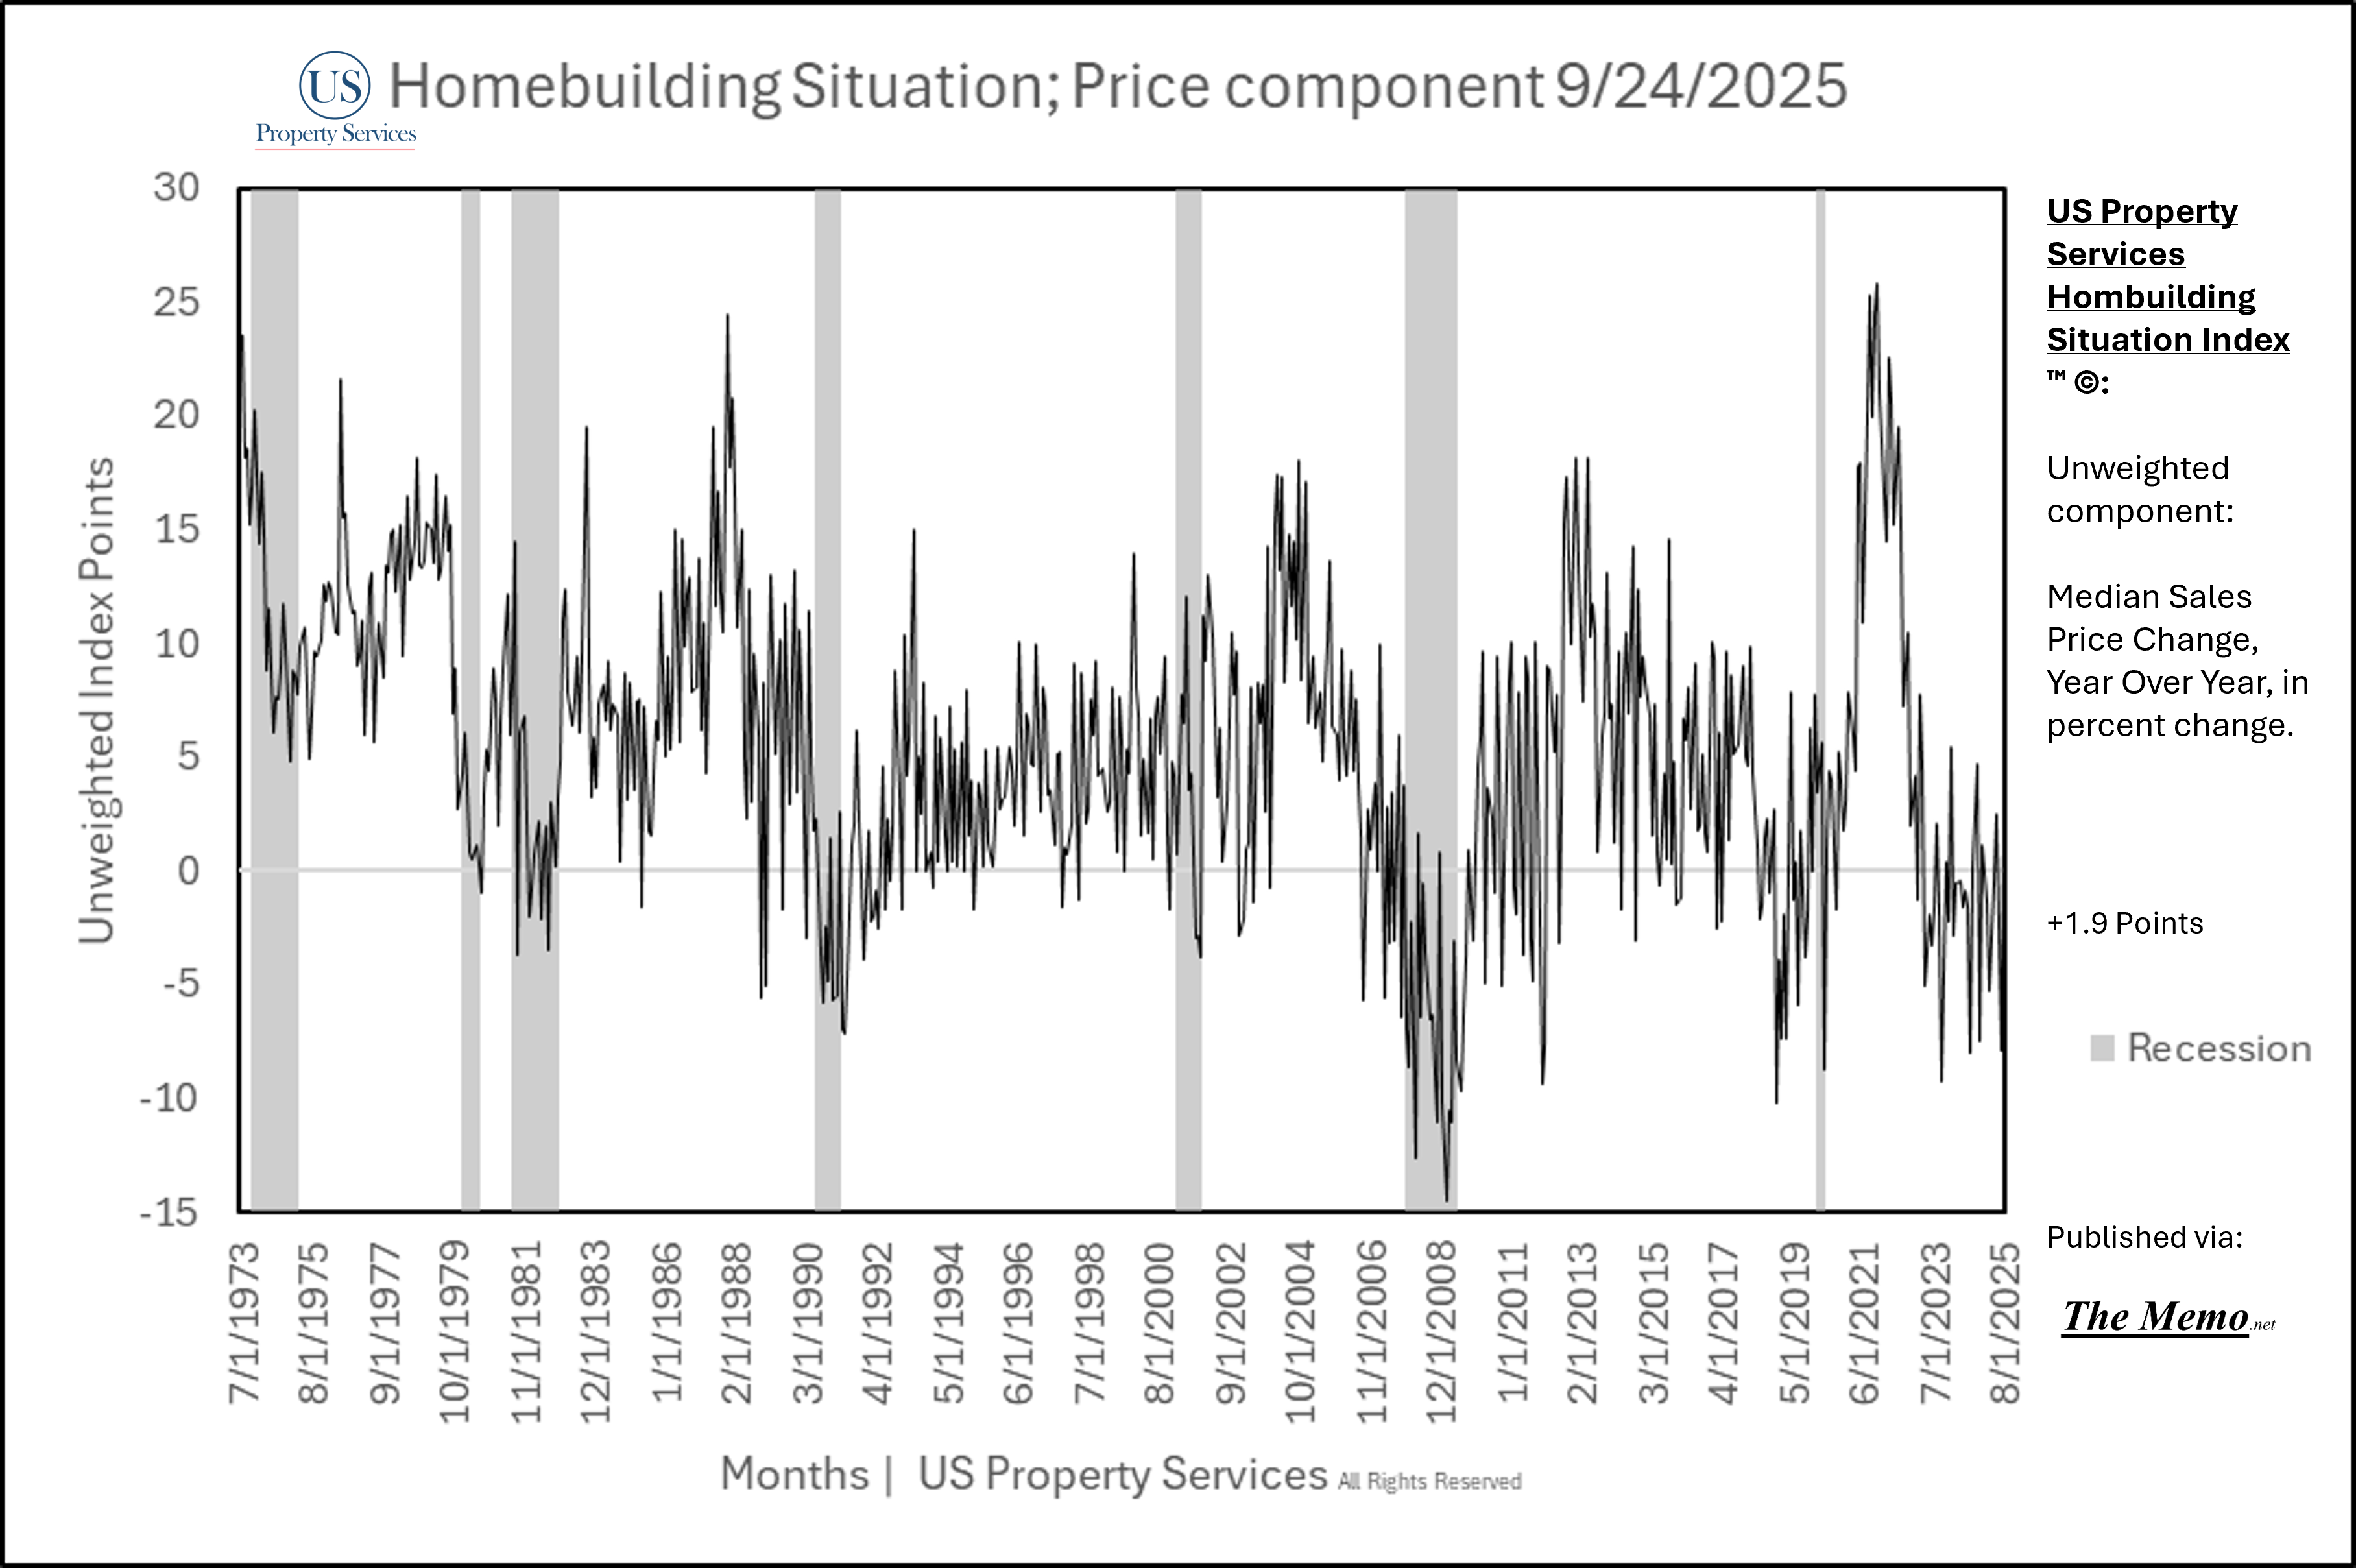
Price Direction
Median Sales Price increased year over year by 1.9%, ending 7 consecutive months of negative slide. The Median Sale Price for a New Home was $413,500. The past 5 months received revisions to pricing, including bringing the new cycle low price of $395,100 in July, tying August 2024 for second highest negative YOY change in price this cycle.
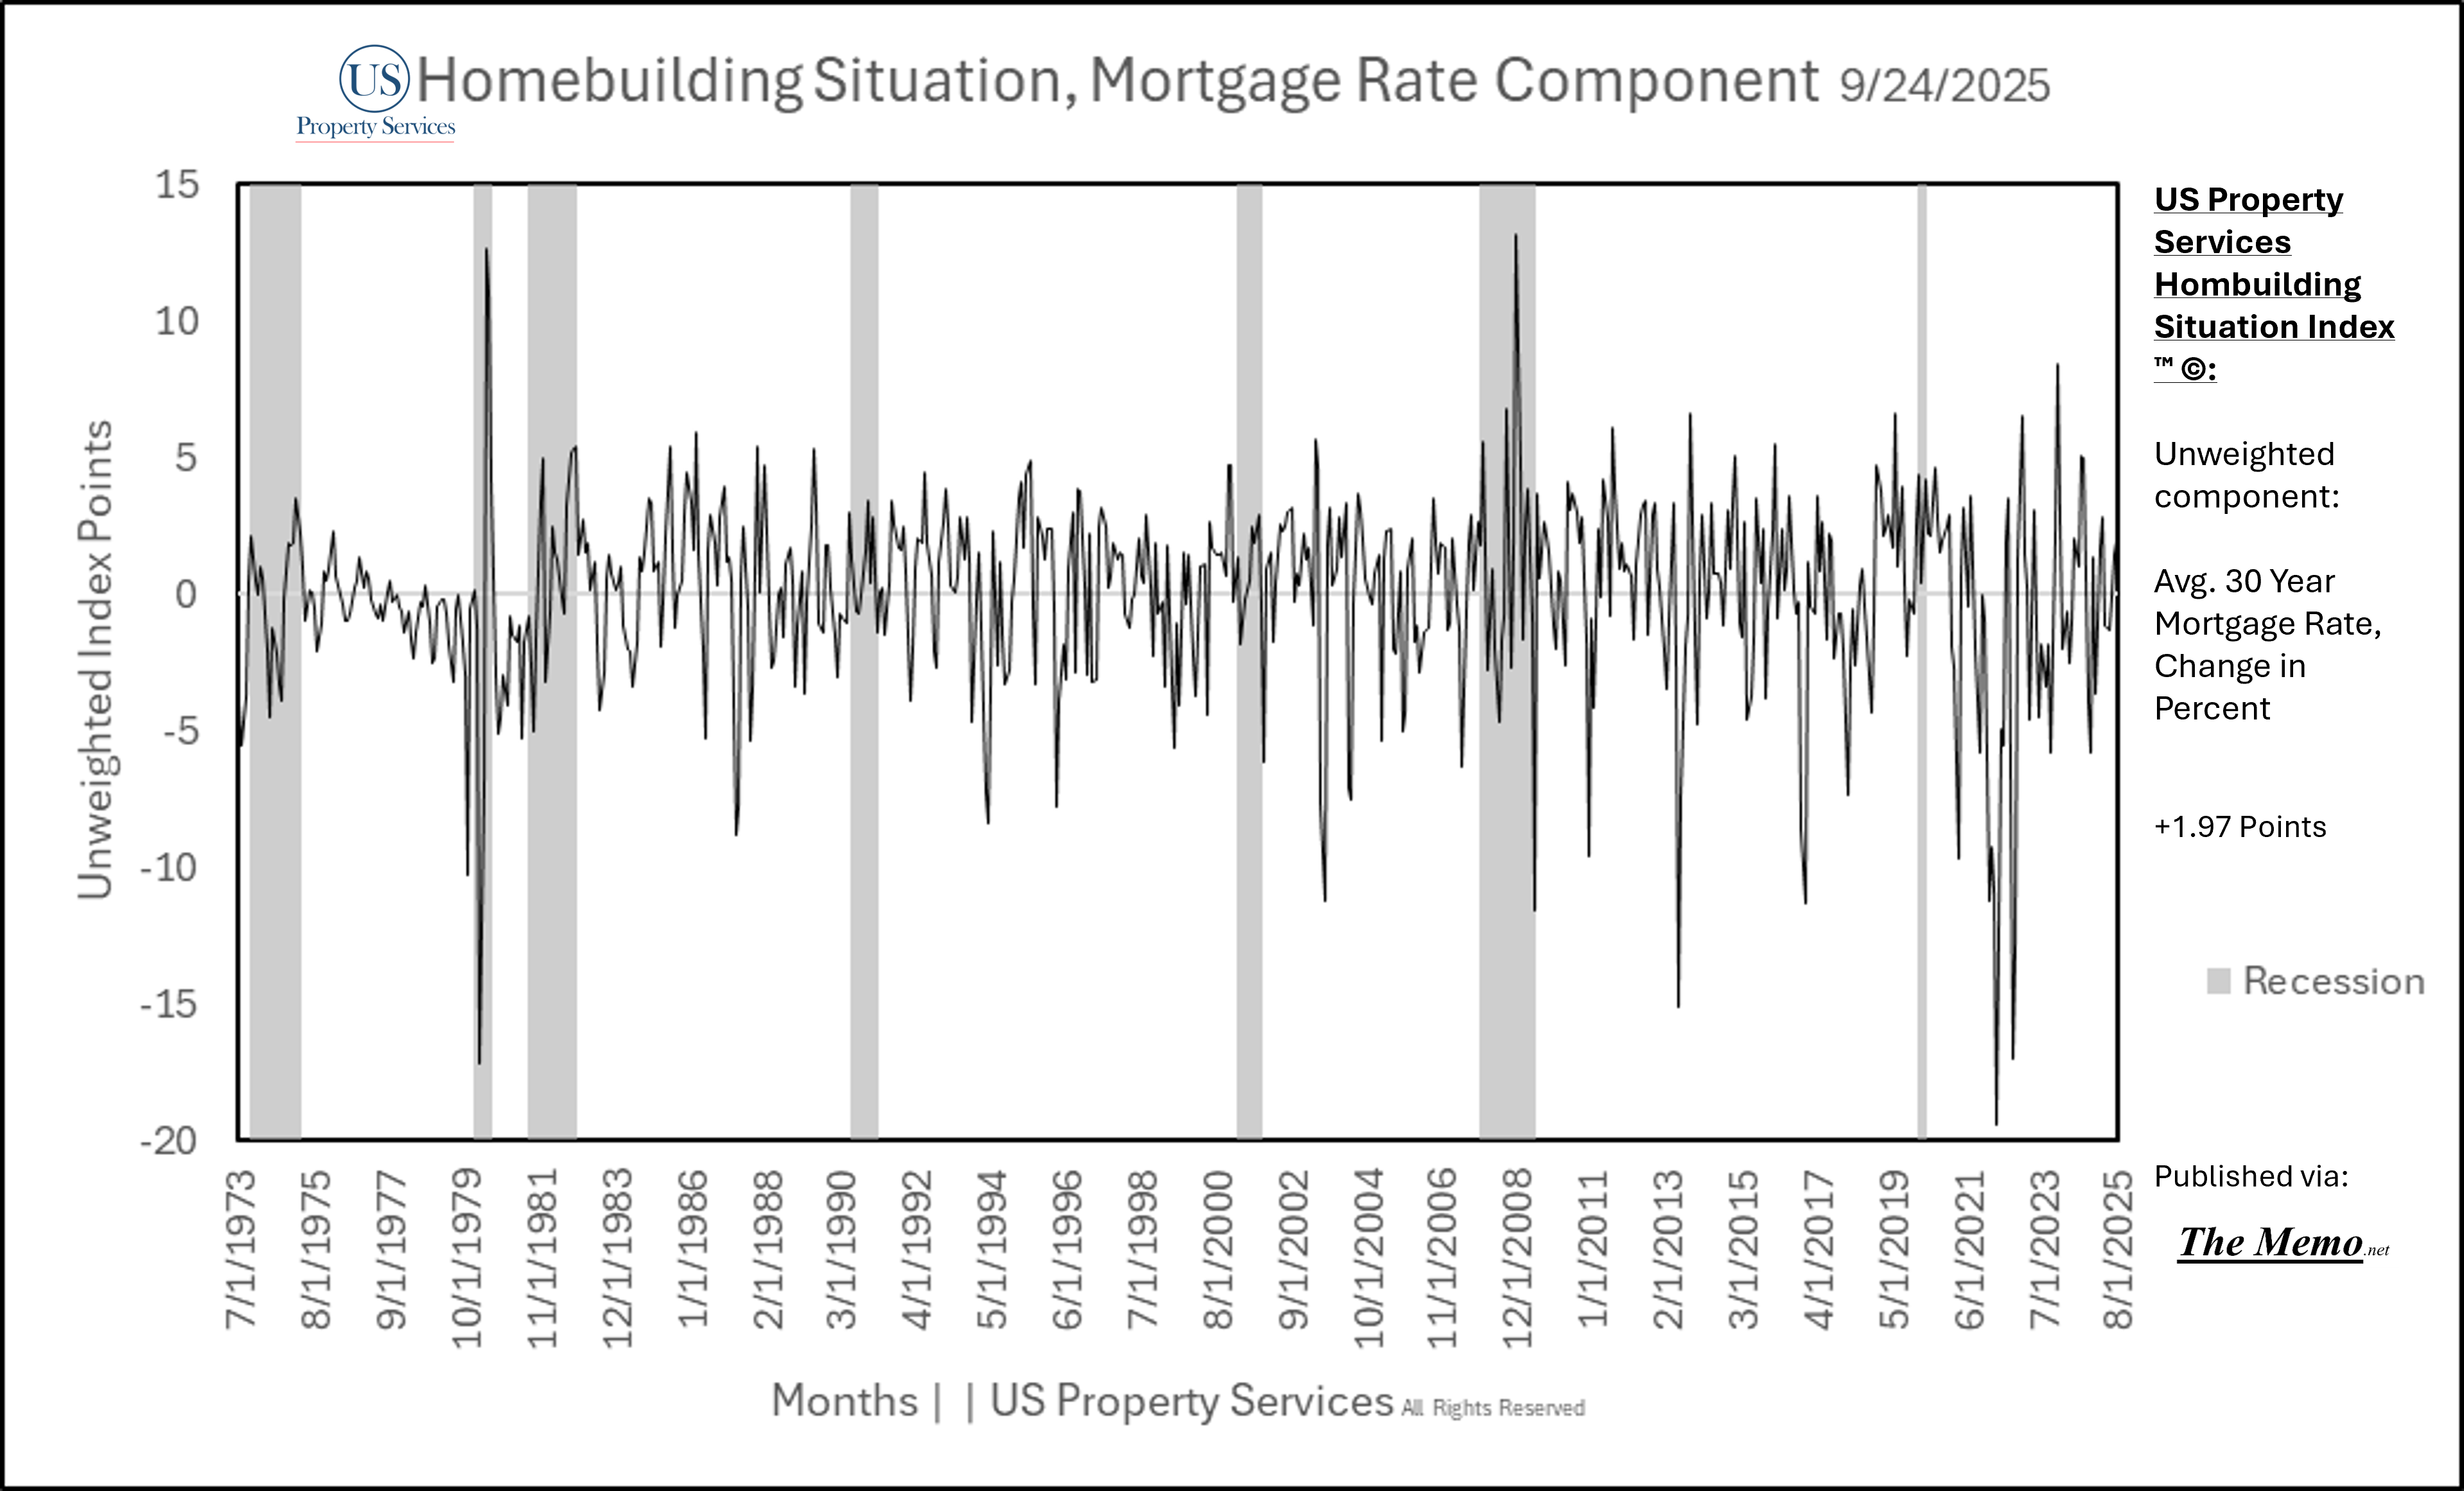
Mortgage Rates
Mortgage rates decreased by -1.9% month over month. August’s average 30yr Fixed Mortgage Rate was 6.59%. Comparatively, August 2007’s 30 year average mortgage rate was 6.57%.
Additional Commentary:
Lennar Earnings and public doubt
This month, I’ve witnessed multiple industry analysts question the validity of the Census Bureau’s Survey of Construction data. Mostly questioning this months (by mostly I mean only) units sold number. These are the same people who ignored the signs of growing inventory, increasing COGS (cost of goods sold), increasing SG&A (selling, general and administrative costs), increasing cost of money (mortgage rates) and increase of publicly traded builder commentary highlighting stress over the last two years, in favor of the narrative that, “the housing shortage will never end and home sales will only ever increase”.
I’m only slightly exaggerating the last phrase, and under whelming the prior realities.
I find it curious, that only now, do these folks question the published data. And of all the data, only the recent sales data. Which, if you’ve read this report, you expected, because I told you to, that August would see a sales bump. And September also won’t be nearly as bad as “word on the street” says it will. All while missing the coldest quarter of them all, if they’d just look beyond the pavement in front of the hood to see where Quarter 4’s bend in the road takes them.
Especially when that’s the least questionable form of the data reported.
Take for instance, in the last 12 months, the Census Bureau, with zero explanation other than “times were tough don’t judge us”, altered the median sales price of new homes data collected, going back to 2020. Erasing over $50,000 in gains to the previously reported Median sales price.
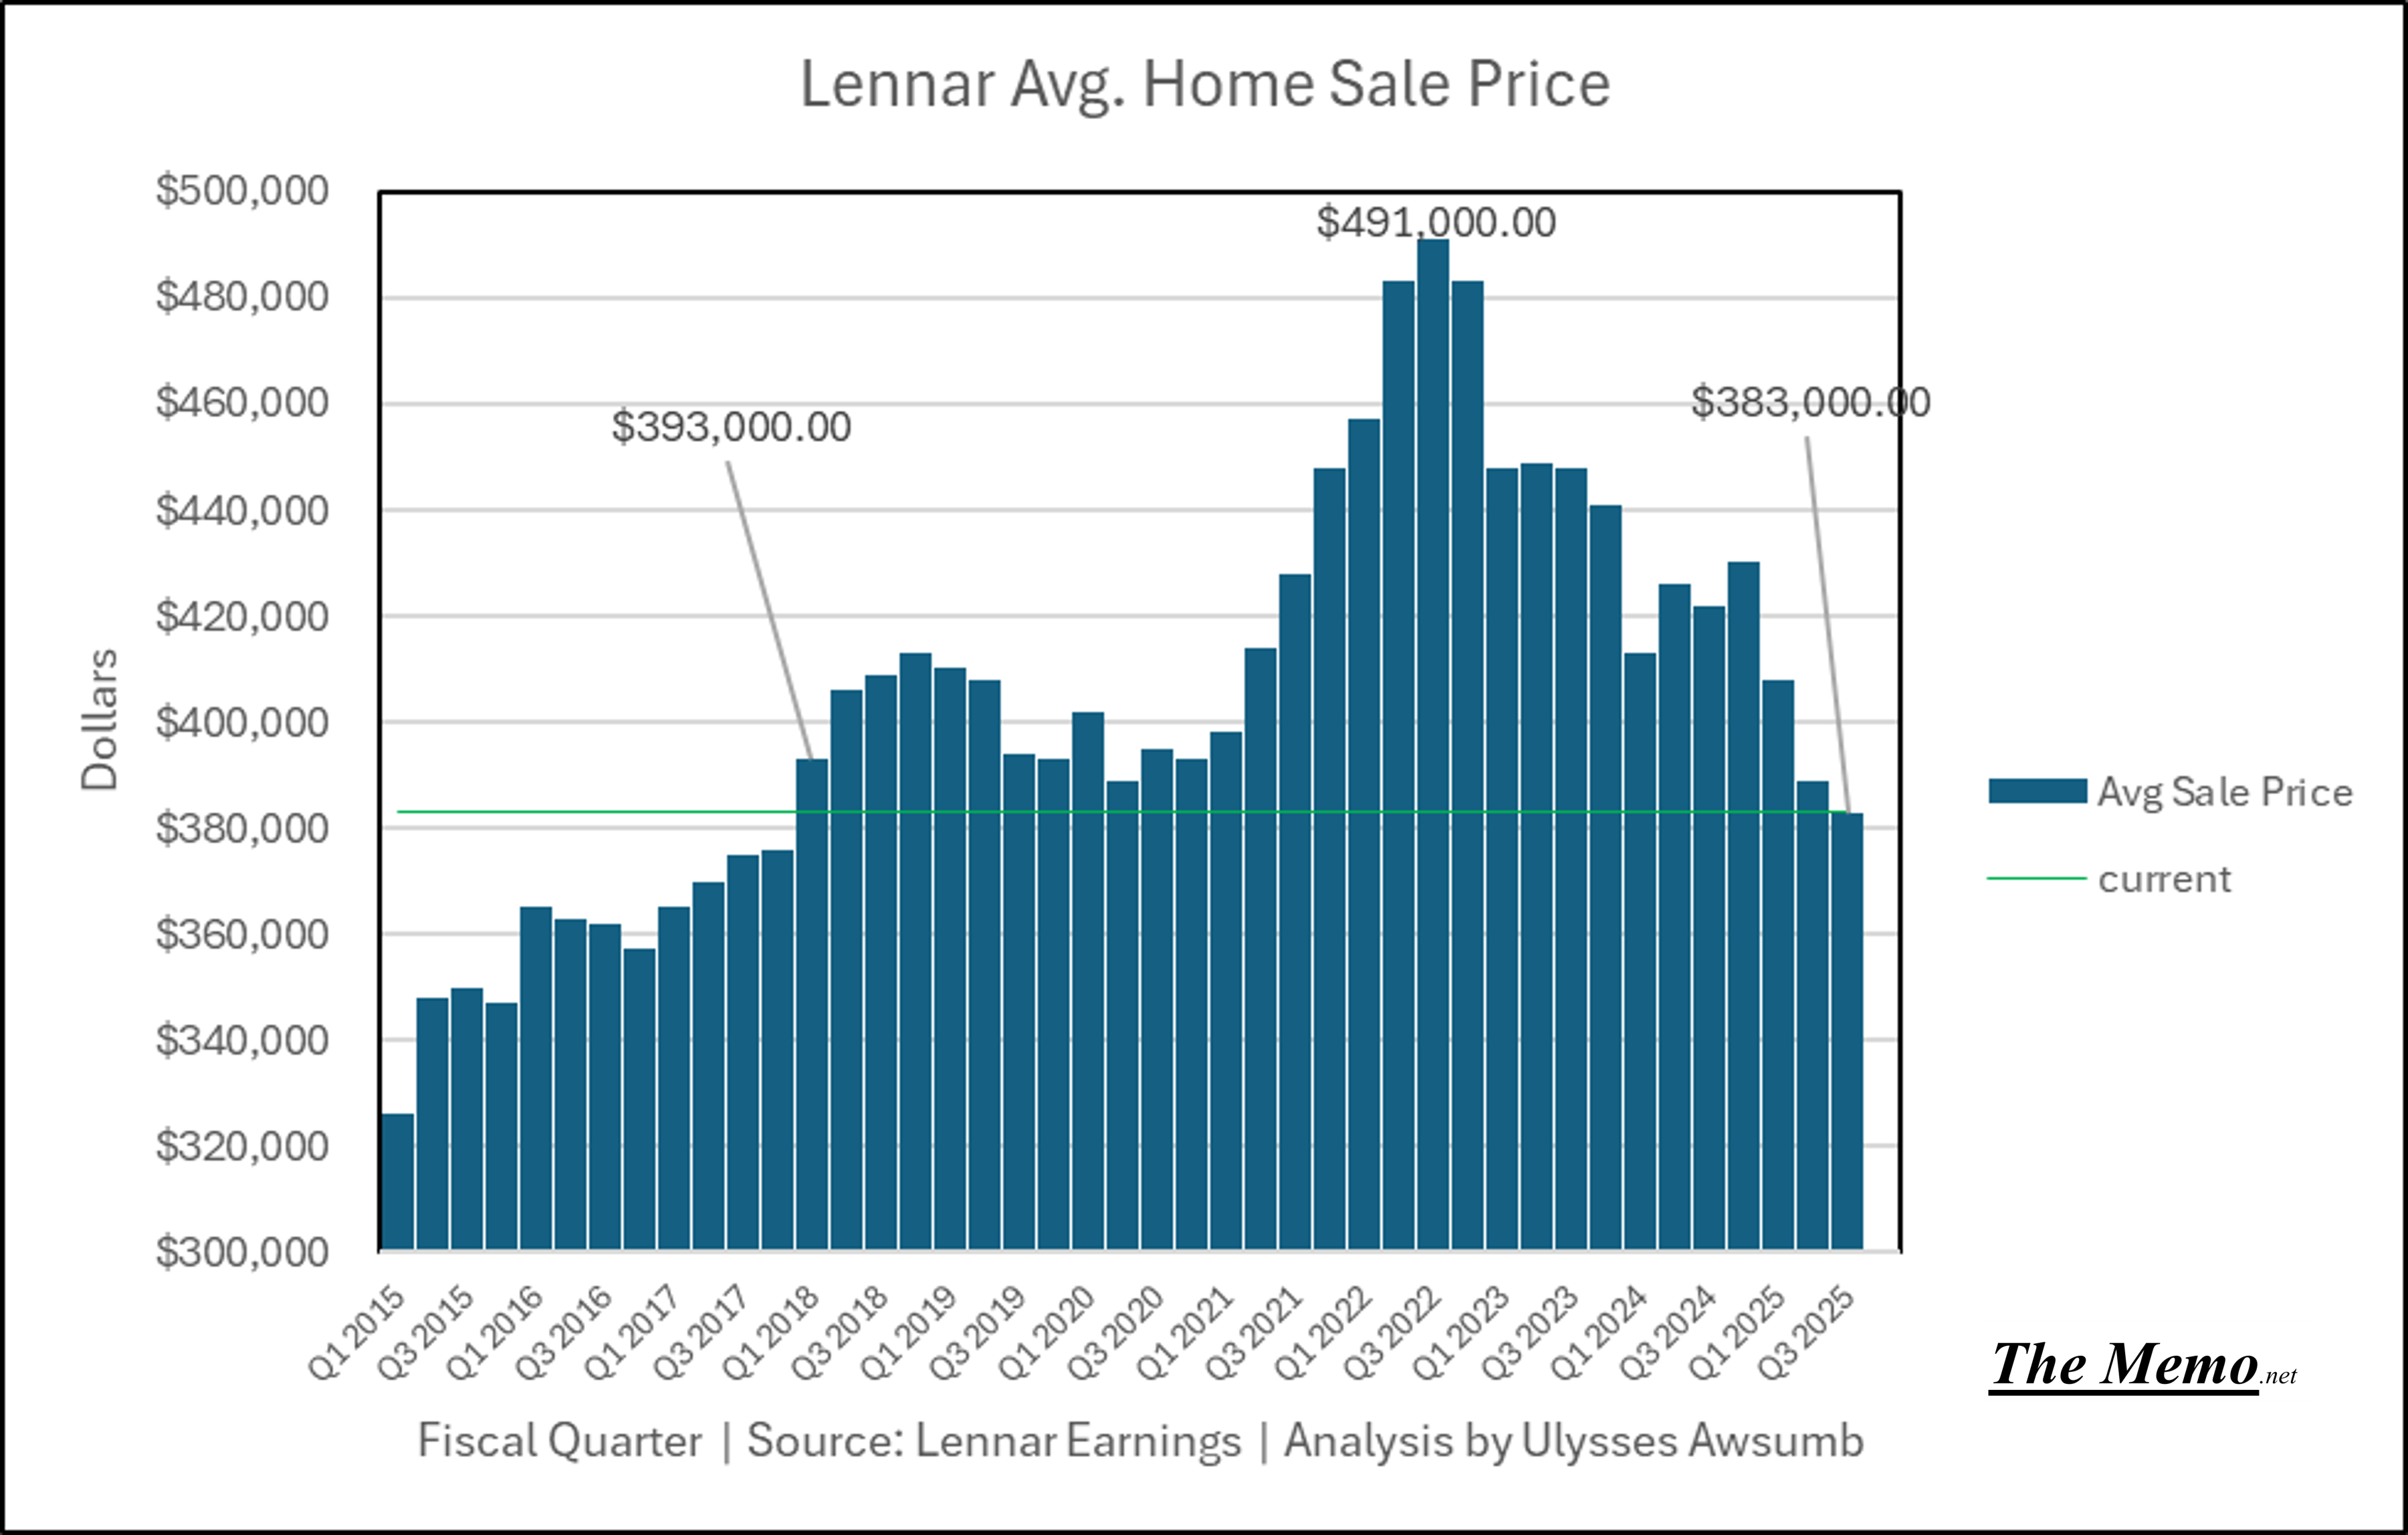
When I publicly challenged that, analysts responded to me “the builders didn’t report that big of an increase”. Nevermind that I literally worked for then the 10th largest publicly traded builder, and witnessed it first hand, day in and day out, let’s let Lennar “reporting” vis a vis earnings, compared to the Census Bureau’s sales by Conventional Finance type. Which makes up >75% of sales.
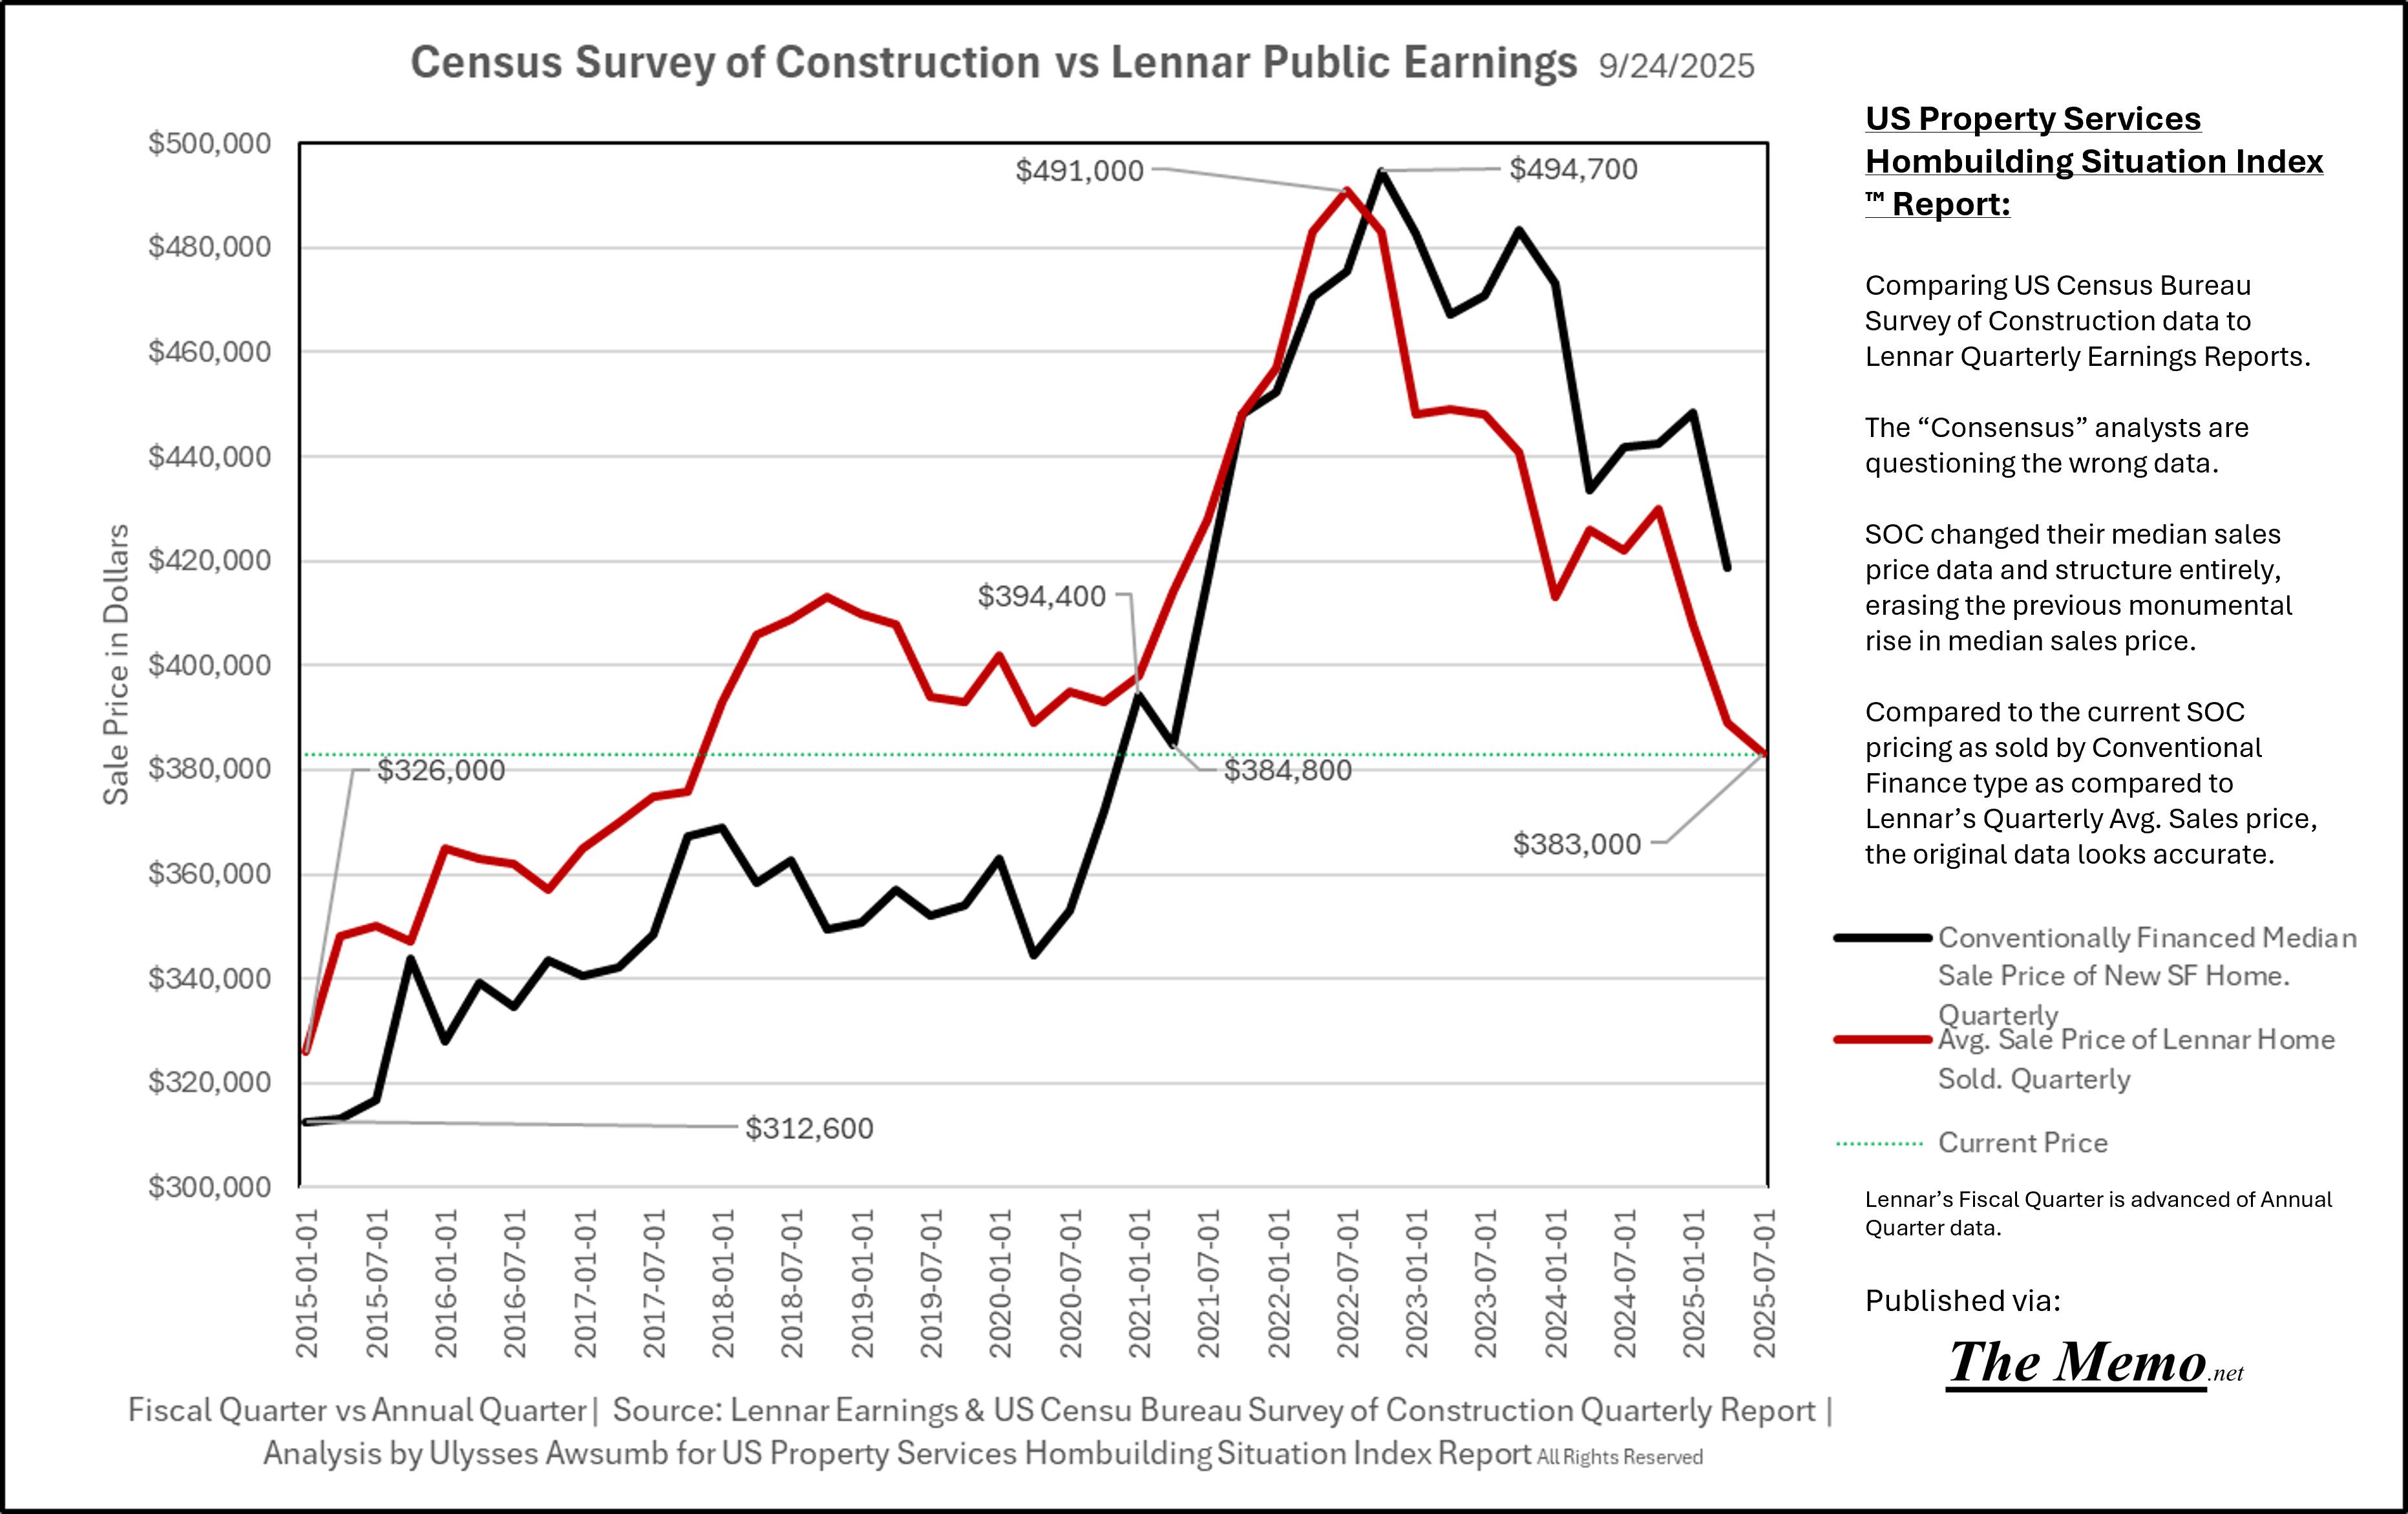
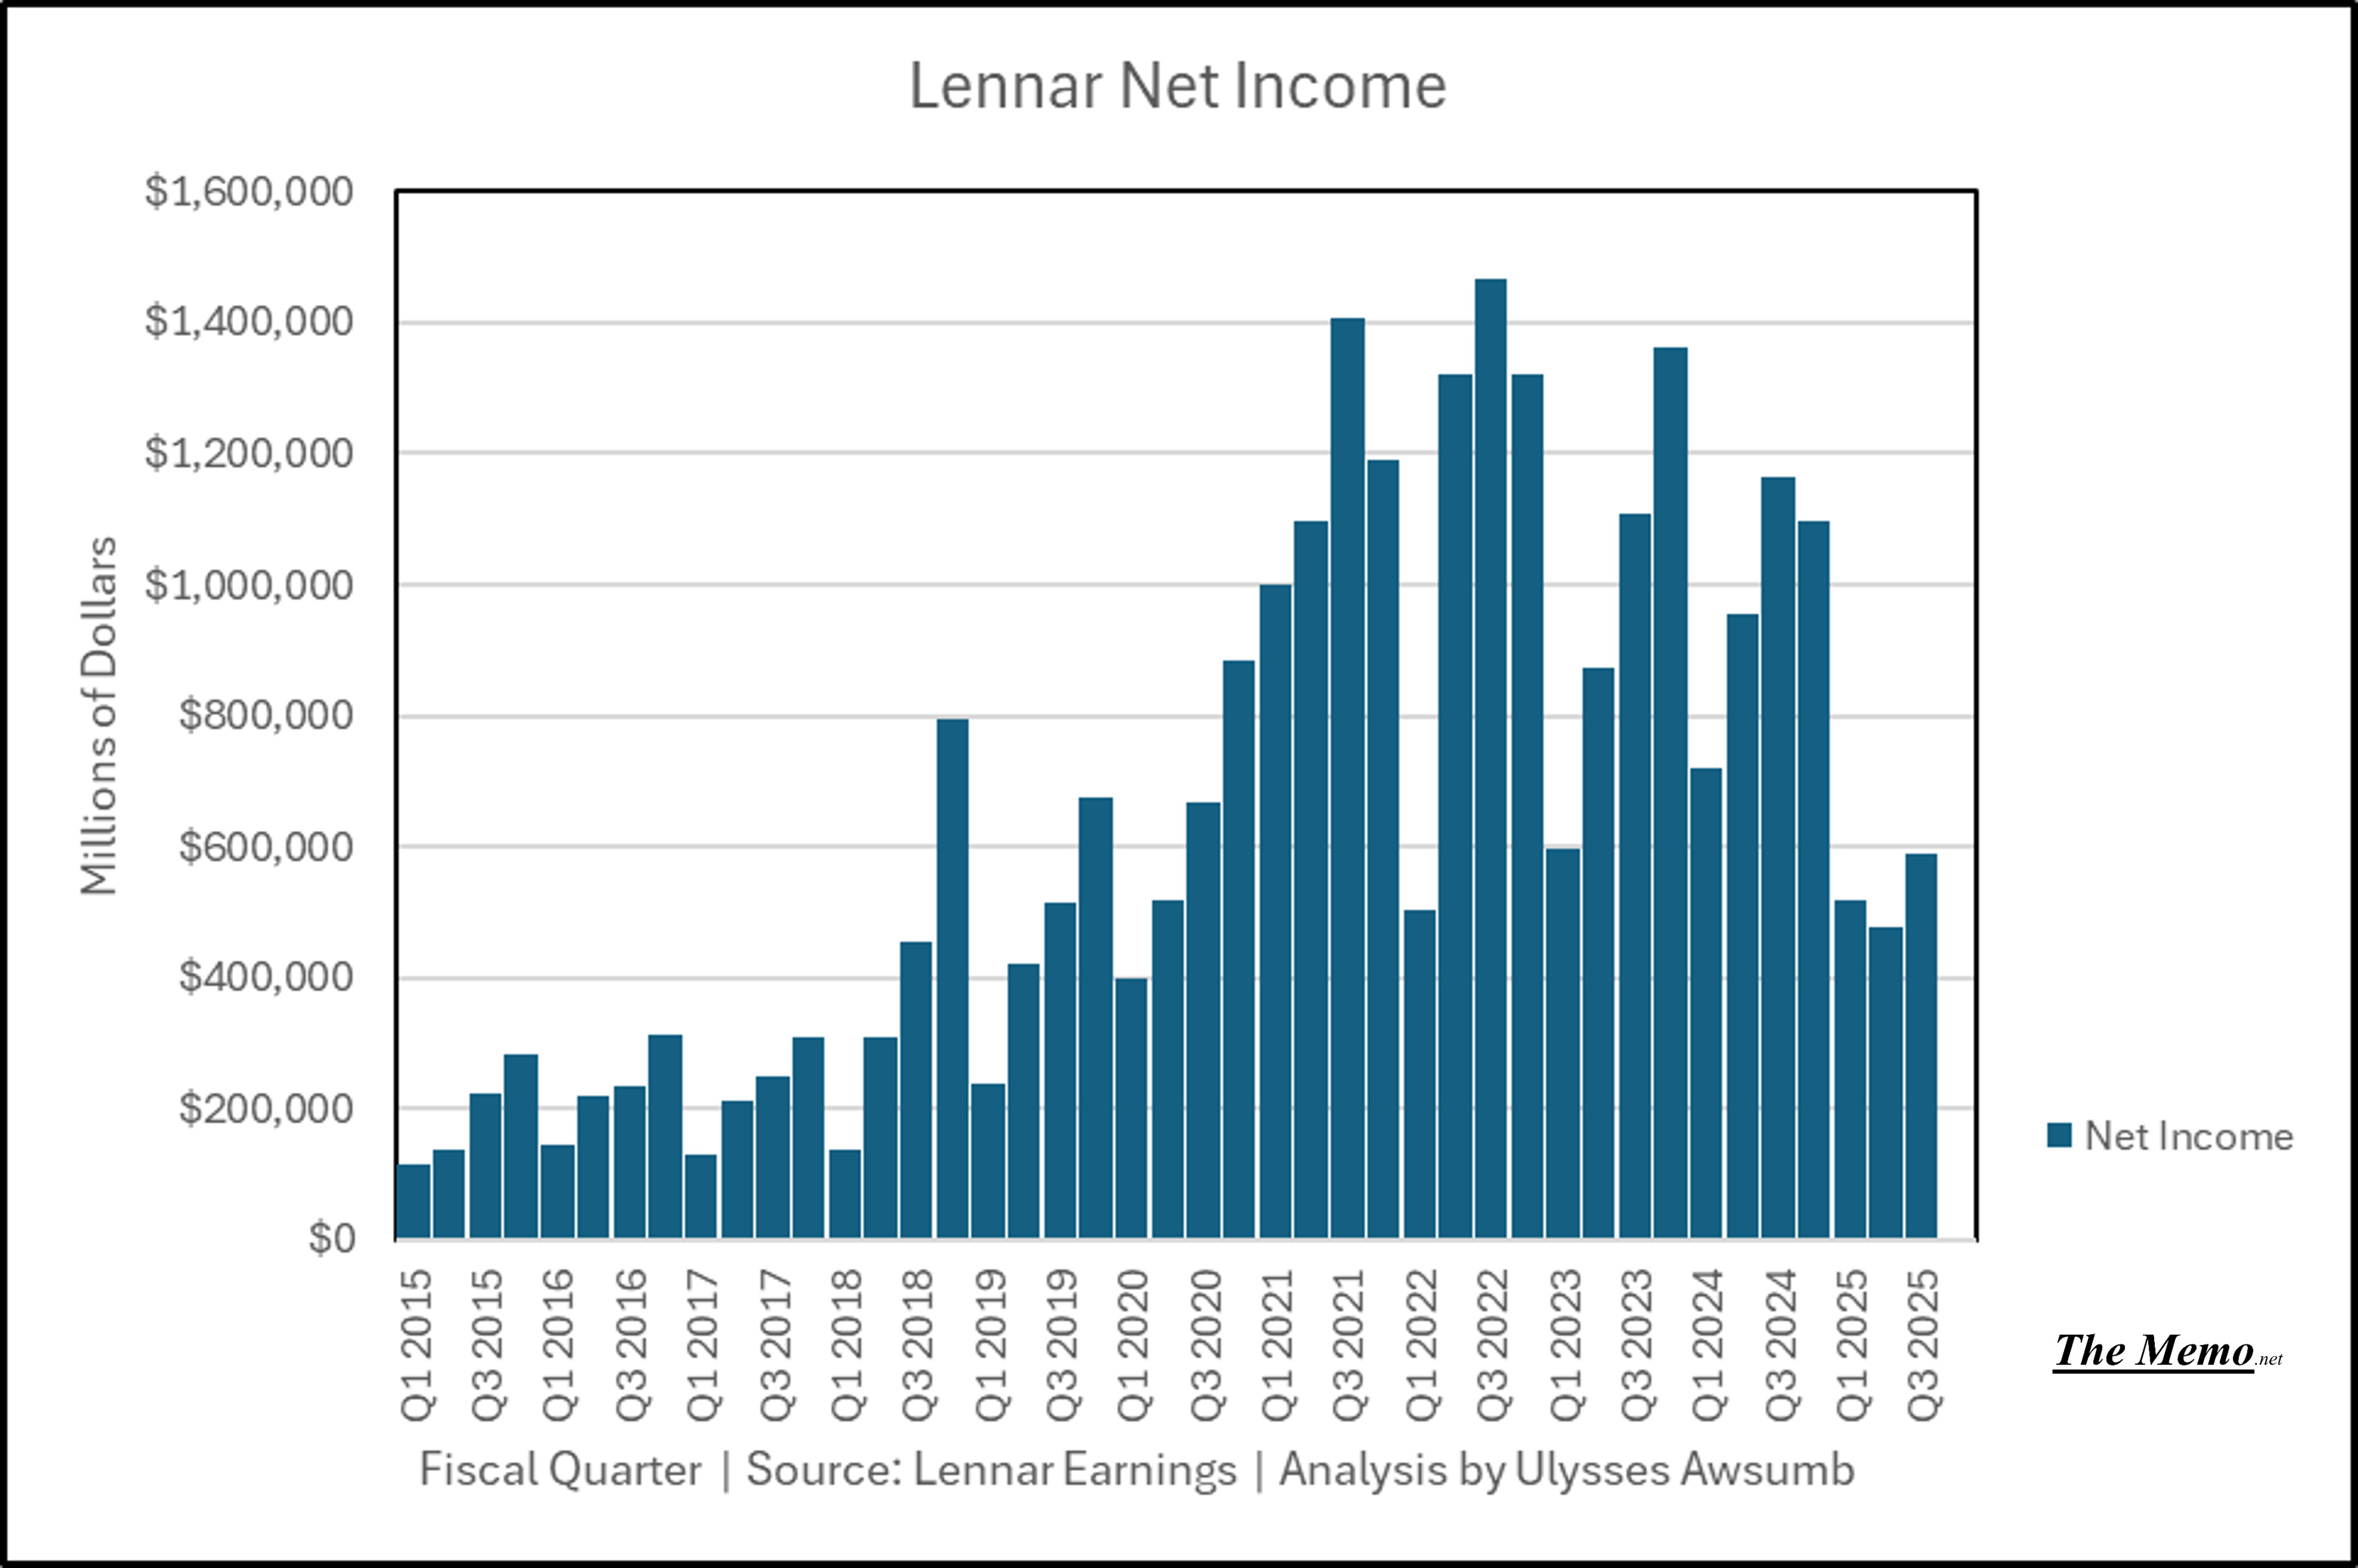
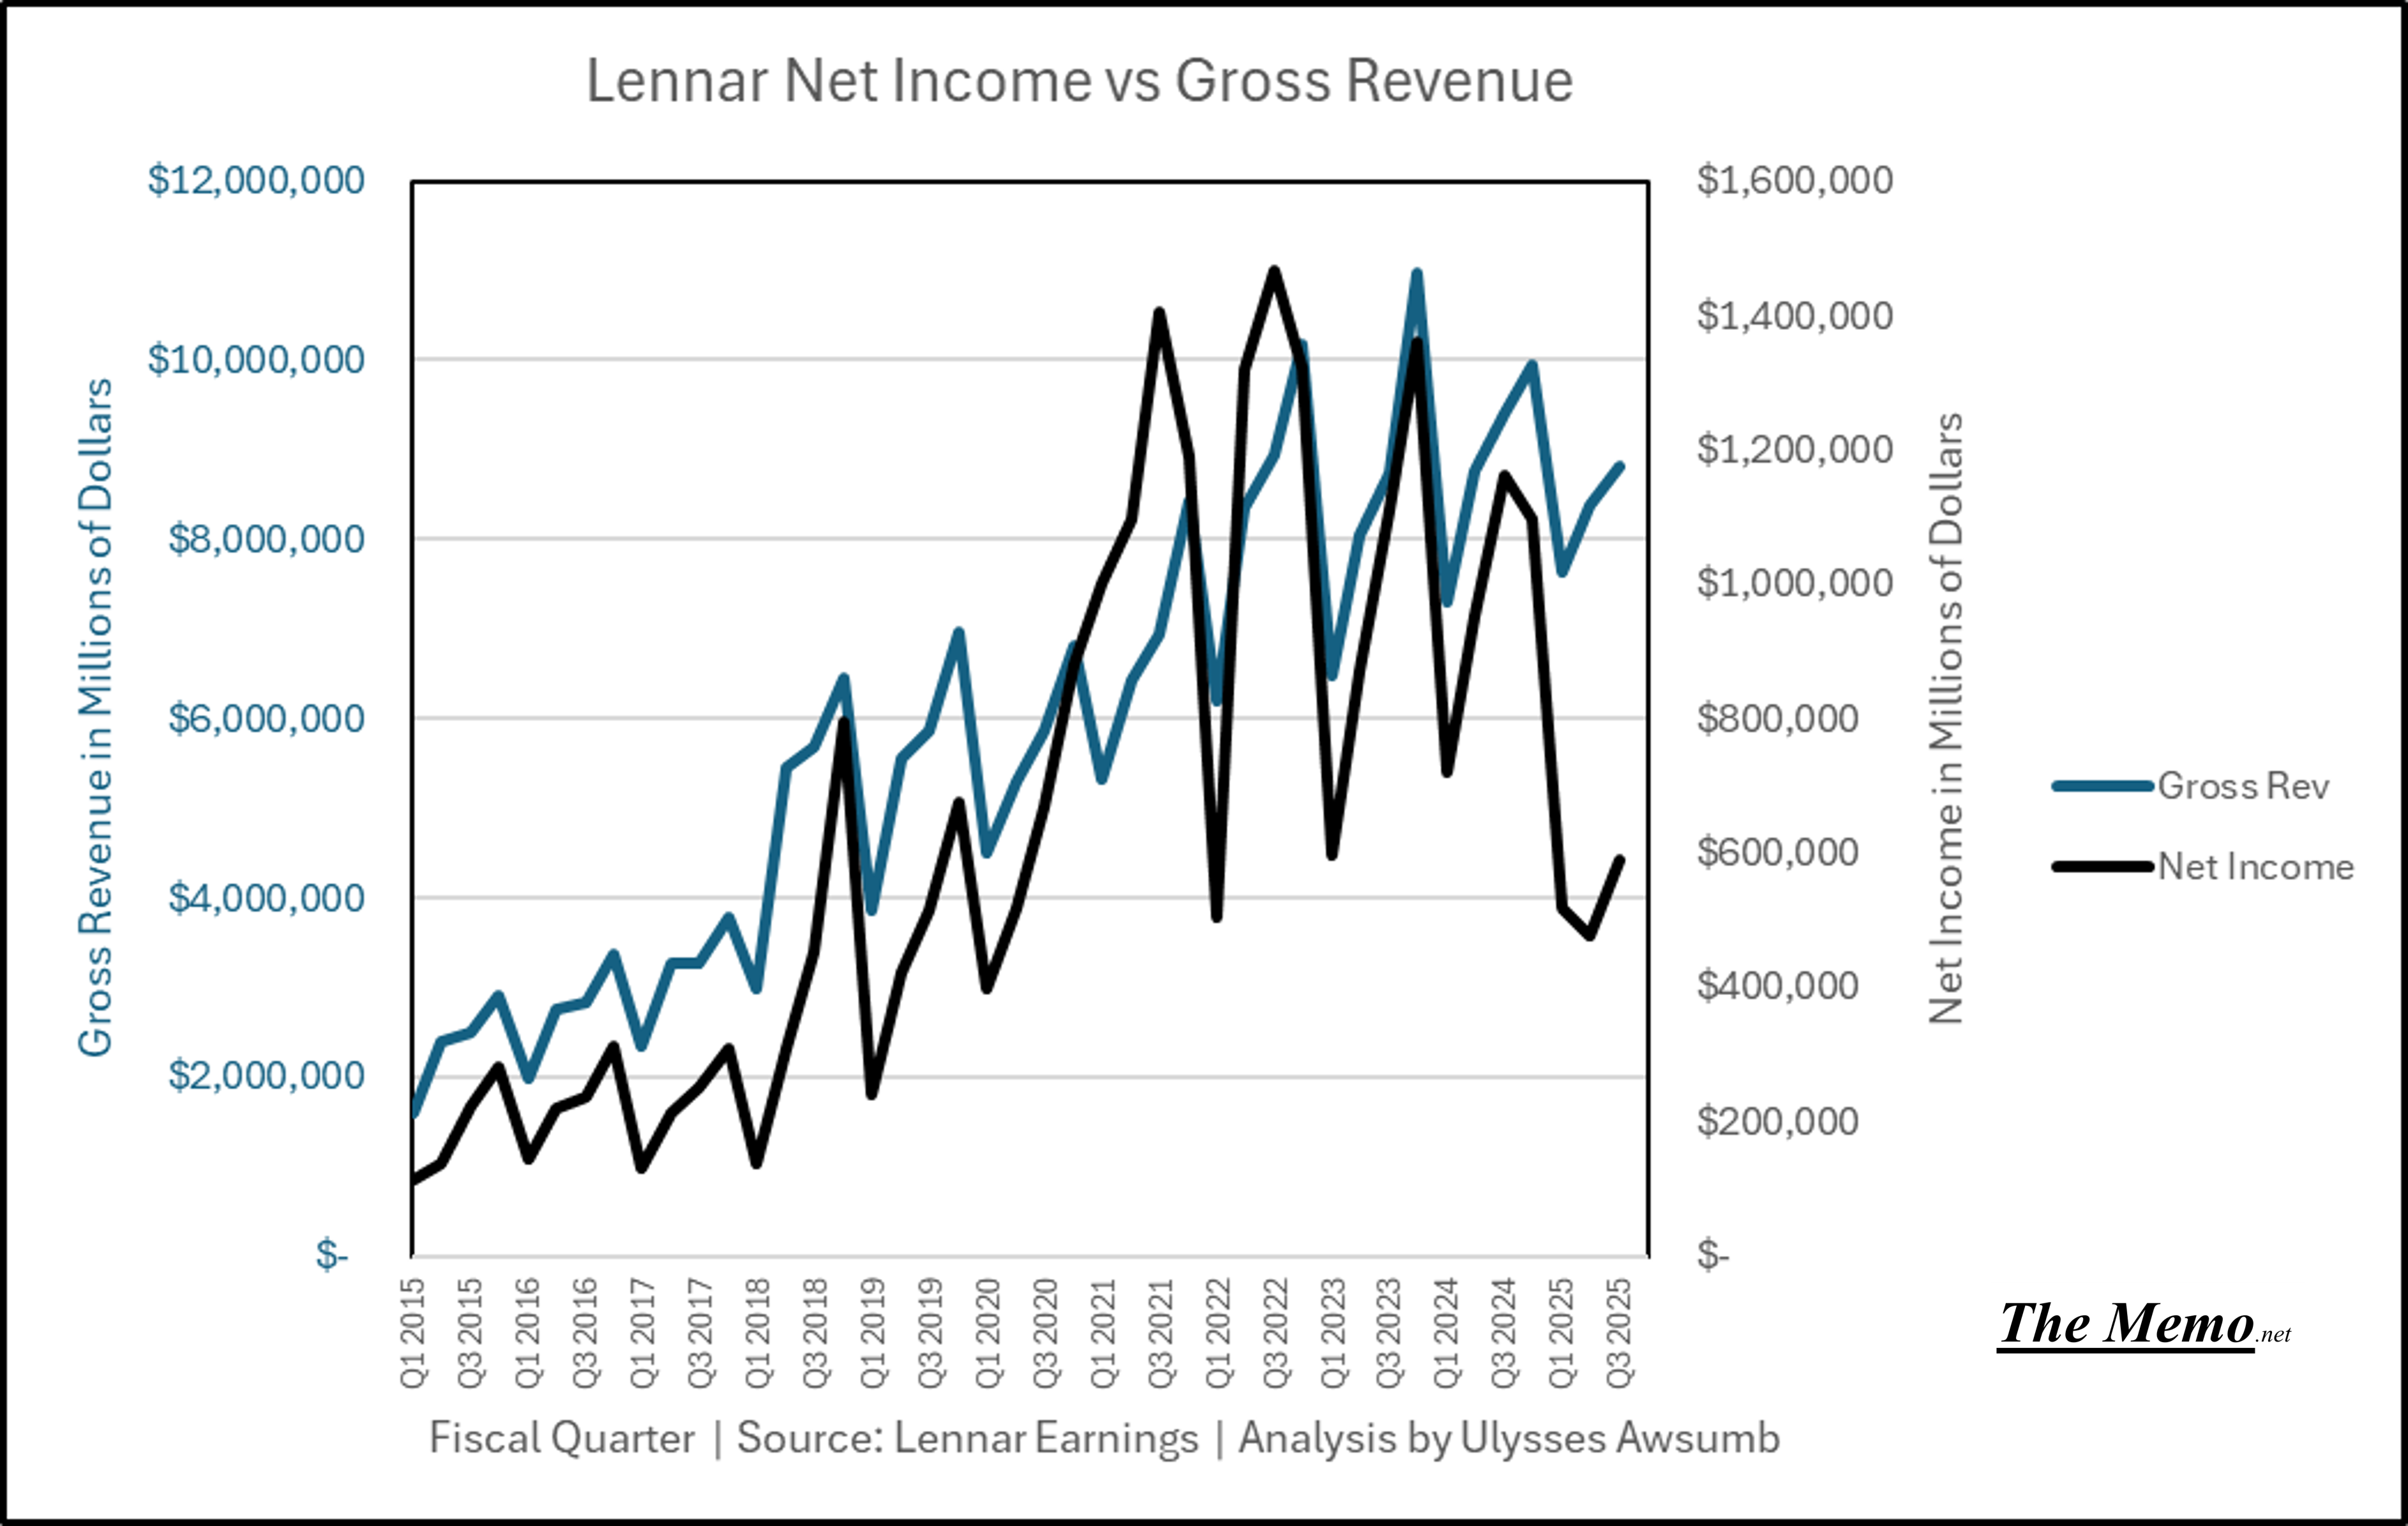
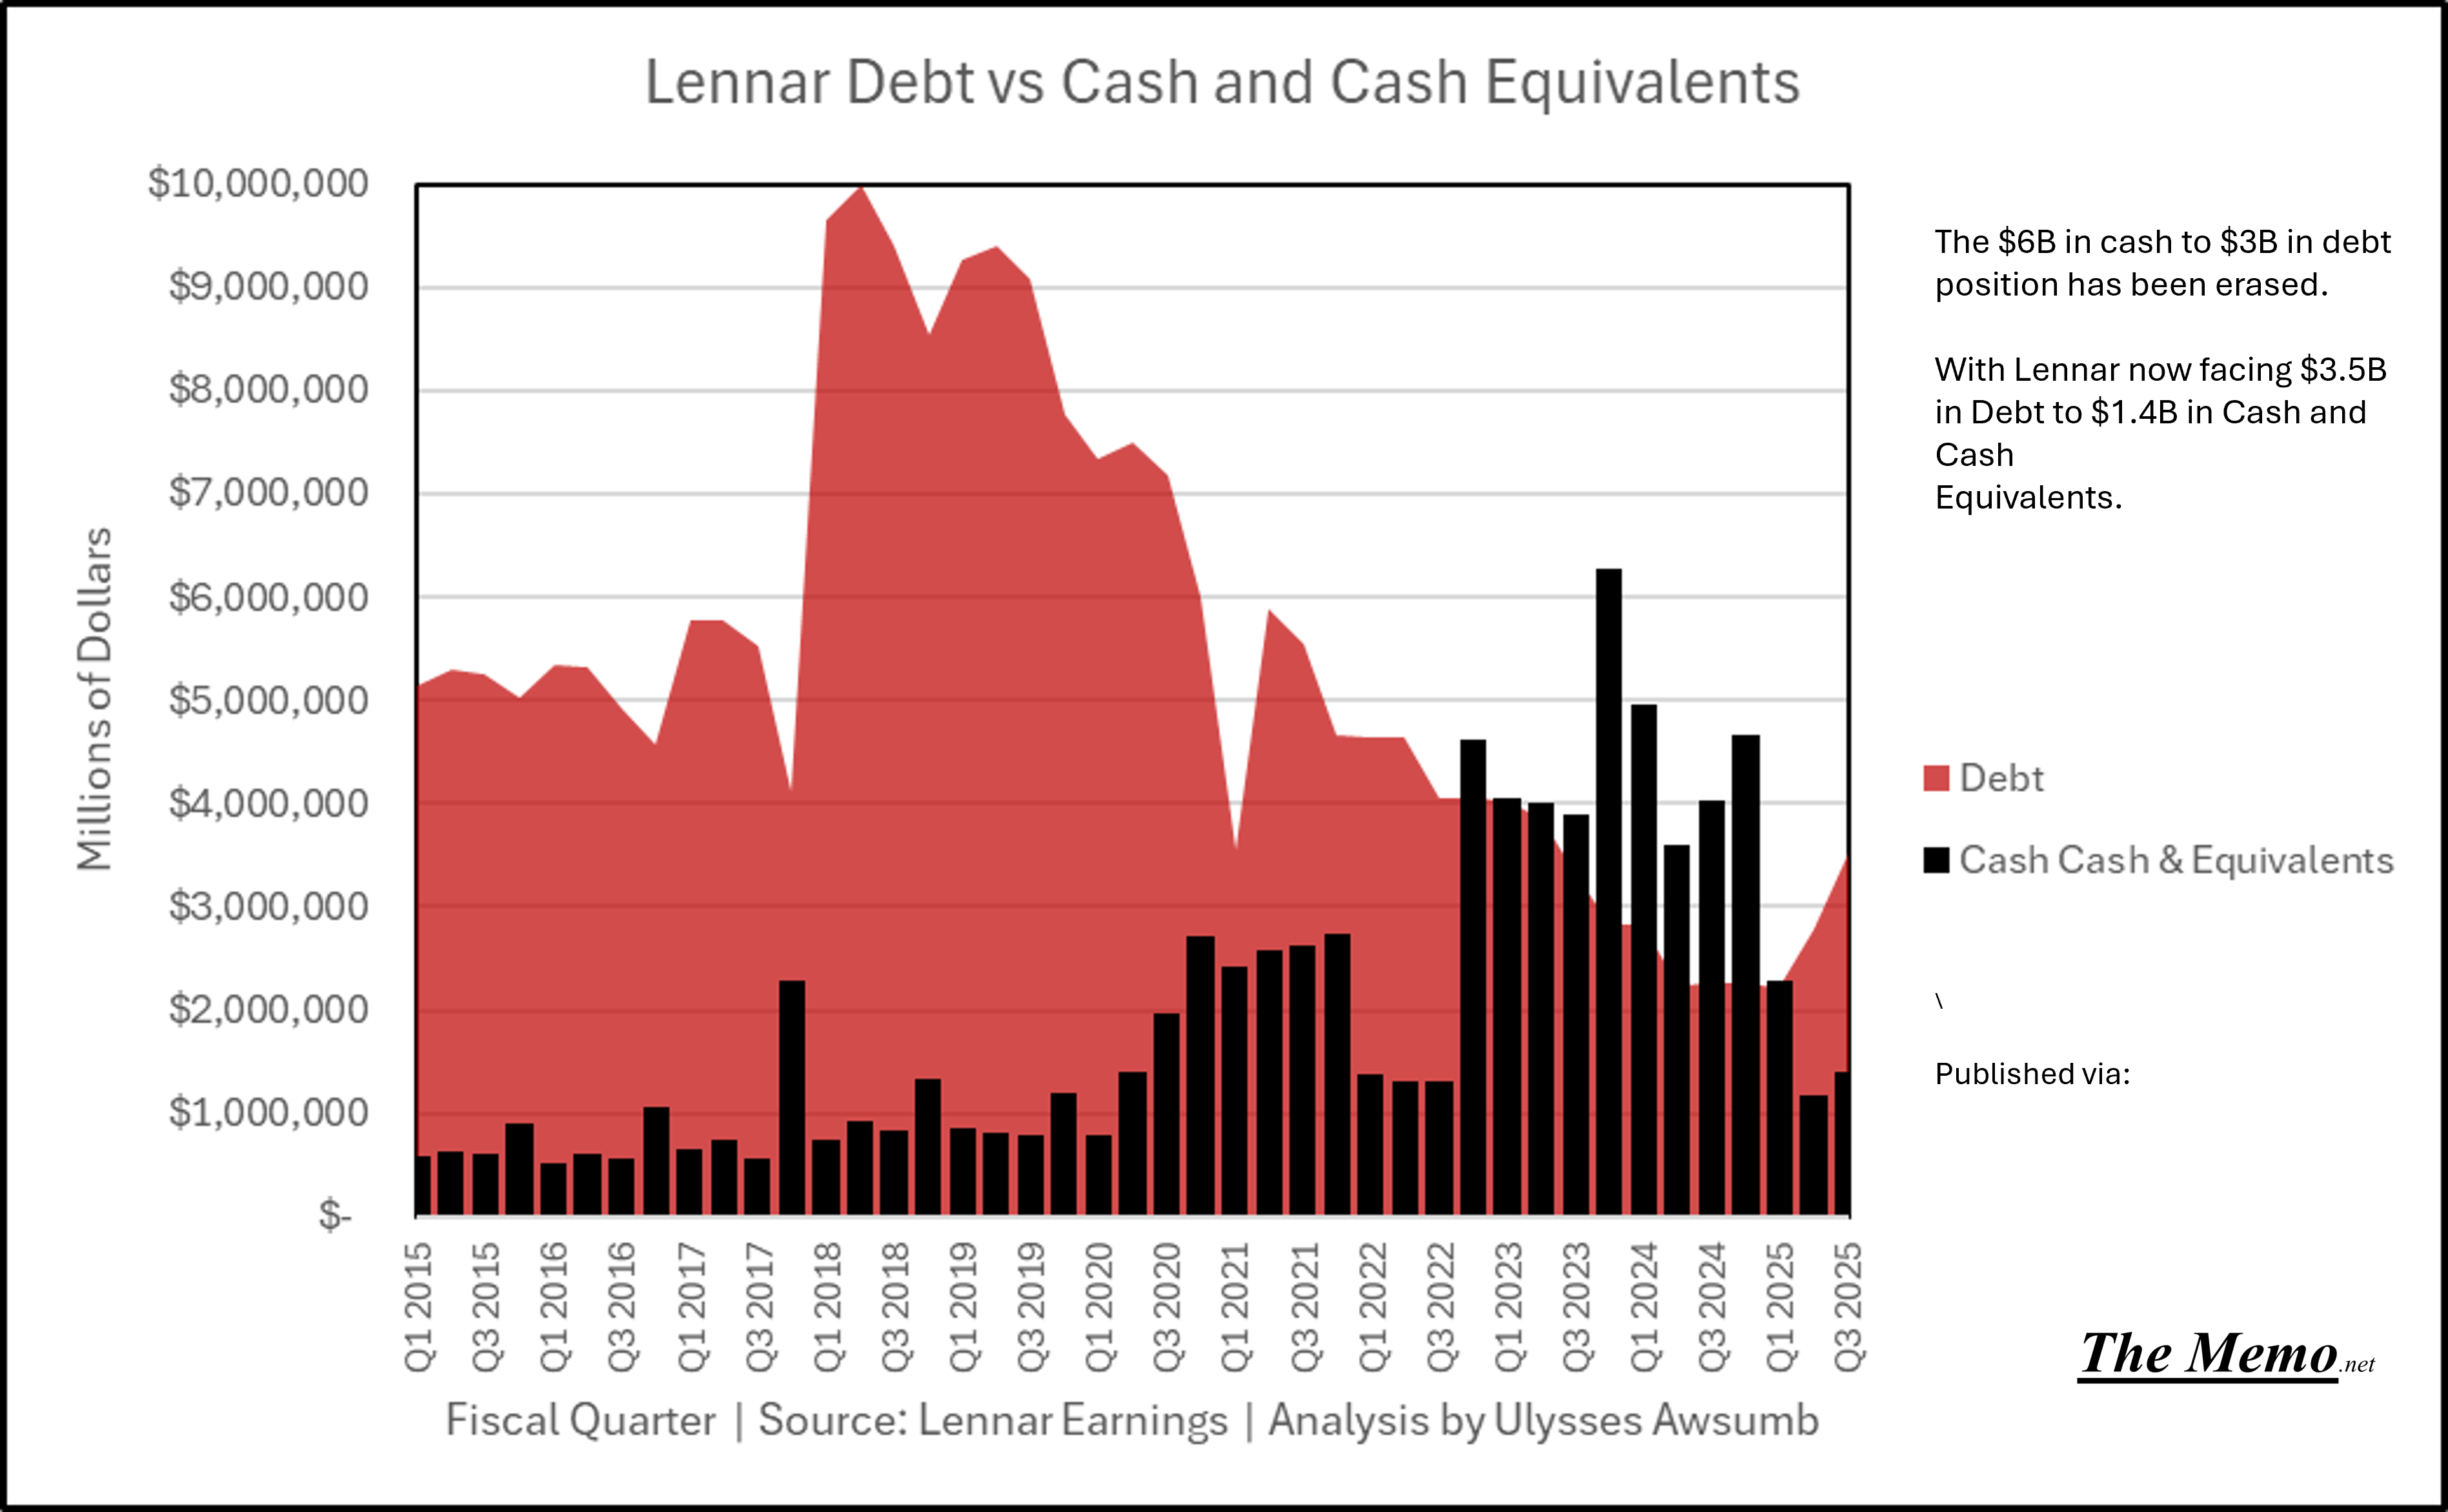
By the way, Lennar just erased 7 years of price gains. With Avg. Sales price back to 2017/18 levels.
I guess everyone forgot about that, since this is the new “official” monthly sales numbers:
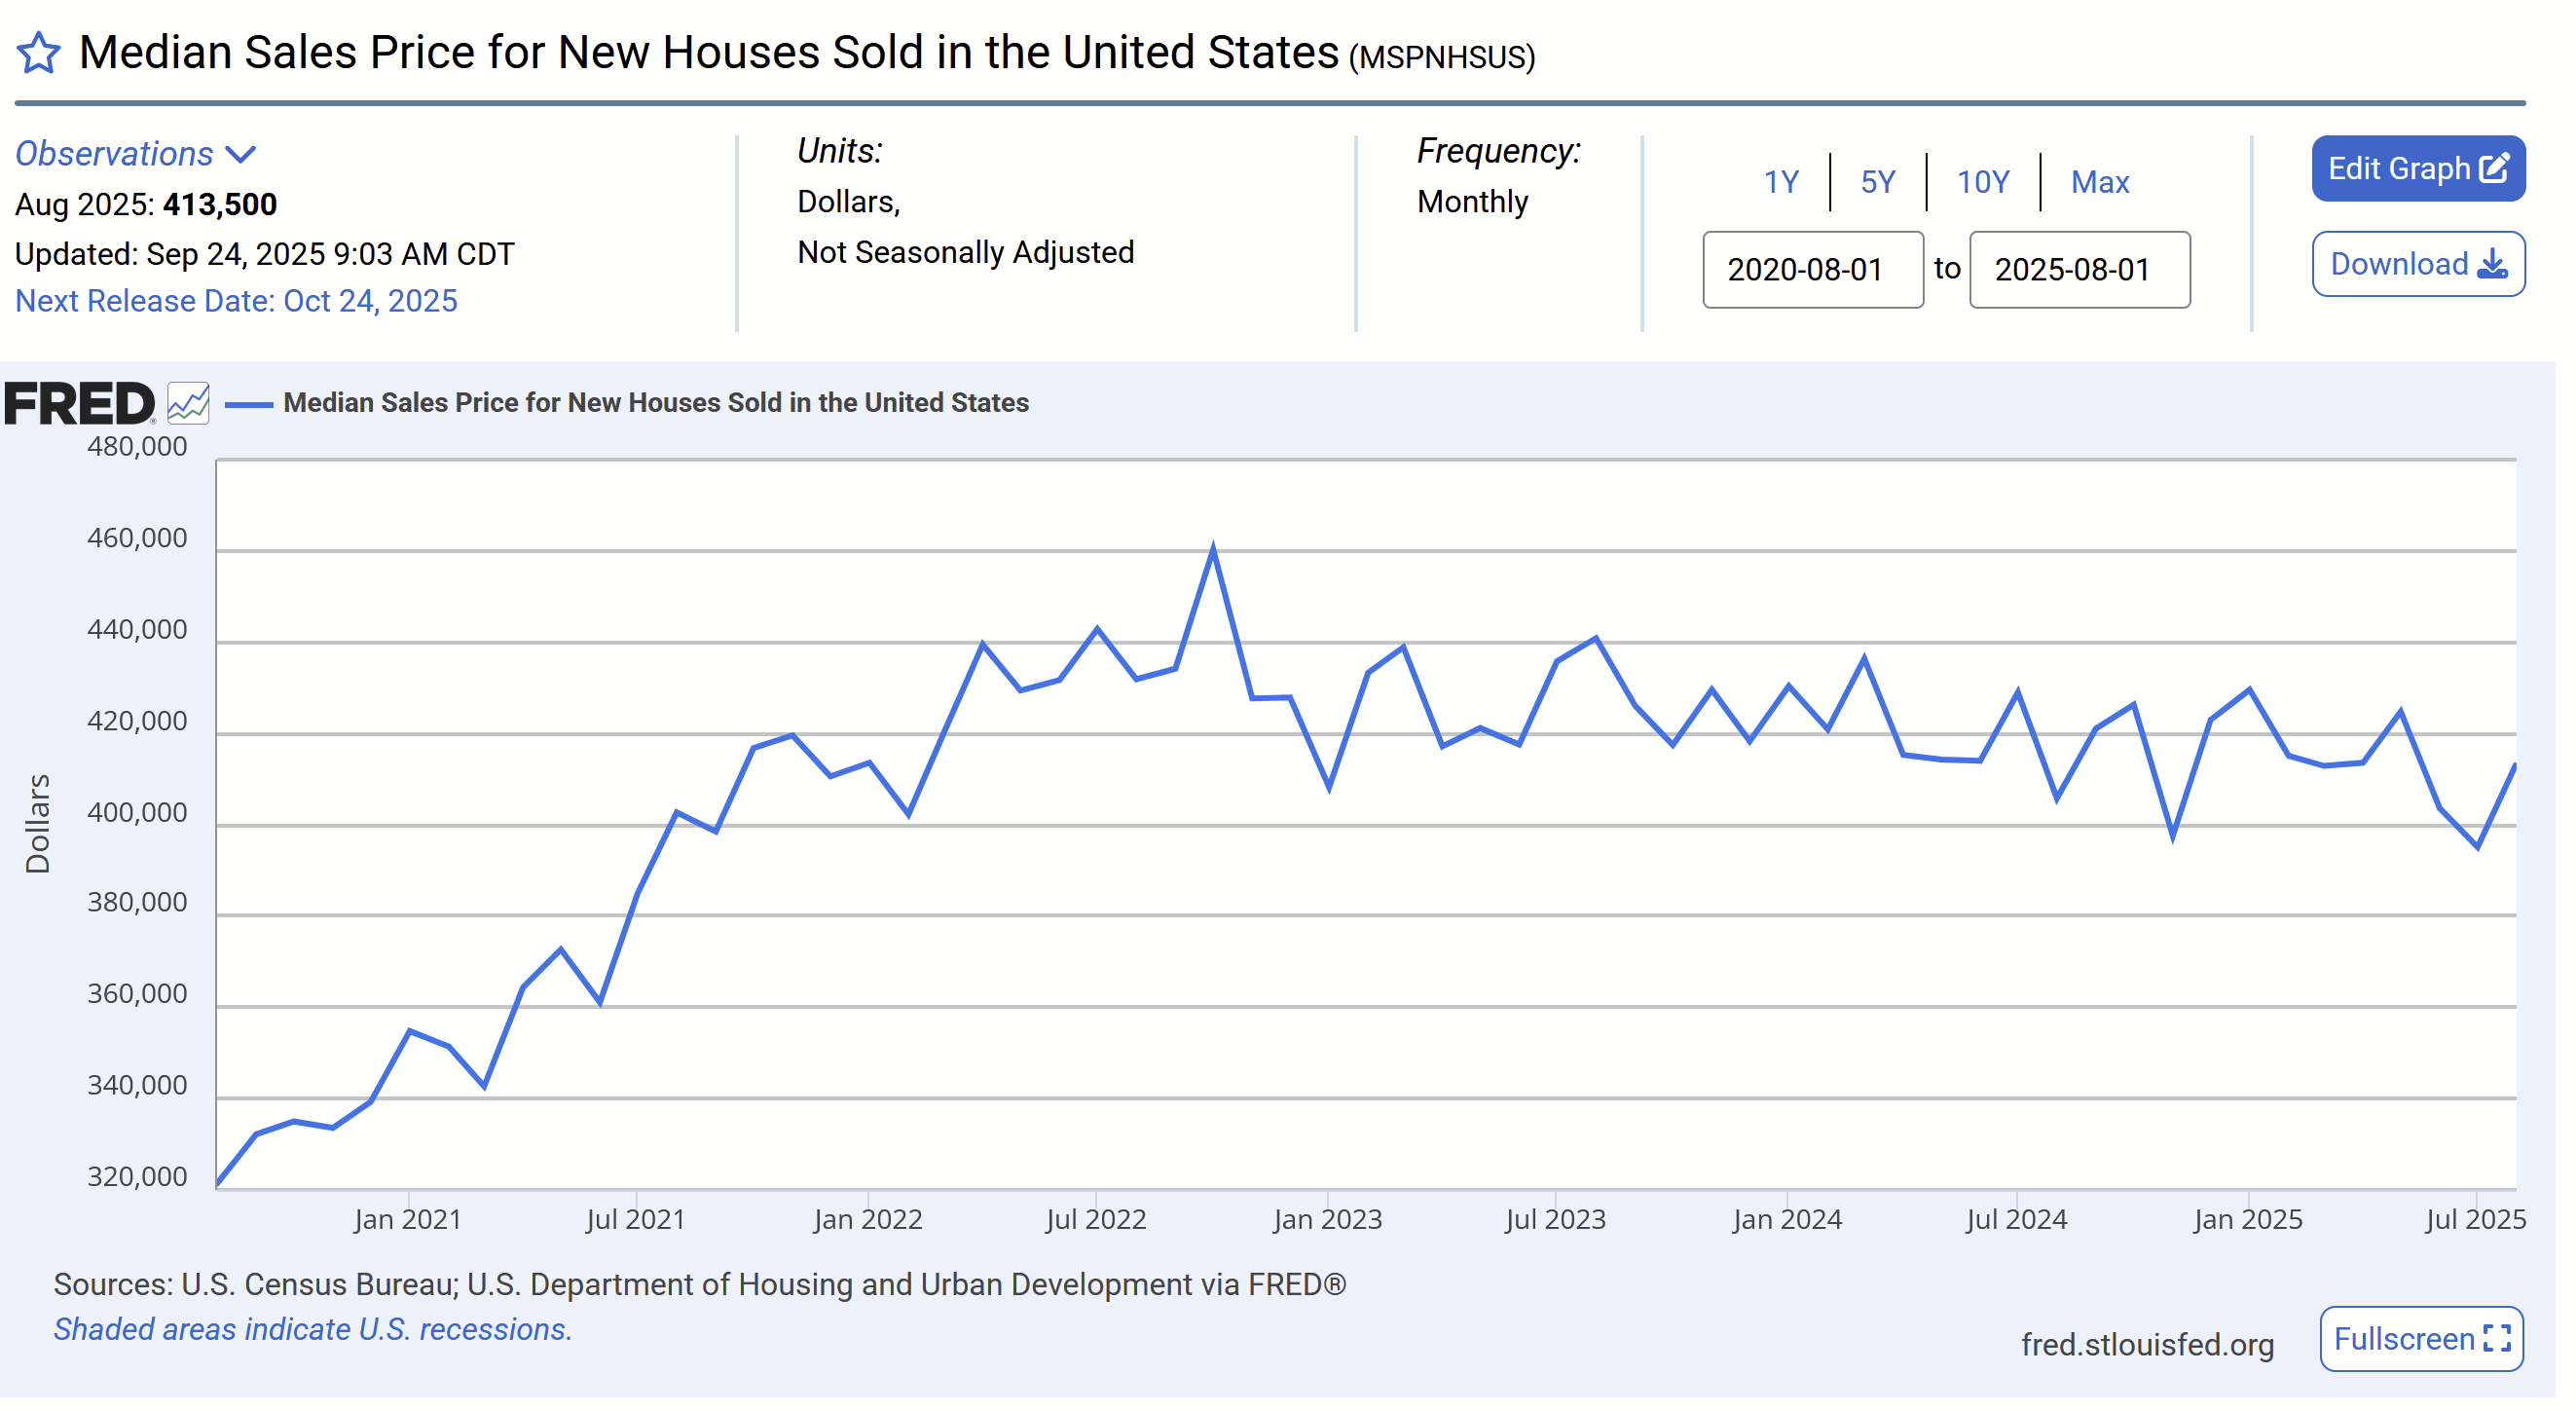
Even though the monthly high price in November 2022 for all purchase types was $496,500 median sales price.
Just a reminder, Lennar is so large, they make up the same footprint in sales as the 3rd, 4th, 5th and 6th largest builders in the United States. (Pulte, NVR, Meritage, KB Homes) by themselves.
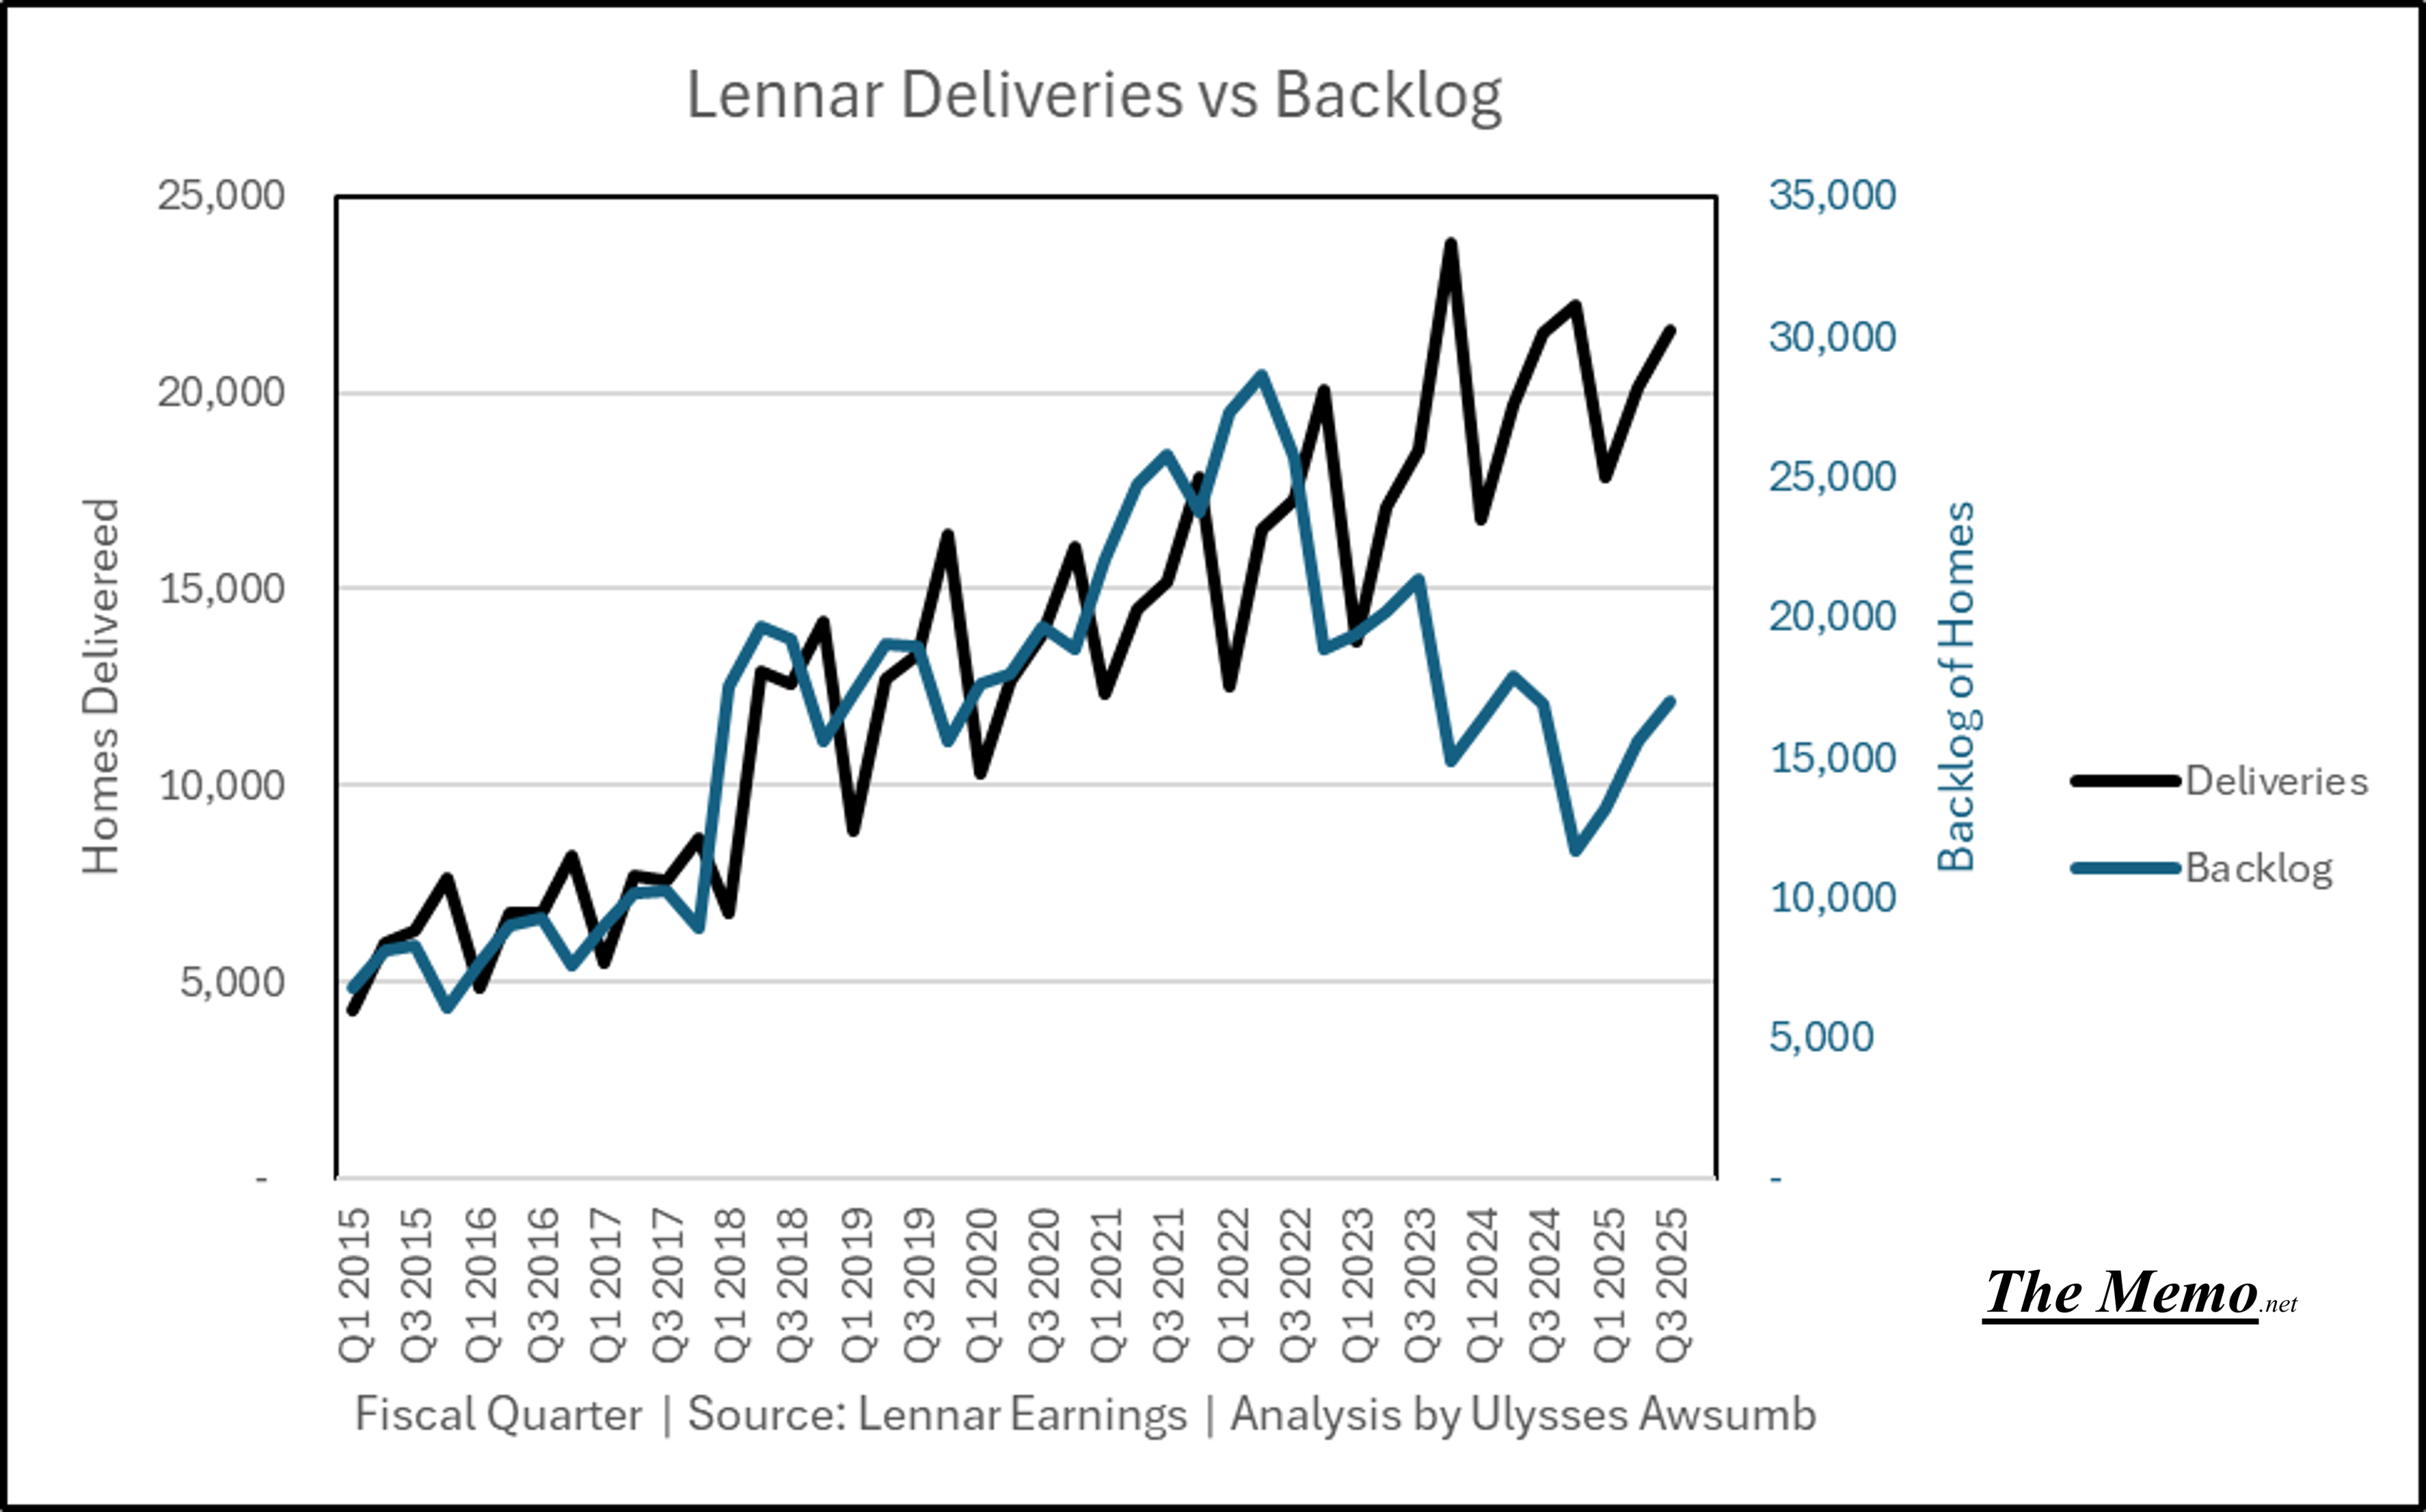
Nevermind the 12 months of “units for sale” revisions to stay within that 490-505k range, despite Lennar’s deliveries being “Up and to the right”.
Nevermind the publicly acknowledged previously shared here “incentive wars” ongoing by builders.
Nope, today, the analysts question August being a strong sales month. I guess they’re all just looking at the pavement in front of the hood.

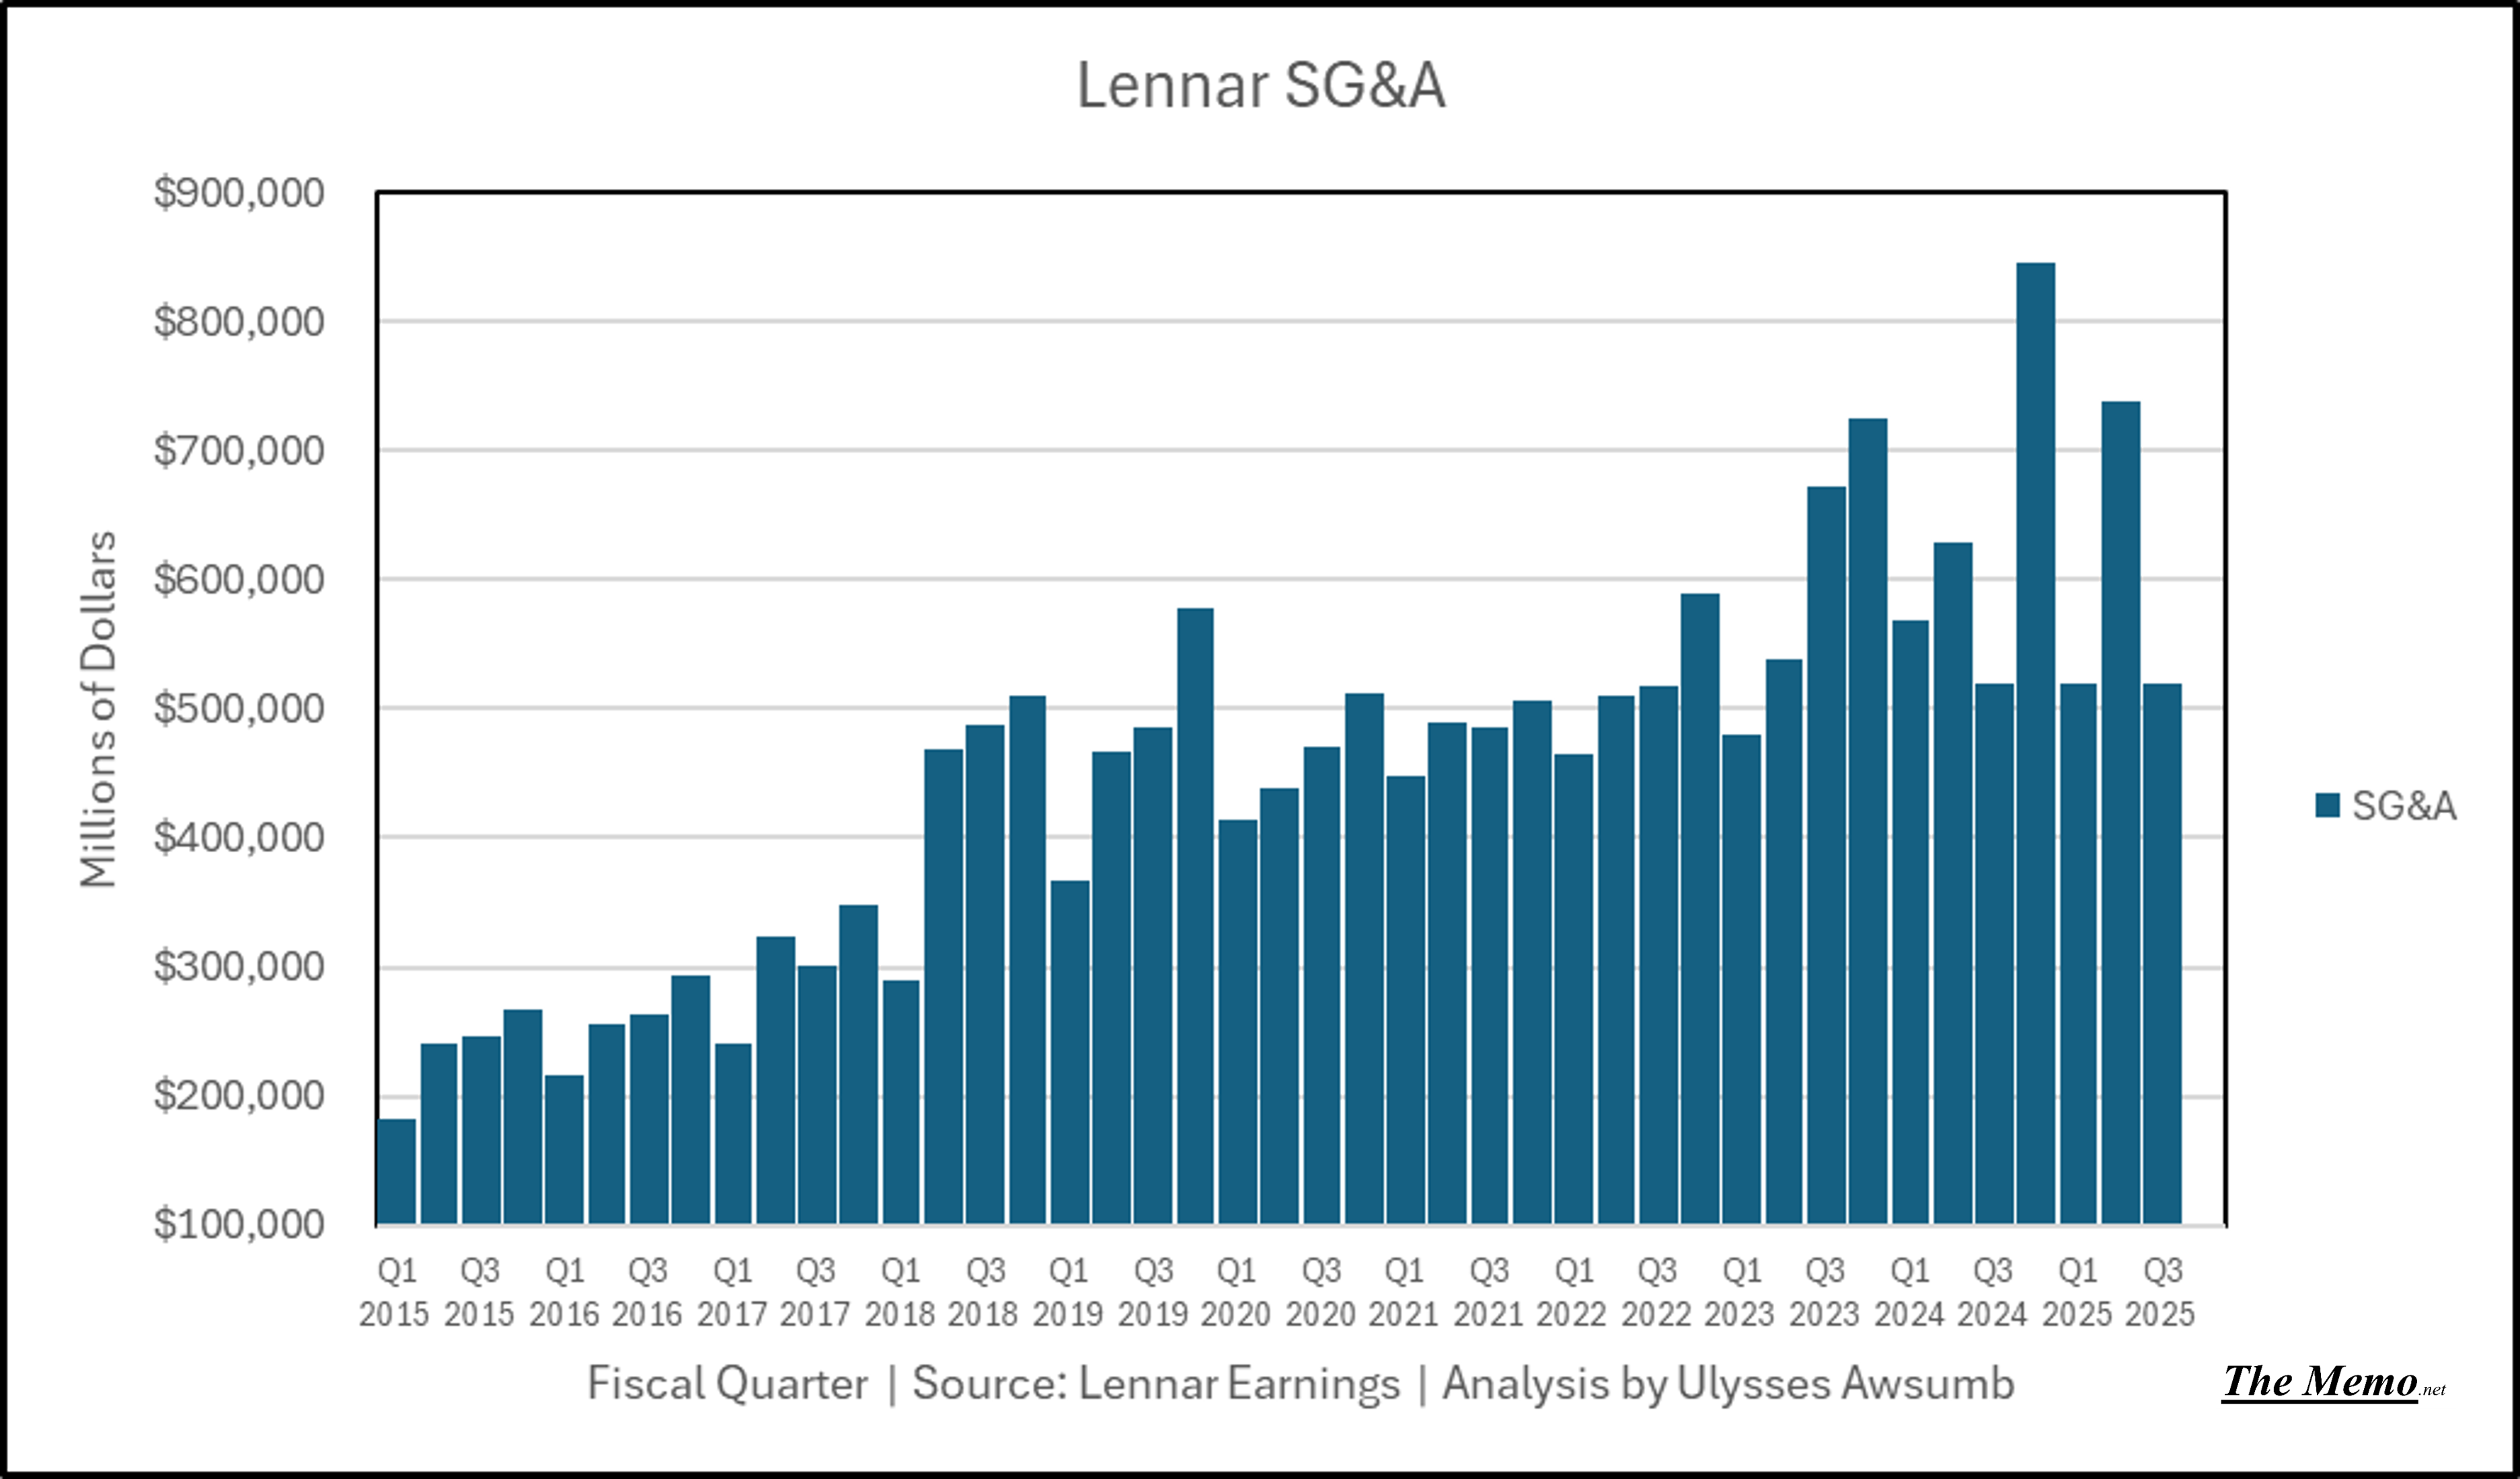
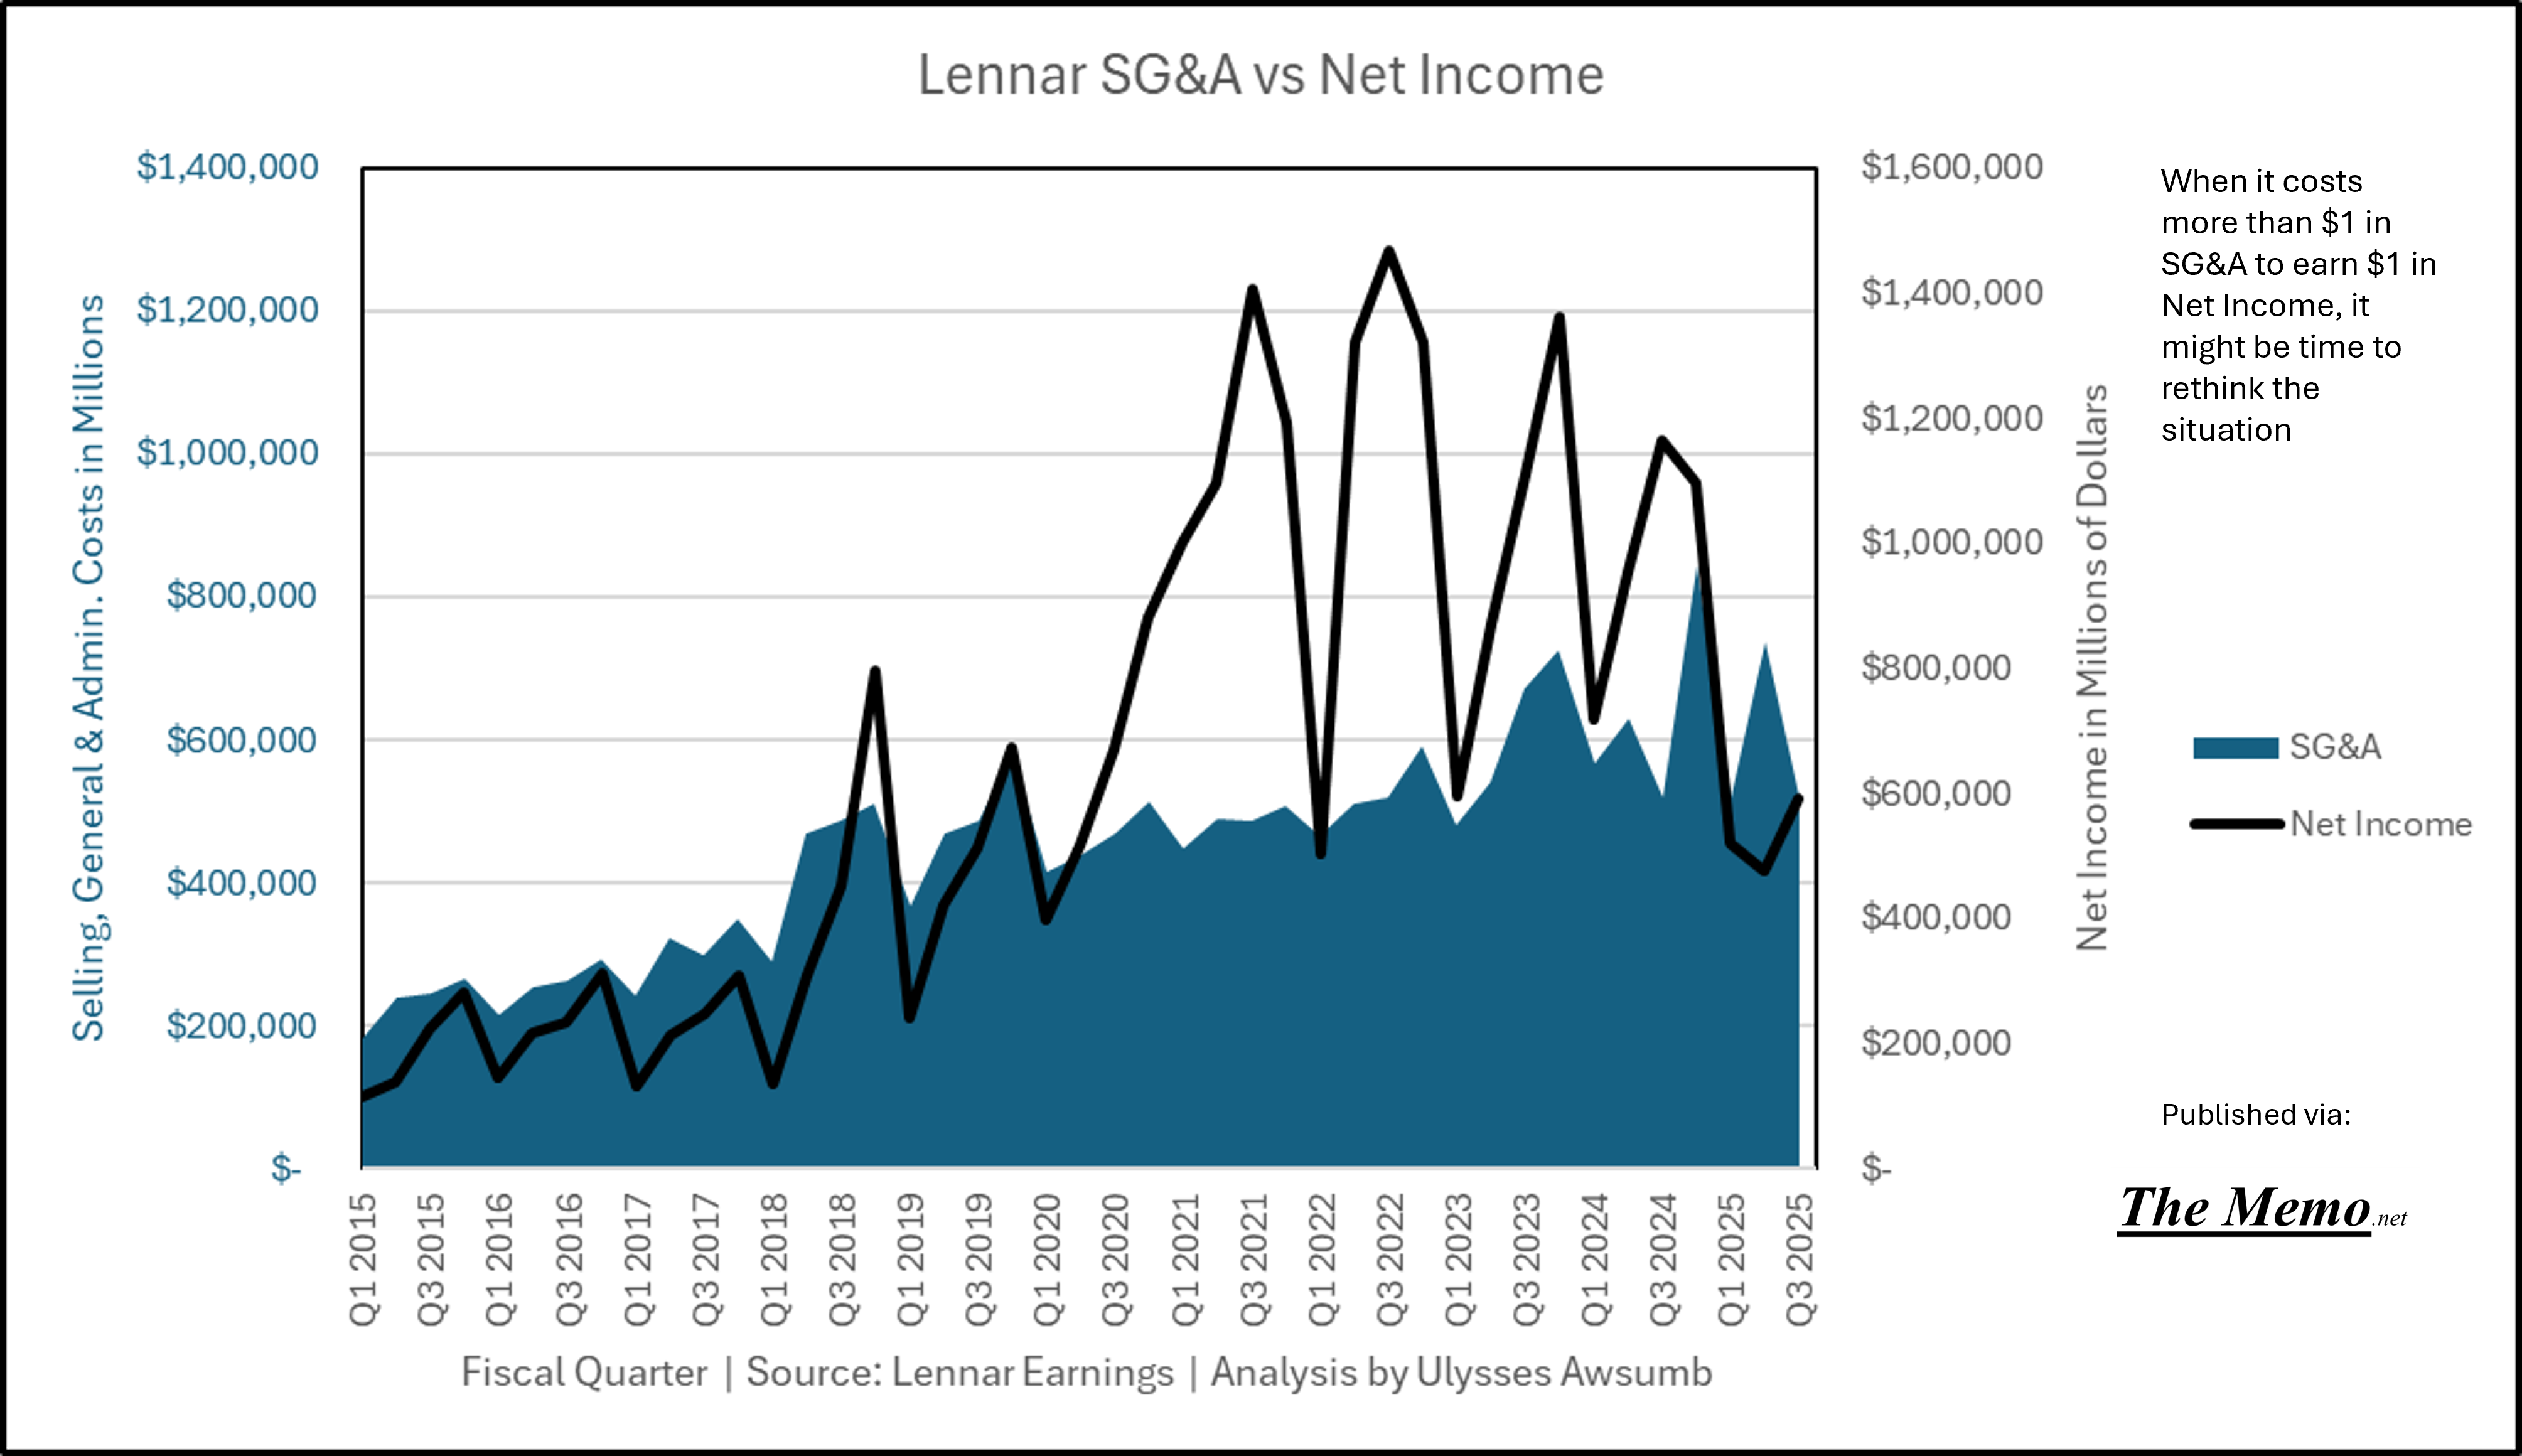
They probably also missed that Lennar has officially eclipsed the > $1 in SG&A Cost for every $1 in Net Income Earned bit too.
Which means they definitely lost the plot after telling me “The debt load is great” while Lennar went from net positive Cash and Cash Equivalents to net negative vs their Debt.

The same people tell me that “Opendoor” has gone parabolic in recent weeks.
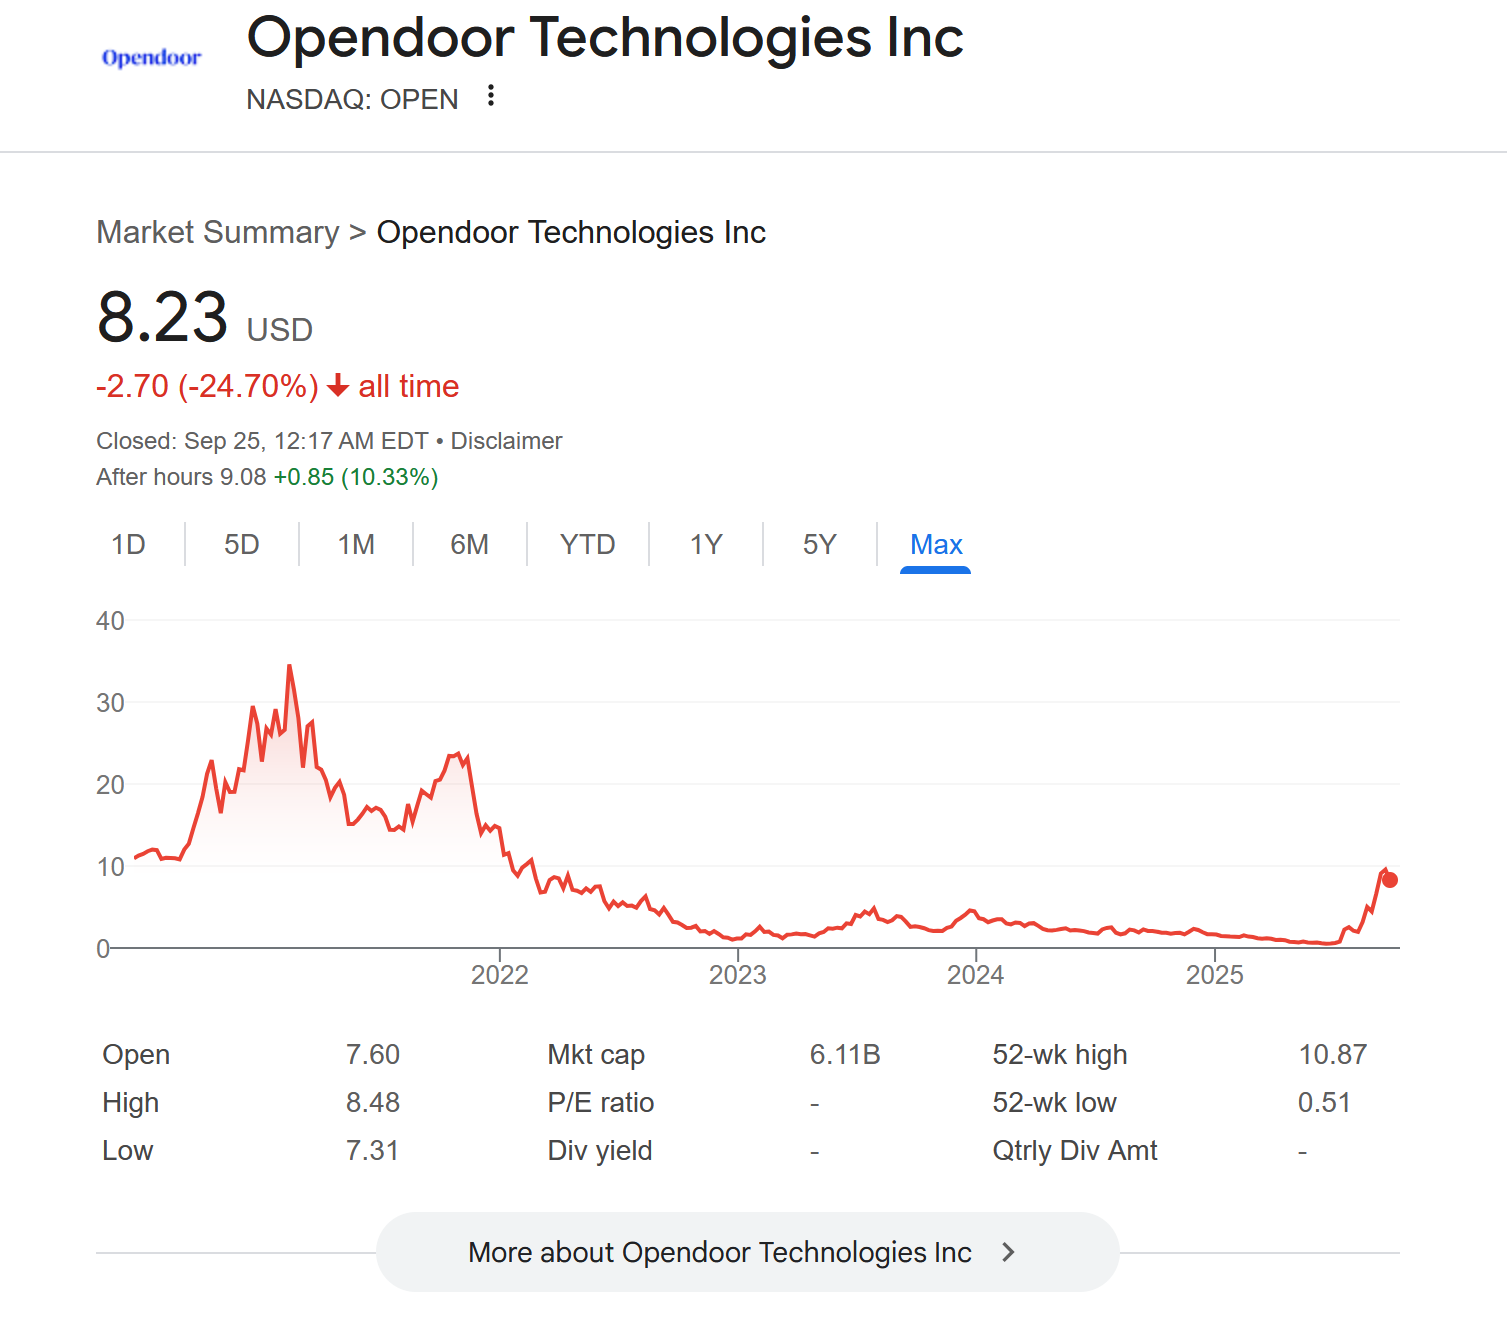
If they say so. Speaking of which, Lennar was an early investor in OPEN 0.00%↑
What’s Opendoor you ask?

All of which means:
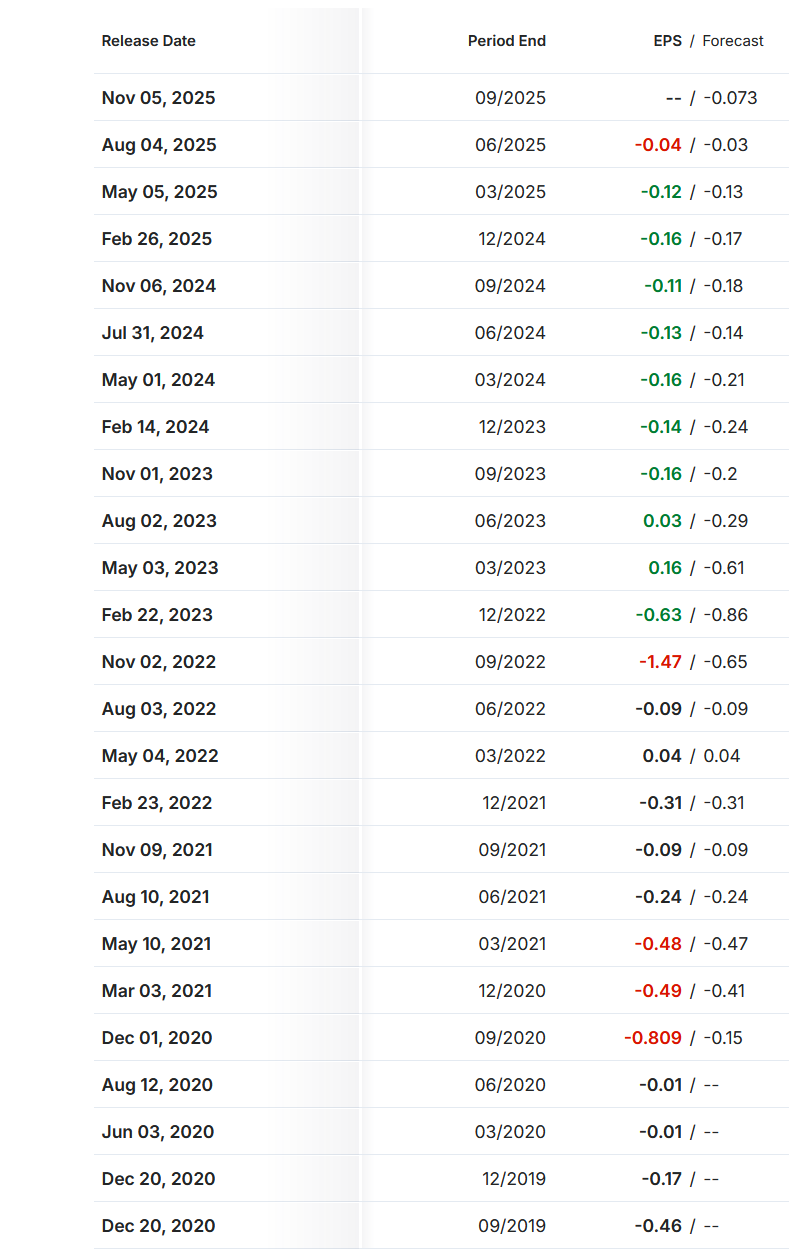
They’ve lost money every quarter of their existence, save for 2 quarters. Someone get them a string, tape measure and a notepad. Plumb, flush and level.
Then again, Lennar benefits from “technology” company investments losing money, to reduce tax burdens. While they have them.
While Lennar and “NAHB” sentiment continue to plummet, I look forward to seeing what the industrious smaller builders, local developers, and bigger hungry builders do in the coming months.
And don’t shed a tear for Lennar, even if their worst is yet to come. They’ll be fine. The Situation just improved, even if the “consensus” says otherwise and even if temporarily. The last time the situation improved by this much, was April 2008. Remember, the improvement comes from stopping that which makes the situation unhealthy.
For those who proscribe to “consensus” housing data, “The beatings will continue until moral improves”
Build your own path.
I want to express my gratitude, on this occasion to the people who helped make this anniversary possible, you know who you are.
And a very special thank you to the 1k+ readers here.
A note: The Federal Reserve Federal Funds Effective Rate does not set mortgage rate targets.
The research and method for the index can be found here: US Property Services
Charts
Sources:
US Census Bureau: Survey of Construction; New Residential Sales
Lennar Public Earnings, 10-Q/Press Releases/Quarterly Presentations
US Property Services (All Rights Reserved)
Analysis by Ulysses Awsumb