

Real Estate Roundup
1/3rd Gone

The Memo:
To:
Everyone
Re:
Publicly Traded Homebuilder Stocks
1 Inter Department Directive
Comments:
Tonight’s roundup is mostly charts, with expalanations and one topic that seems to be flying under the radar. Mostly because I think the charts speak for themselves.
In the last 26 weeks (most coming since October), the 20 largest publicly traded Homebuilder’s share prices have fallen by an everage of 33%. 1/3rd. That isn’t a typo.
By the numbers:
$81 Billion in share value wiped out
Smallest Value loss: 15%
Largest Value Loss: 49%
Smallest Value lost on a Per Home Closed basis: $59,074
Largest Value lost on a Per Home Closed basis: $971k +
Average share value lost per home closed: $254,435
20 Largest Builders represent 2,457,000,000+ Total Shares Outstanding
20 Largest Builders represent > 330,755 Homes Closed
20 Largest Builders represent > 49% of New Homes Sold
Read on for more.
Sincerely,

“We’re not buying a lot of stock back at these prices” -Jamie Dimon
End Memo
Attachments
Share Price change over 26 Weeks as a percentage.

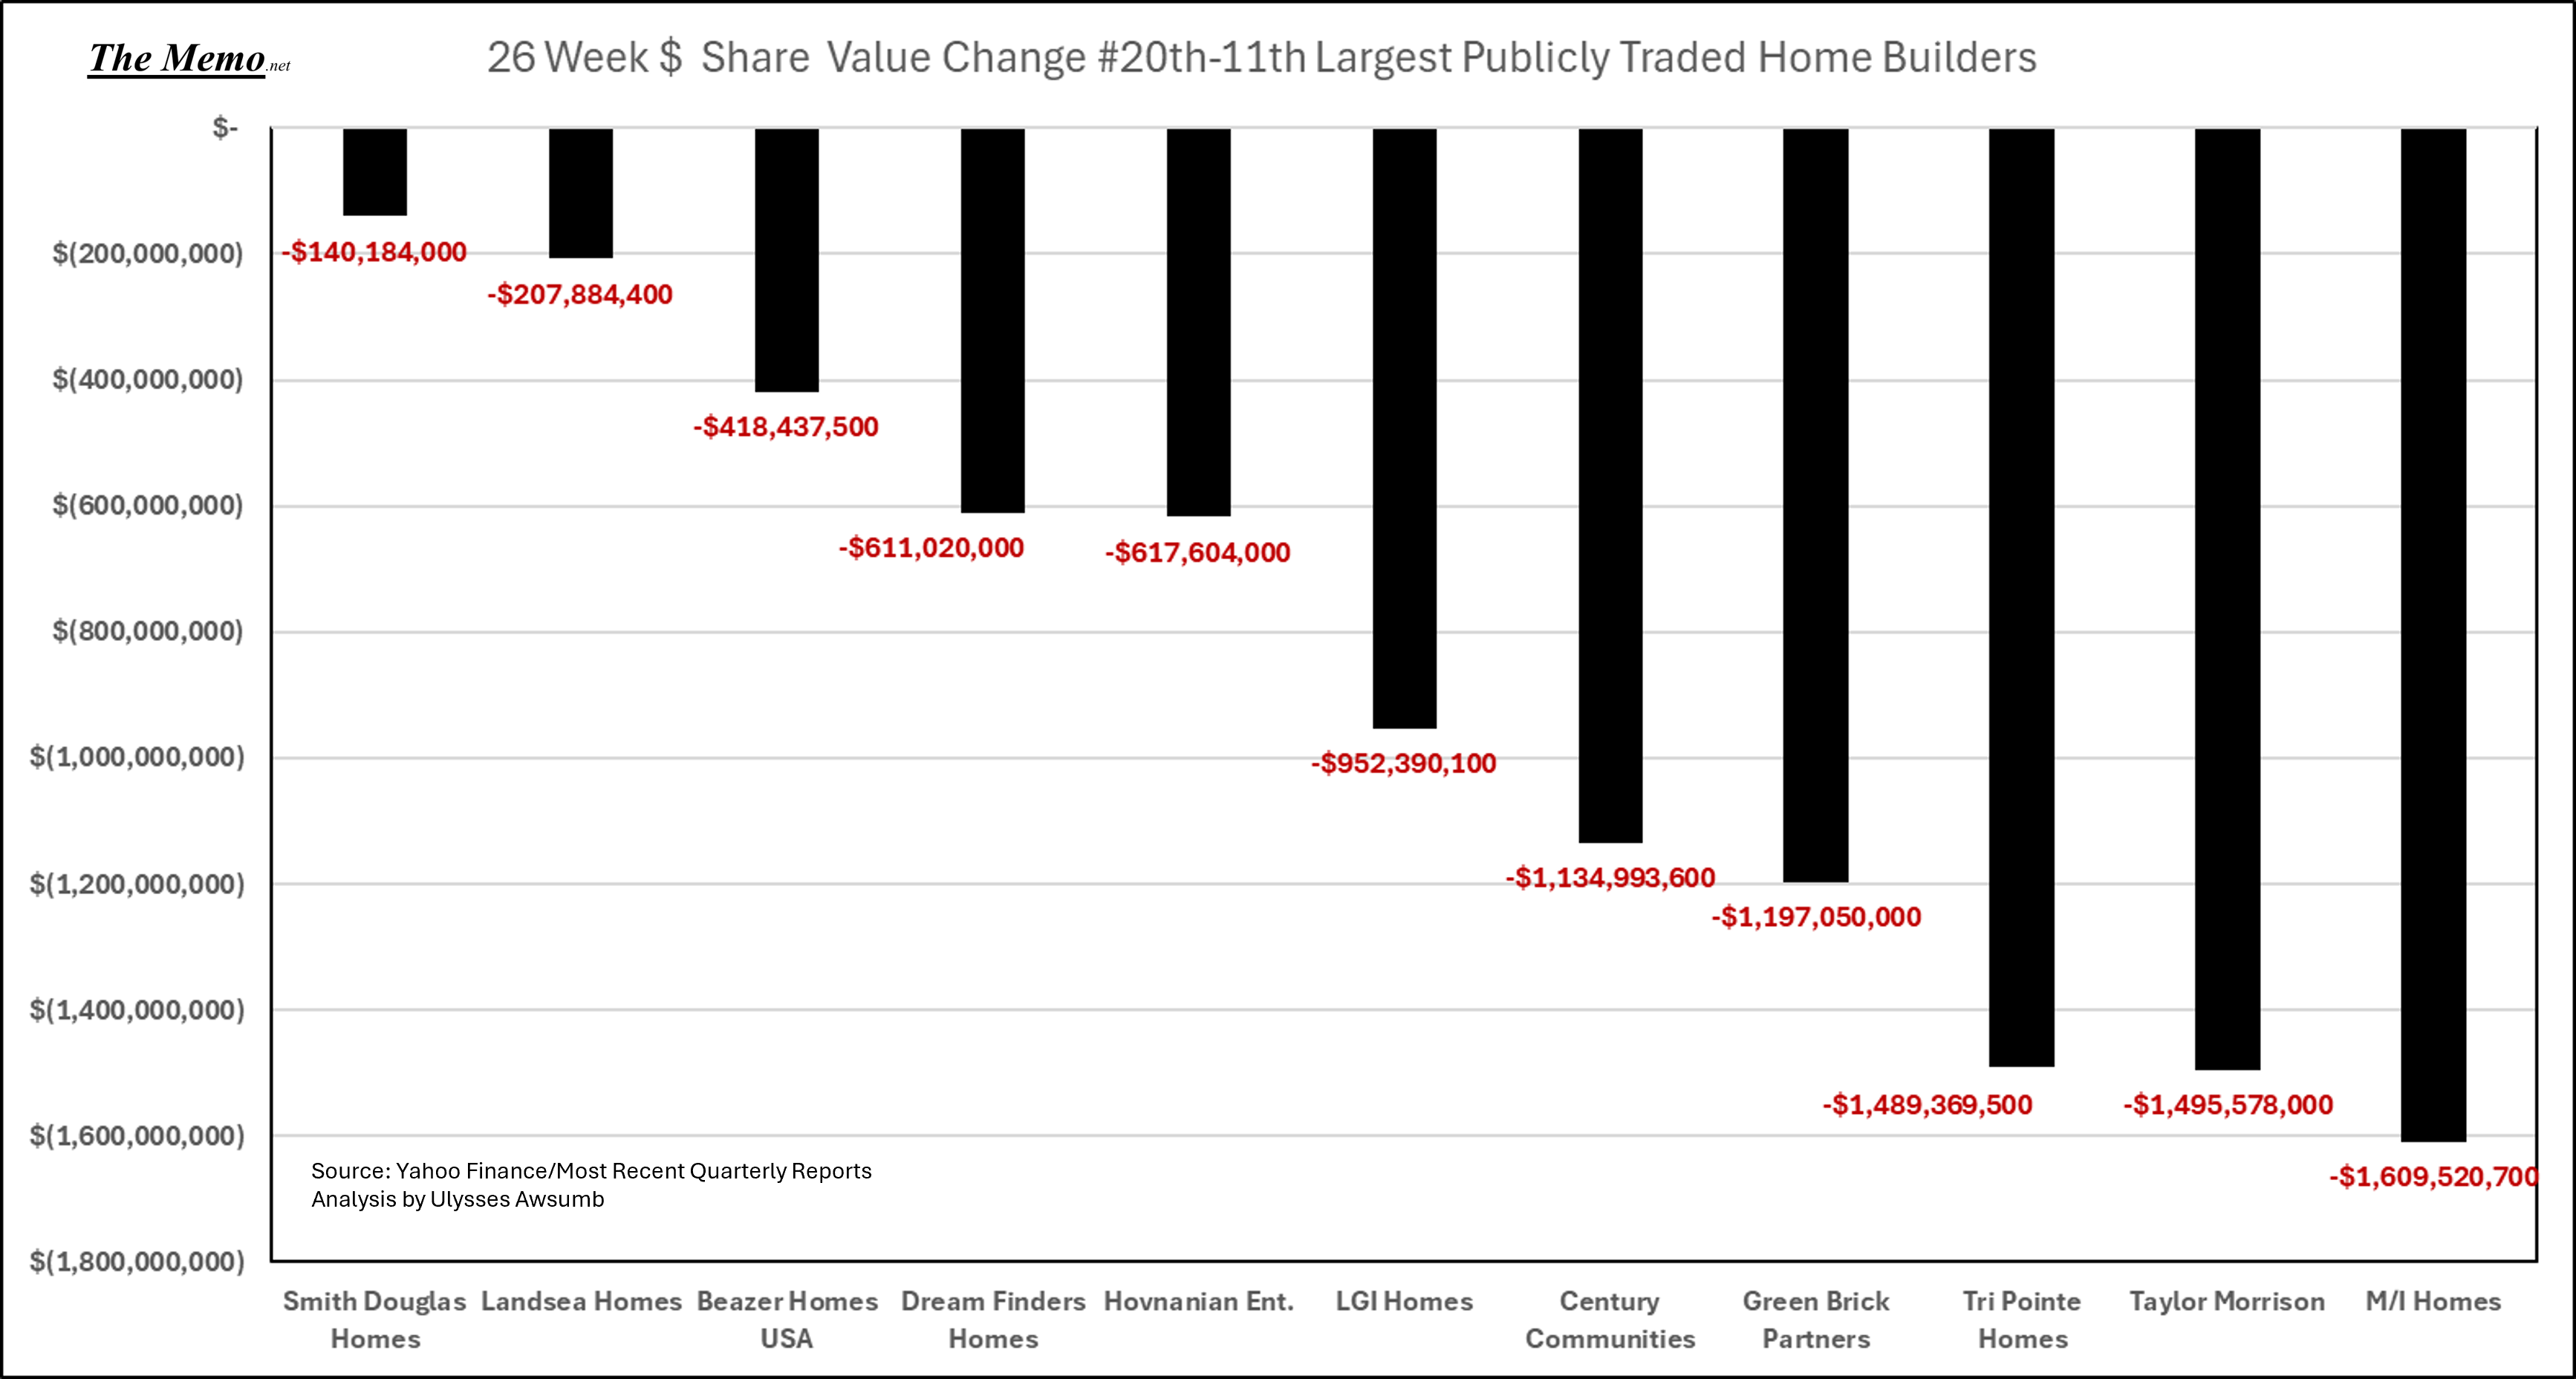
Total Value lost: Calculated by 26 Week Share Price high, minus current Share Price (as of Friday 2/21/25 close) against Total Outsanding Shares of each individual builder.
11-20th Largest (by sales):
5th-9th Largest:

1st-4th Largest(>$50B alone):

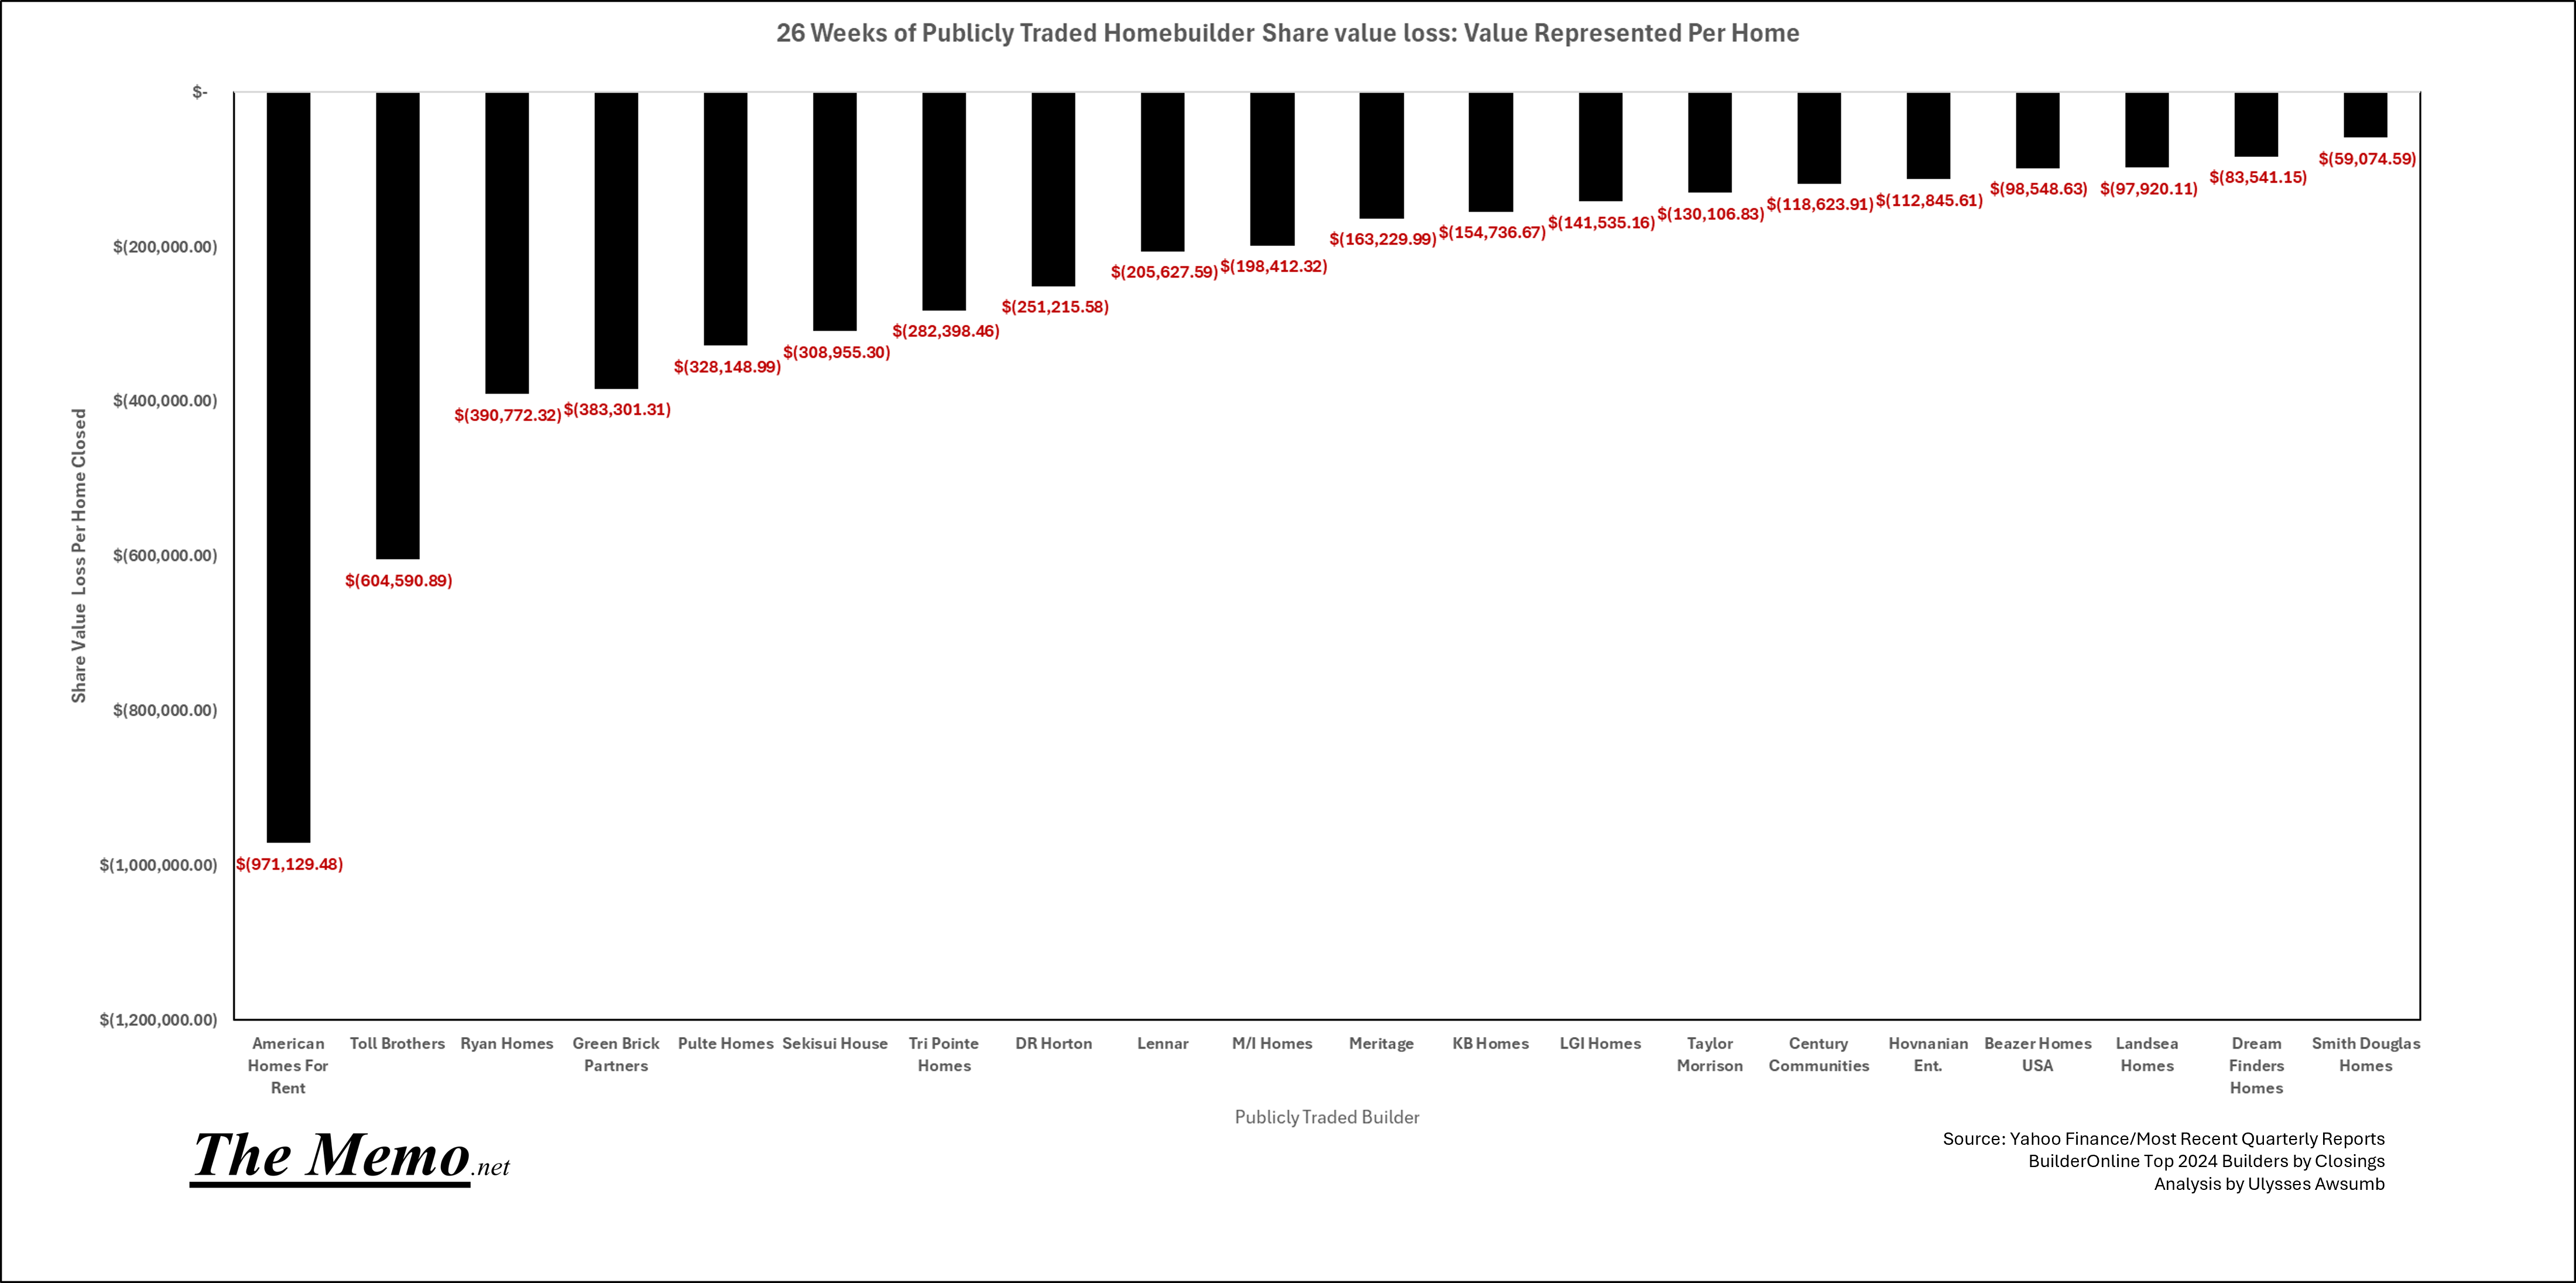
Using BuilderOnline’s tally of Top 100 2024 Builders by Homes Closed, I wanted to see what the value loss looked like on a per home sold basis. Since, you know, they’re in the business of selling homes. This is against 2023 calendar year closings, so the actual figures will be slightly different, and I included M.D.C. closings in Sekisui House as they merged in the spring. That being said, I still find the exercise useful and will be updating with 24 calendar year not fiscal reporting year closings.

And the loss as a percent of the average sale price.

Something I find very interesting: $AMH; smallest % share value drop at 15%, but largest per home closed loss (built to rent sale).
Inter Department Directive:
To:
Finance Department.
Please be sure to apply some analysis framework to when we issue share buybacks. Especially when our SG&A has gone nowhere but up for two straight years. This isn’t our first rodeo.
Ivy Zelman is even adding to the commentary regarding headwinds.