Memorandum of Debt
An Unwholesome EFFing Memo: Whole Loans

The Memo:
To:
The Team
Re:
Mortgages, Monies, Employement and Taxes.
And Today in EFFing time in the Middel East/U.S. relations.
Comments:
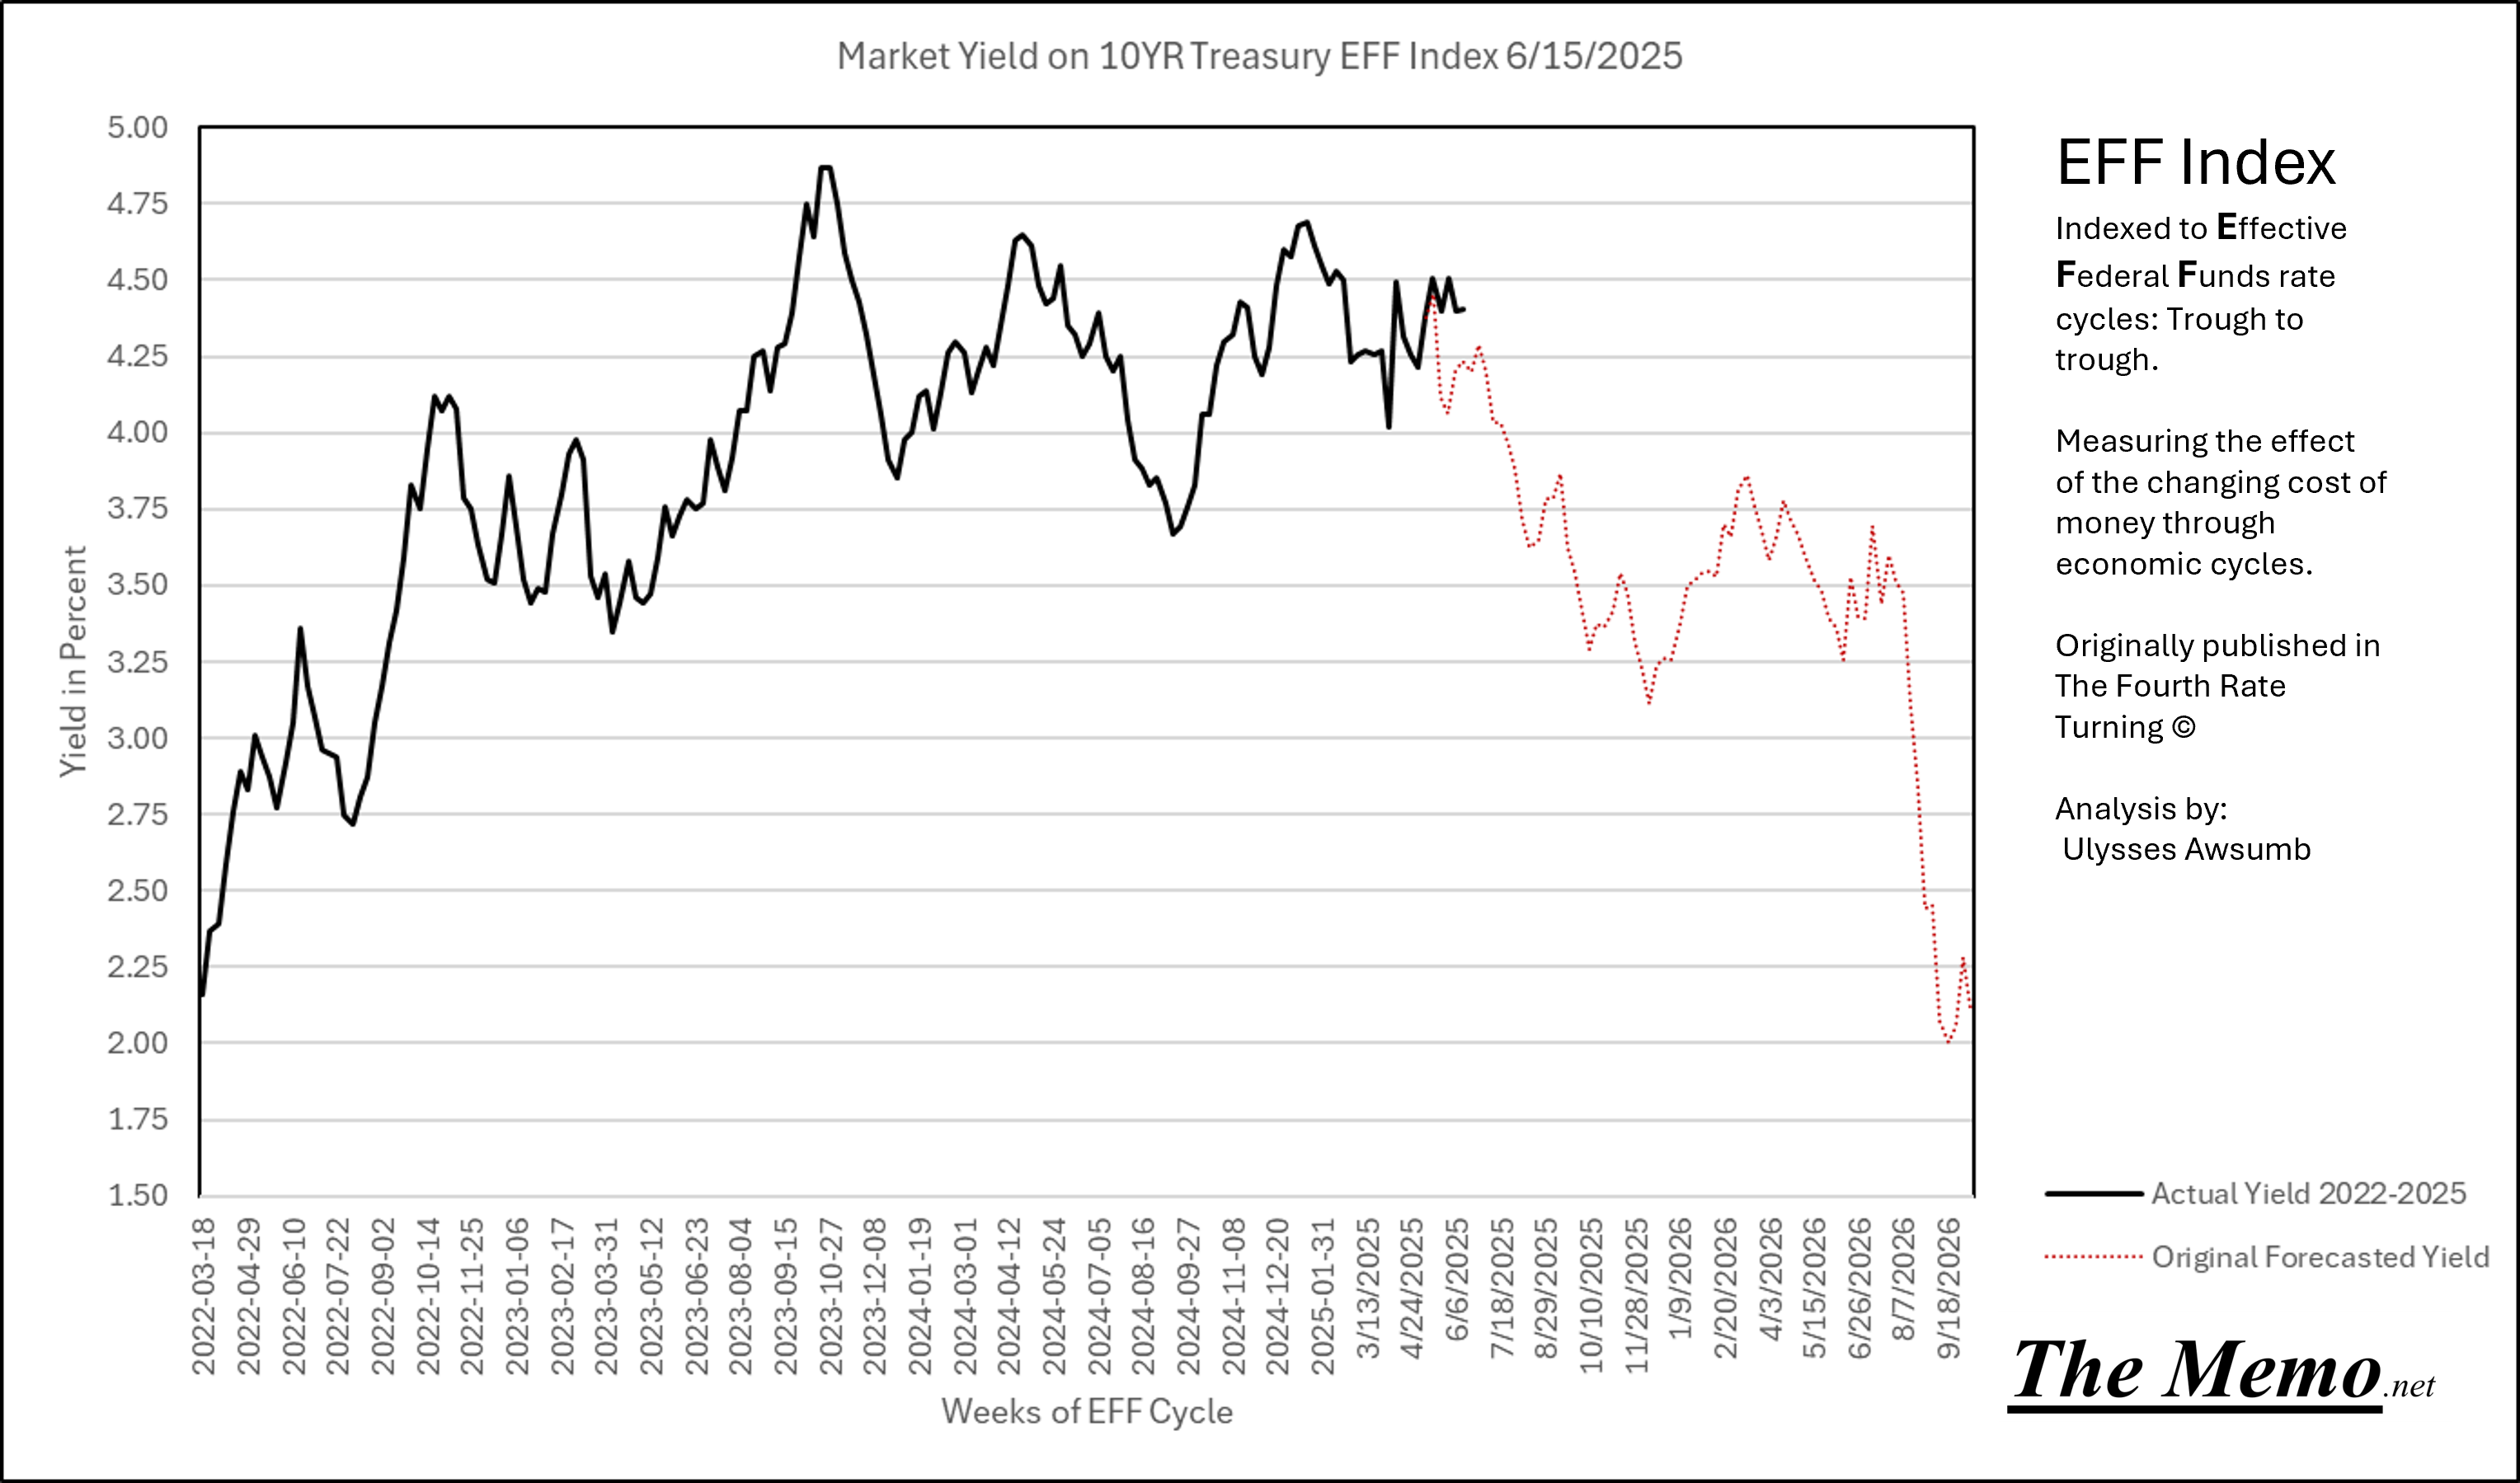
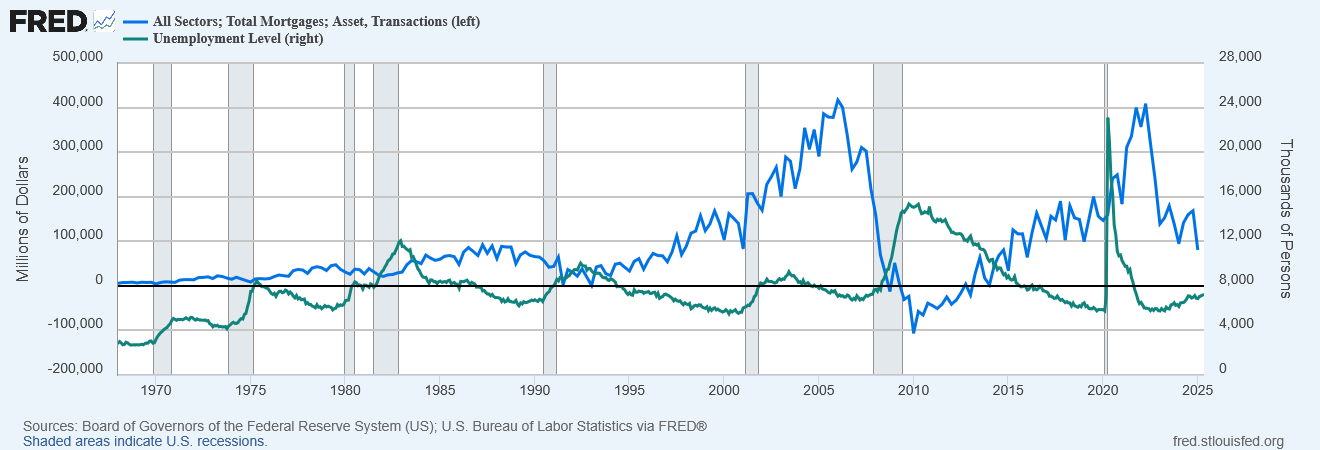
The Federal Reserve on Thursday published its quarterly updates of the Z.1 Financial Accounts of The United States, which included the latest backward looking quarter of Mortage Asset Transactions. These being the value of overall whole loan transactions, including originations and write downs.
I track these because they are paramount importance to the United States economic picture.
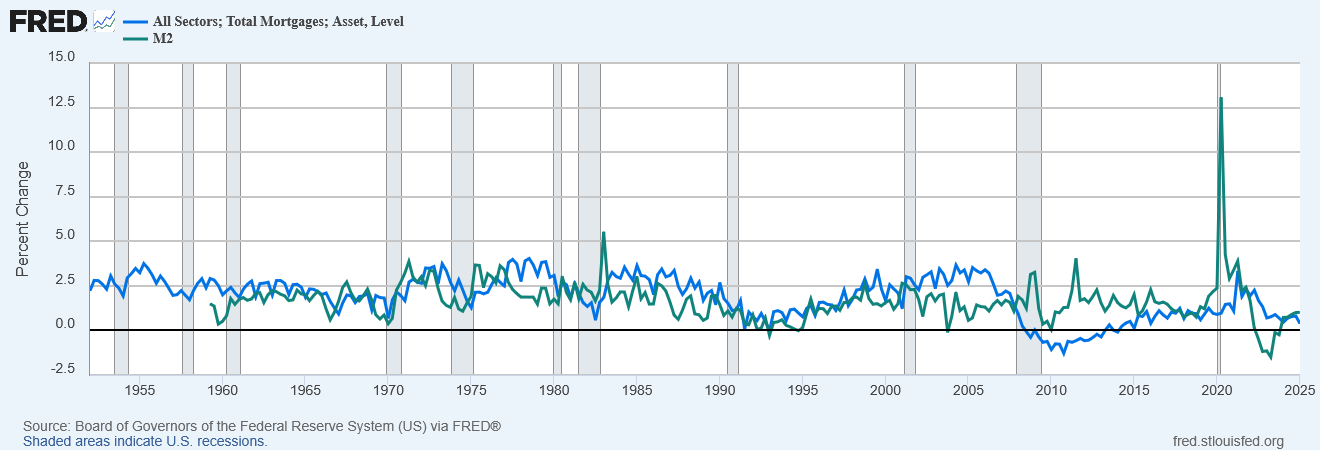
Below is the overall total econompassing picture of all sectors of mortage asset transactions.
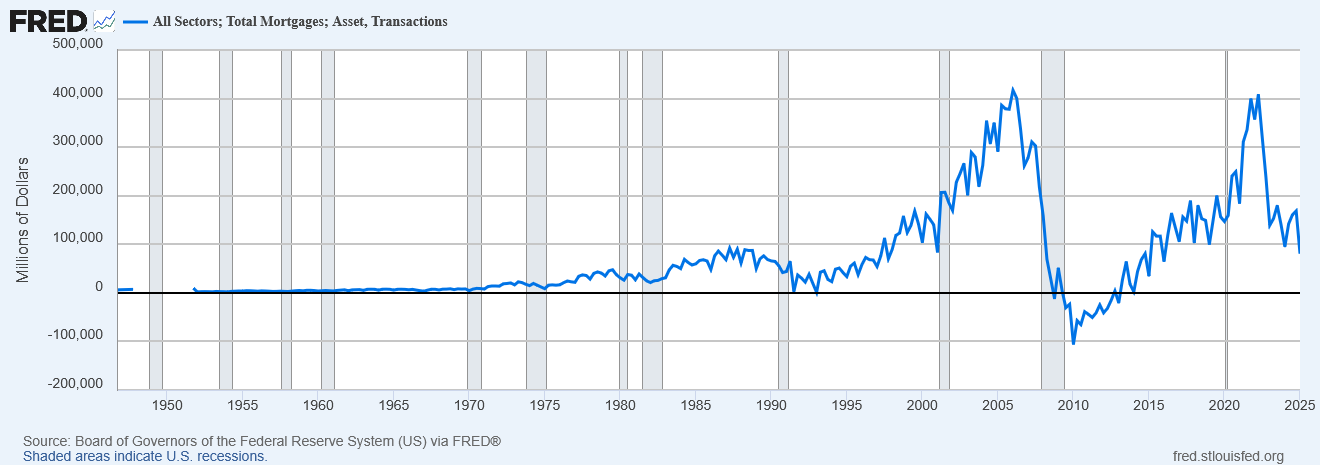
Though these represent whole loan values, this is an unwholesome view of the real situation facing the U.S., those who want and need dollars, and despite it showing things have deteriorated again to levels pre Silverbank/Bank Term Funding Program situation, it also represents the myth of The Big Short. Which is as inaccurate a portrait of American Real Estate and Bank Lending as one can paint, despite it being fantastic film.
But that’s the magic of the movies. You see the product polished, rather than it’s painstaking realities of take by take, cut by cut work to deliver the final film.
The “GFC” was not the only time real estate assets were destroyed. We are not at that stage. Yet.

End Memo.
All Sectors may not be equal
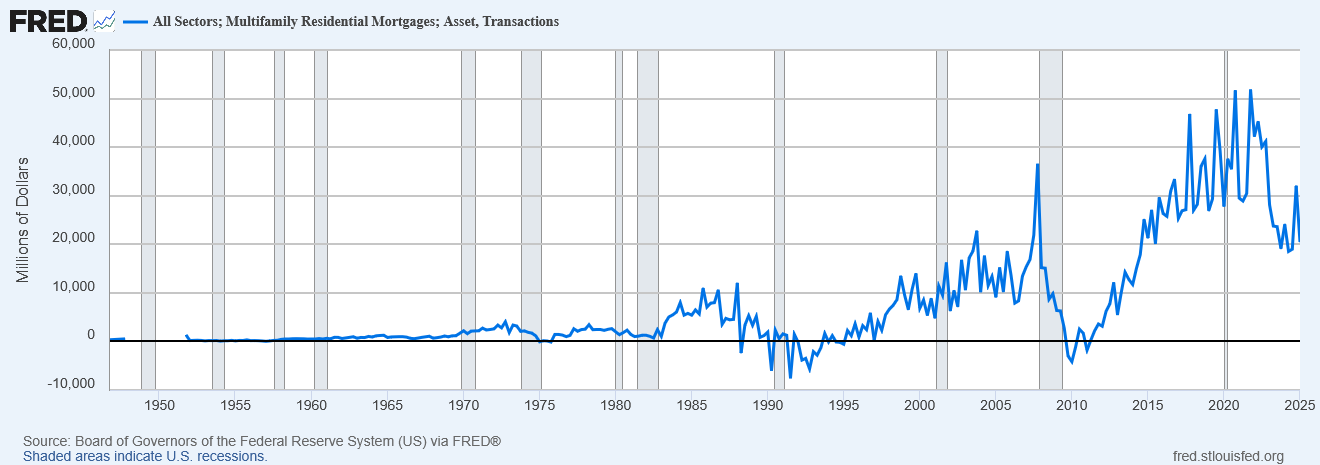
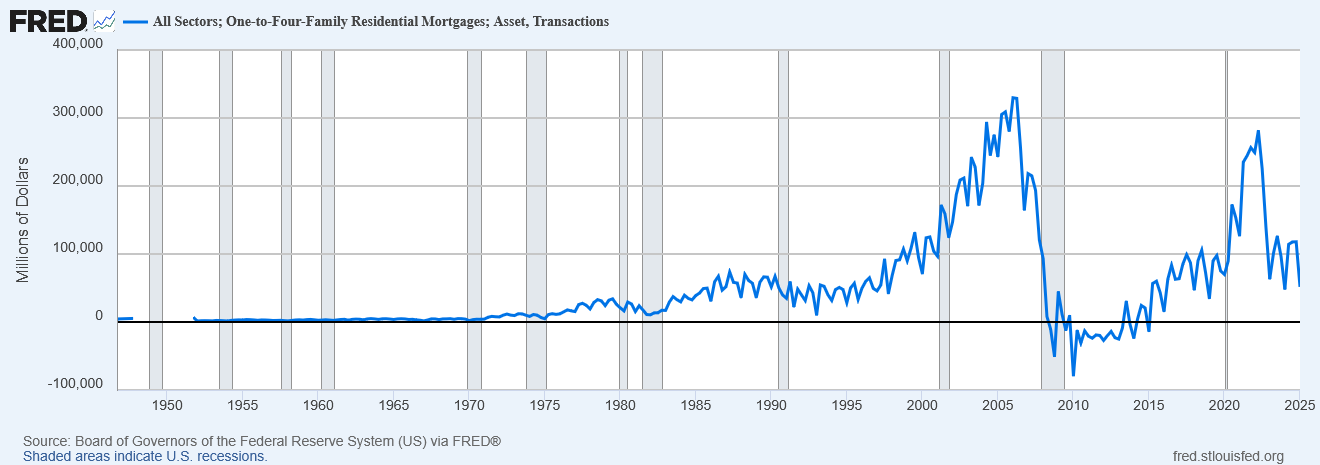
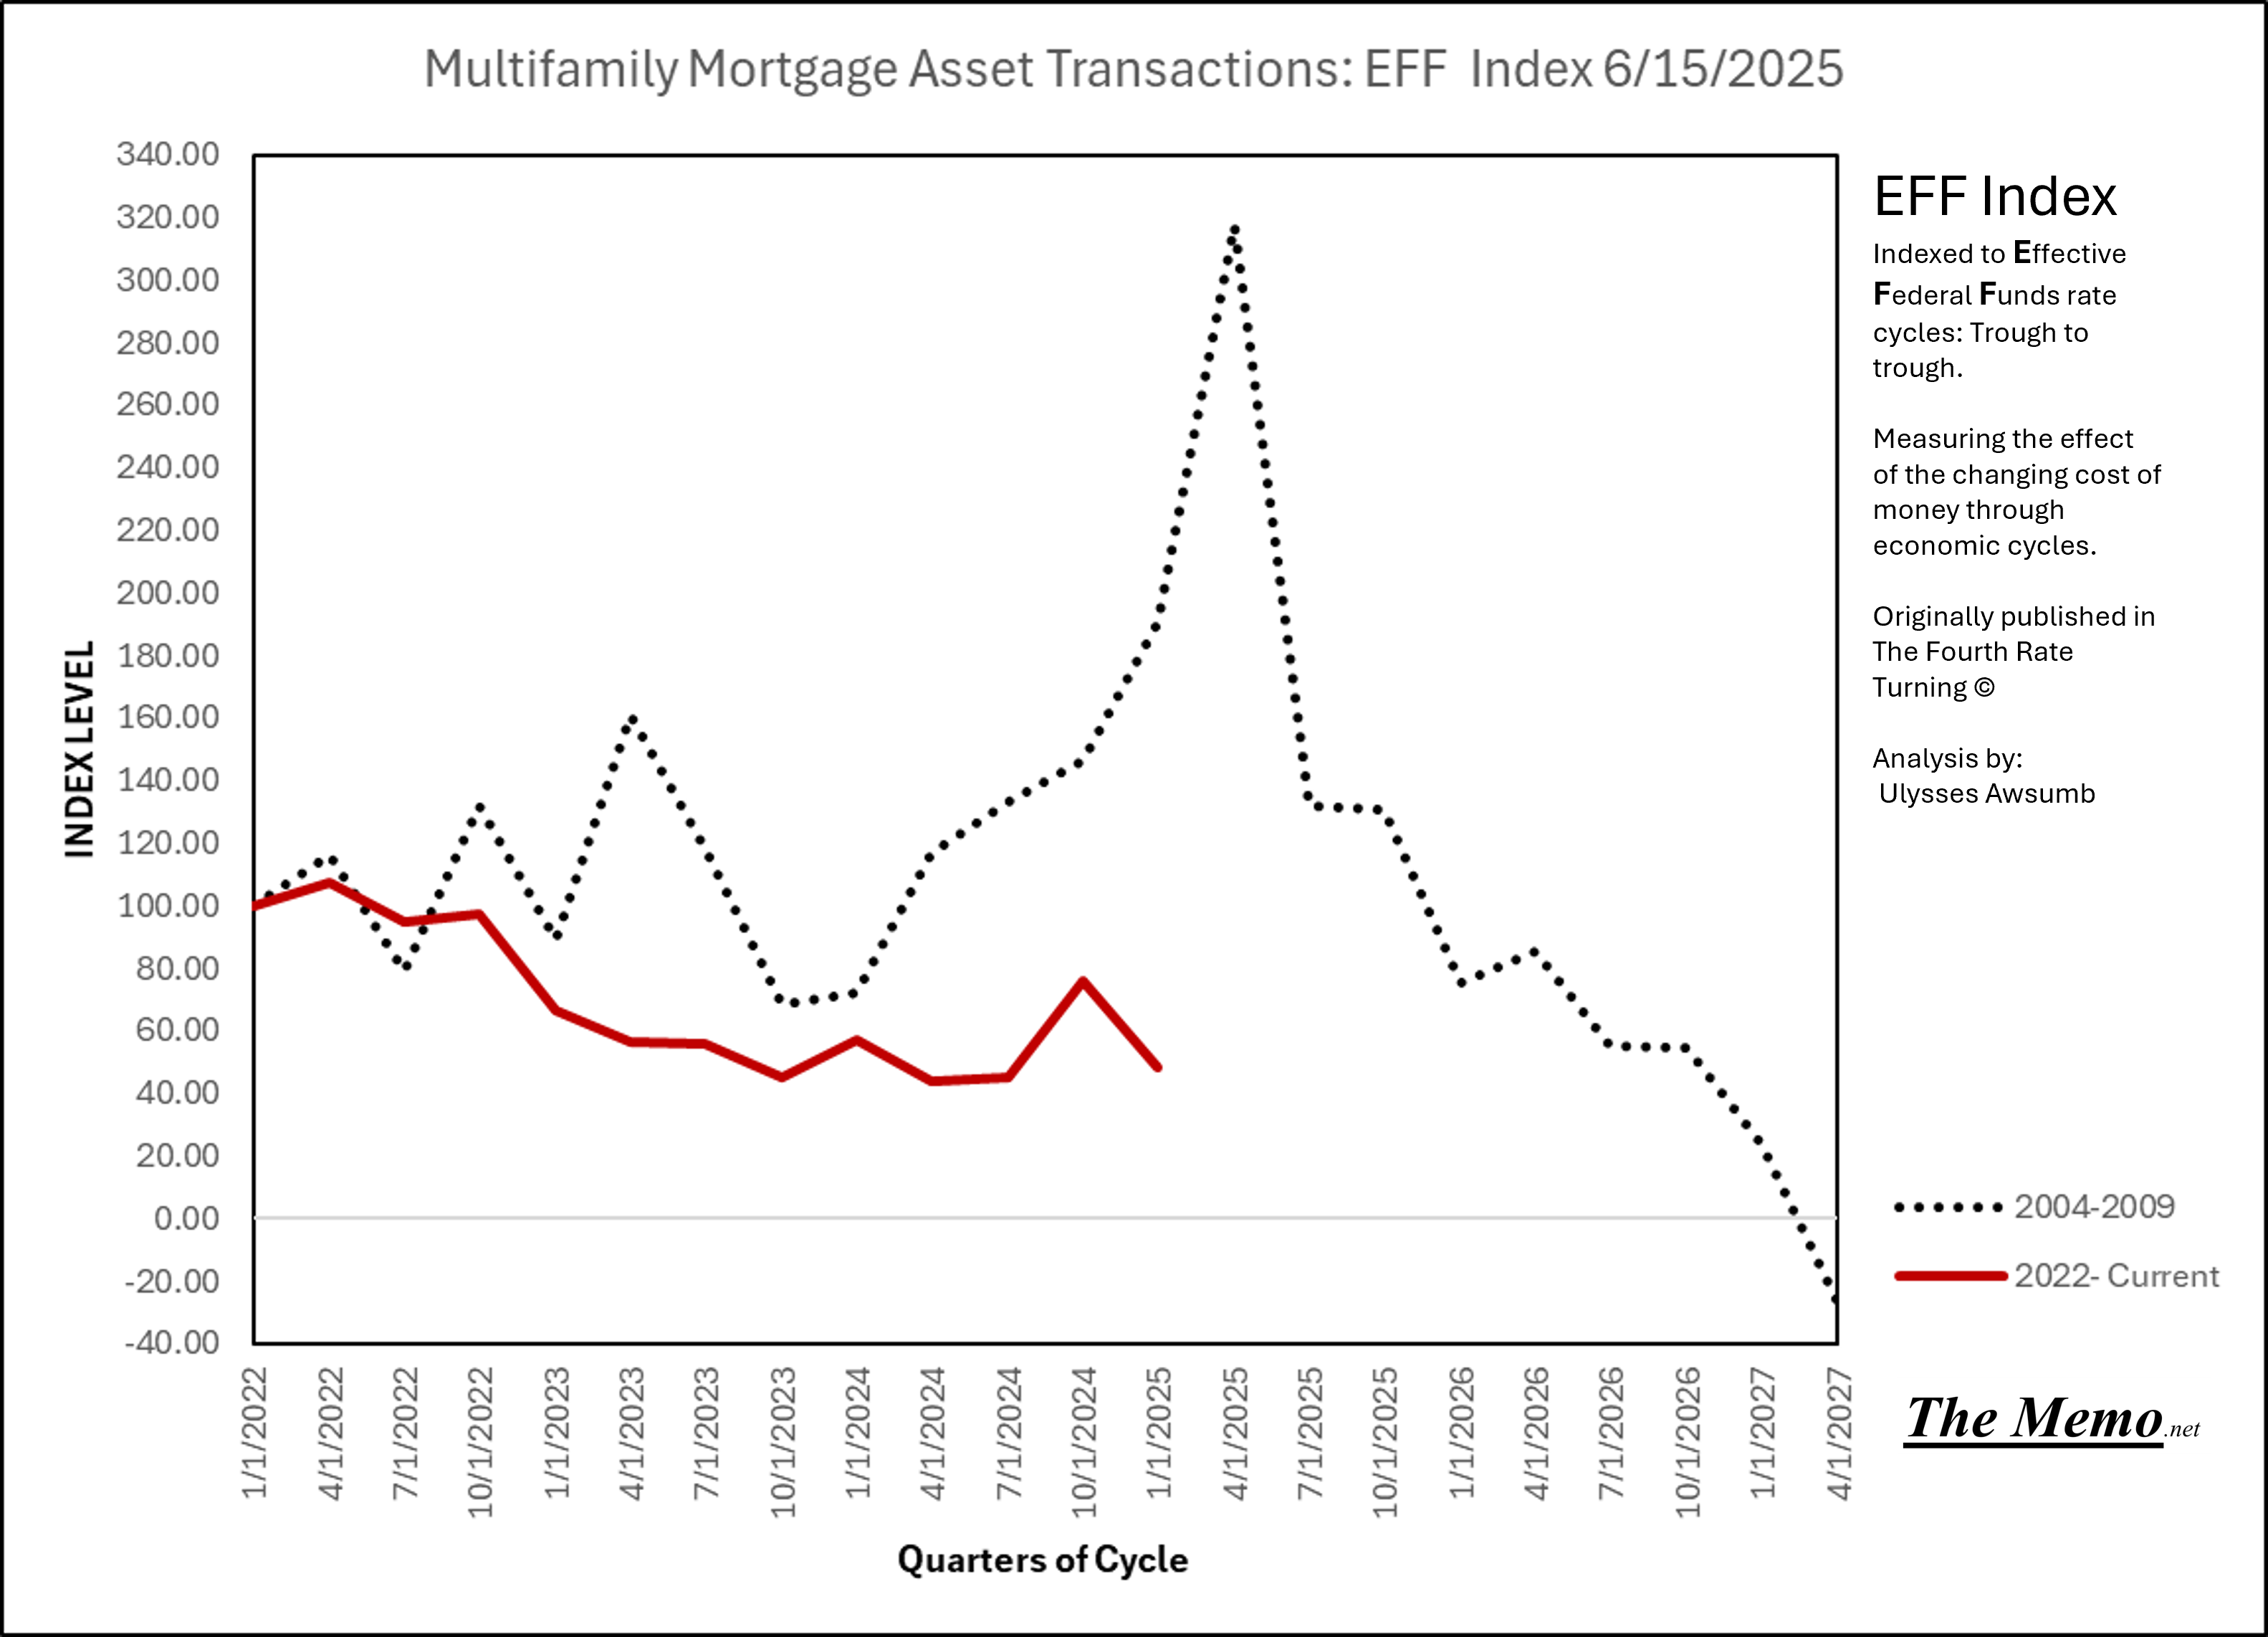
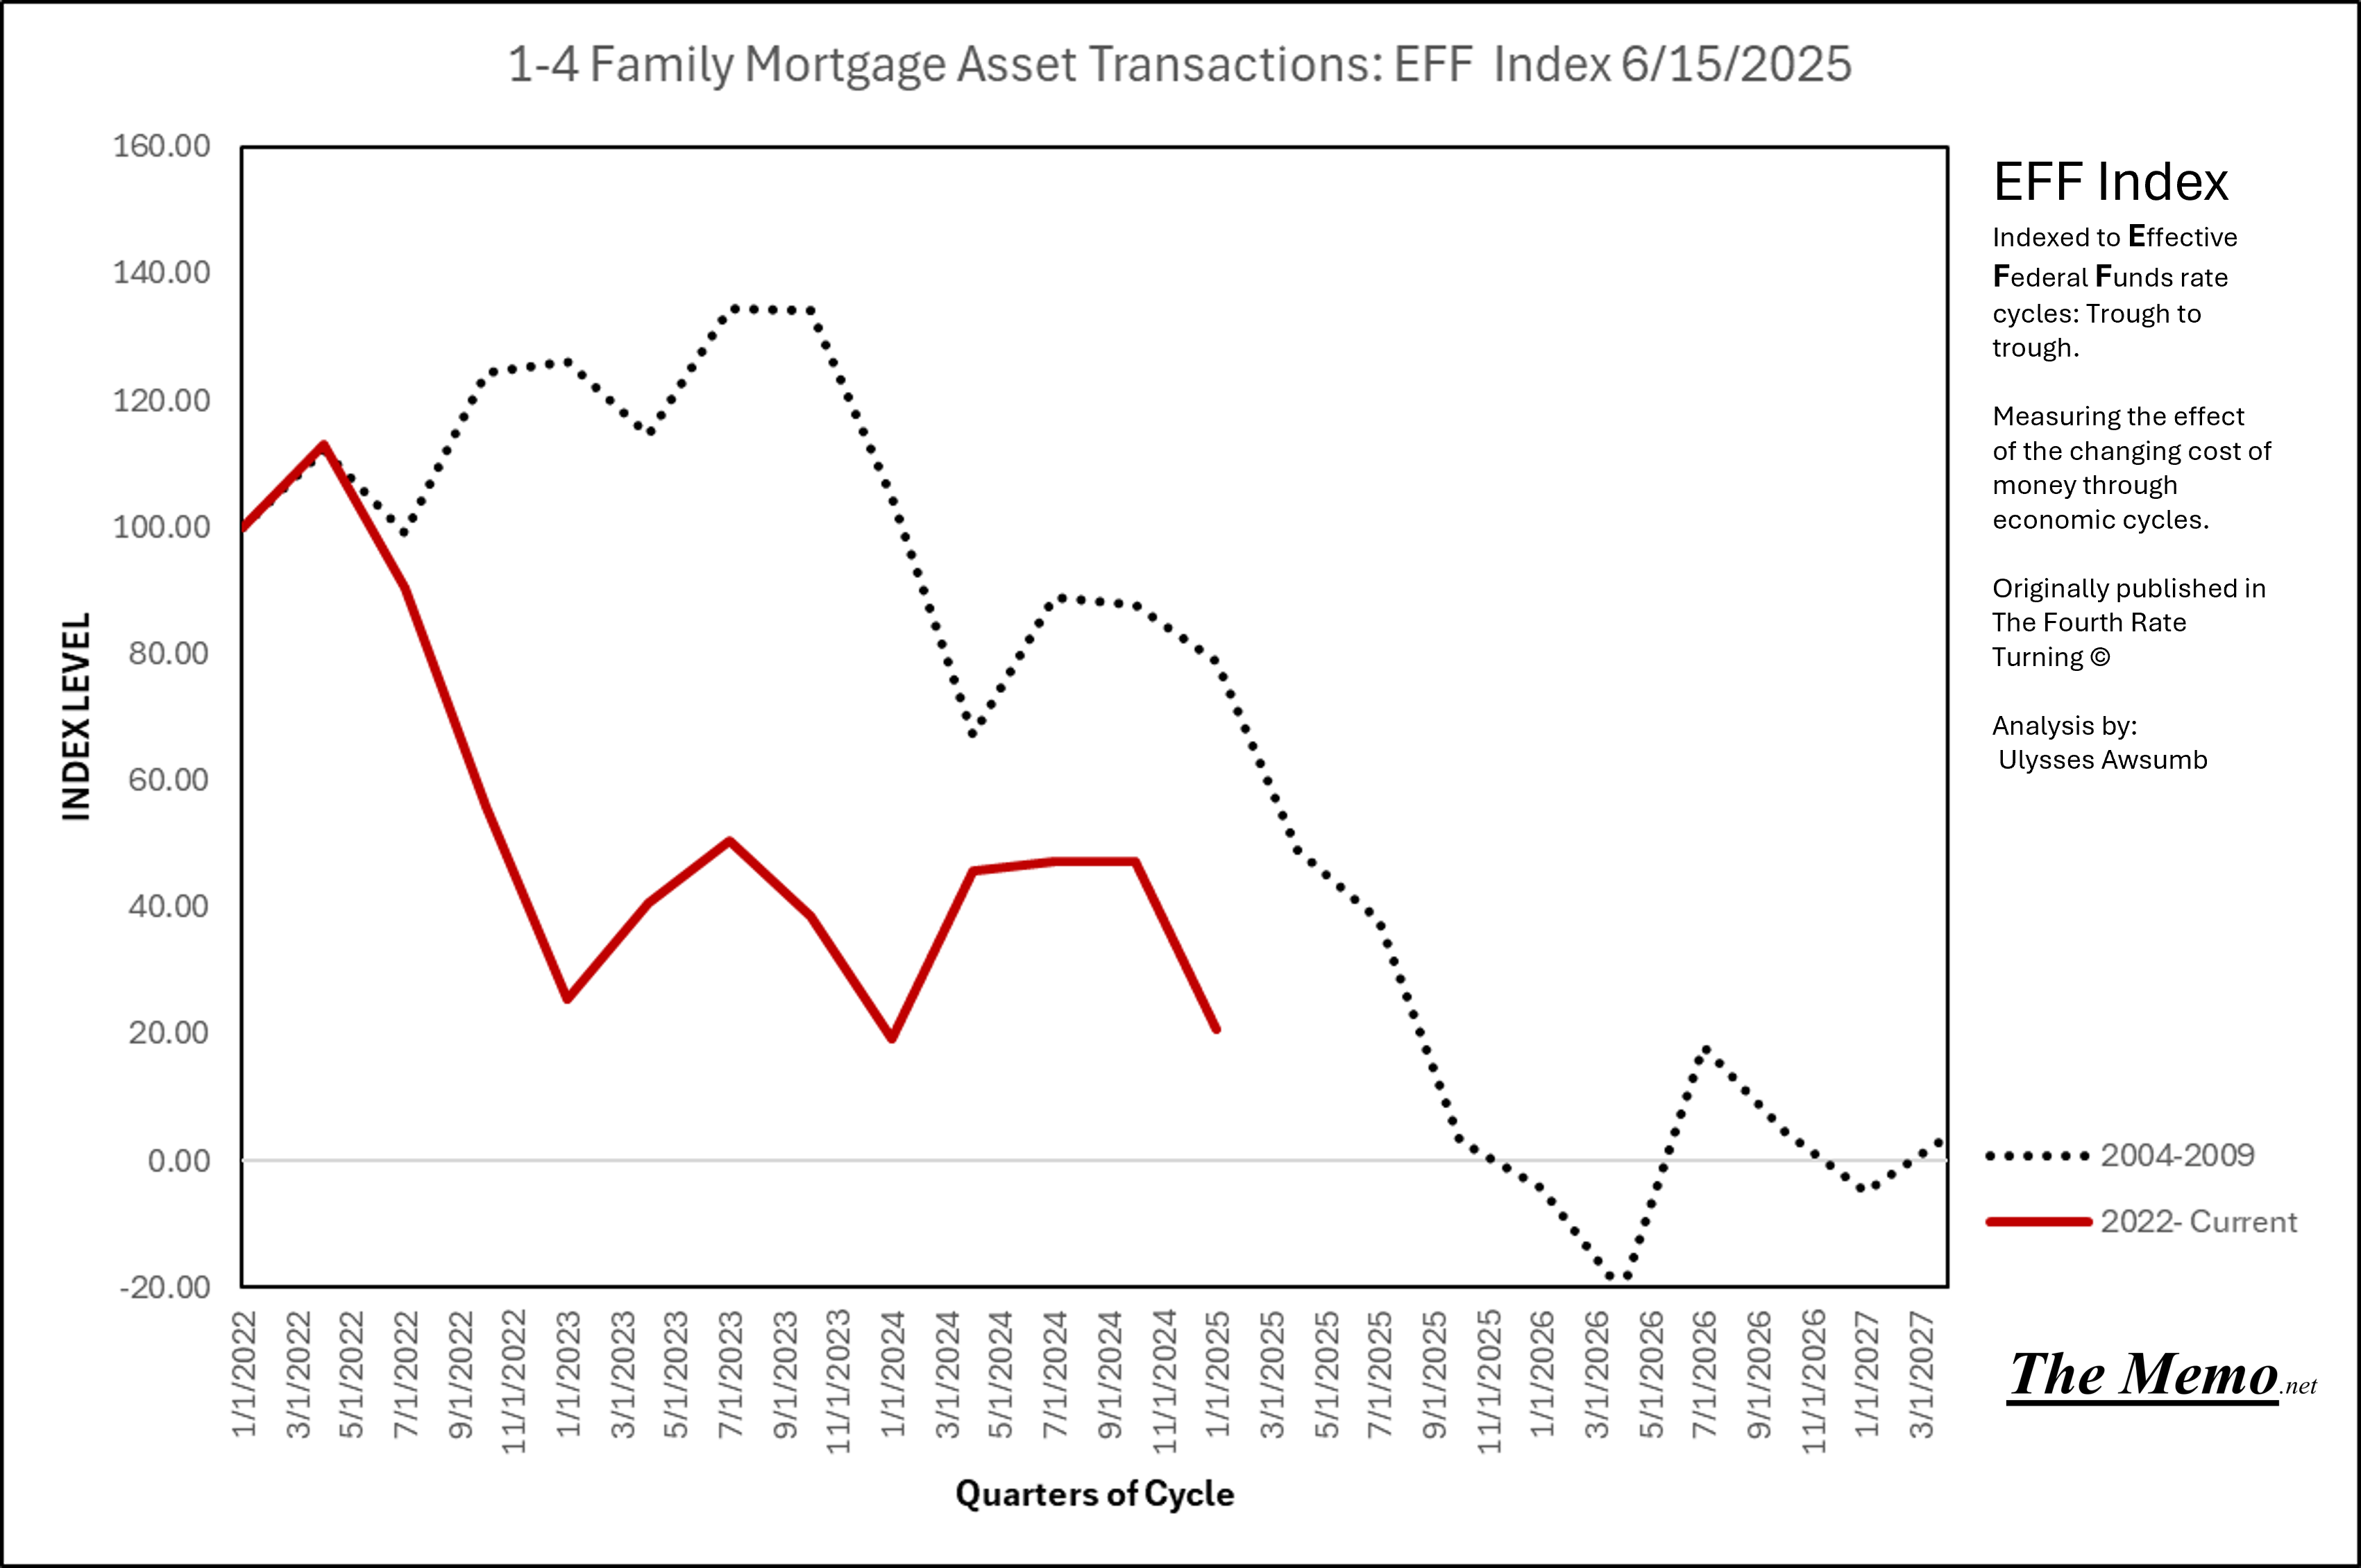
Within this favored economic data set of mine, we can view the levels of whole loan debt issuance on a sector by sector basis.
Here’s a look at the Multifamily issuance of these debt instruments:
And the issuance of said debt instruments for 1-4 Family (Read single family) real estate:
And the commercial real estate sector, turning itself all the way back to the mid 90’s in terms of dollars.
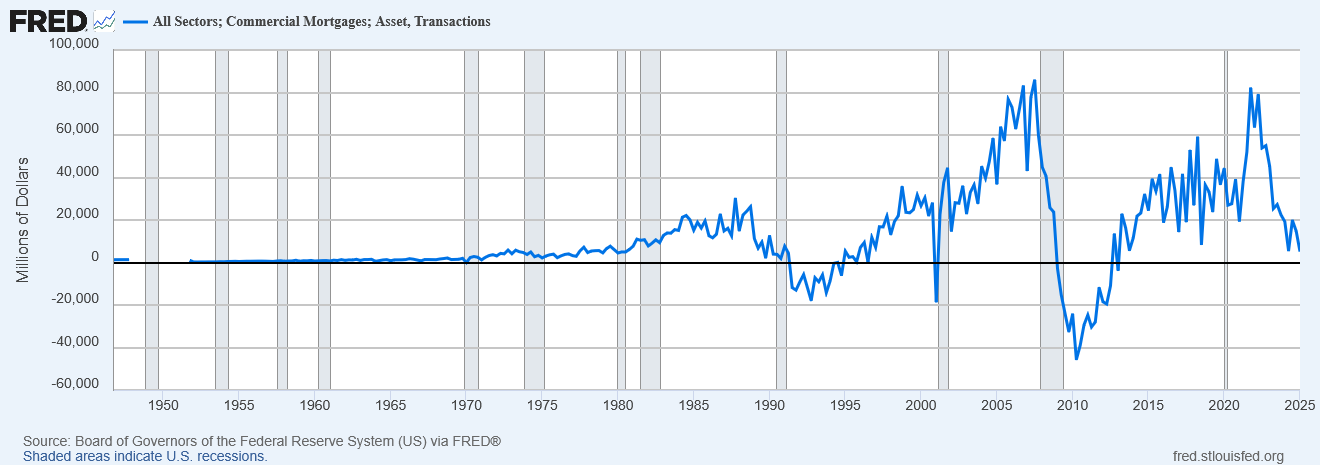
These are favored for two main reasons:
These show the level of dollars destroyed (negative values) of real estate whole loan debts/mortgages across time. This isn’t just prices going negative this is the last and most secured interest holder of title (lenders) values showing a true and accurate depiction of real estate cycles. The “GFC” was far from the only real estate cycle of destruction, it was just A) the most recent and B) the time all sectors of real estate lost more money than they created.
They show money being created and destroyed. The EFF cycles may show the timeline of behavior across industries and segments but theses show that the U.S. Dollar, is backed by the full faith and CREDIT of the United States Government Of The People, By The People and For (allegedly) The People. Or in other words, but the issuance of debt. It’s fiat remember.
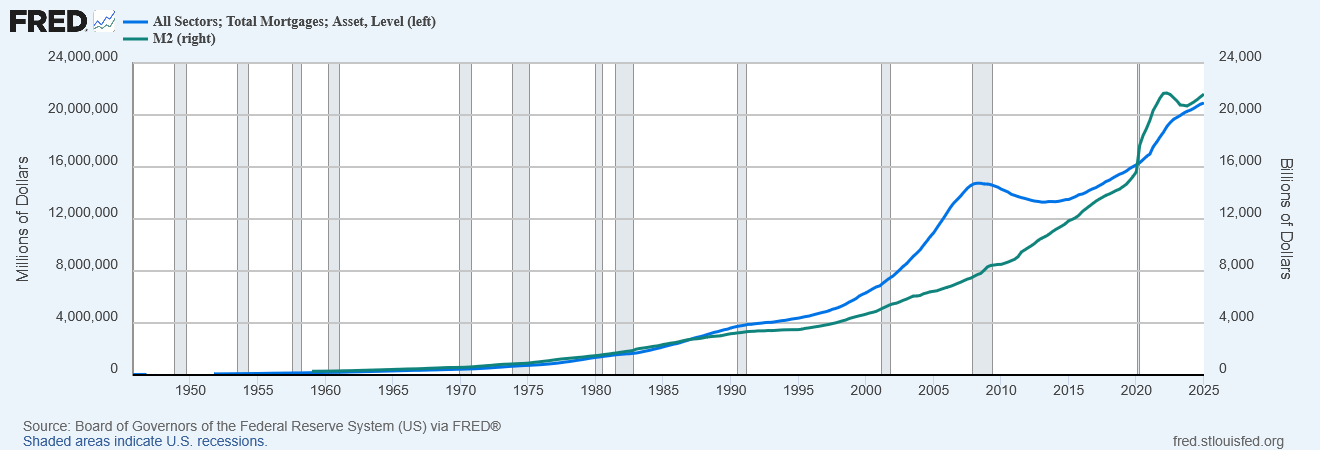
Look no further than the rate of change of the asset level of all sectors of total mortgages as compared to M2 money supply.
Aside from the obvious runs of printing press of: 1) reserve balances and 2) STIMMIES!!!! the correlation of mortgage debts to M2 (physical currency in circulation, checking accounts, savings accounts, and certain other highly liquid assets like money market mutual funds) goes back to just before they shot Kennedy and went to war in Vietnam.
If anyone needed anymore proof, just look at overall levels of each.
About that money printing, and what passes known as “modern monetary theory”, or MMT for short, here is the same chart but it includes M1 levels of money (M1 being the most liquid forms of money, specifically currency in circulation and demand deposits (checking accounts).
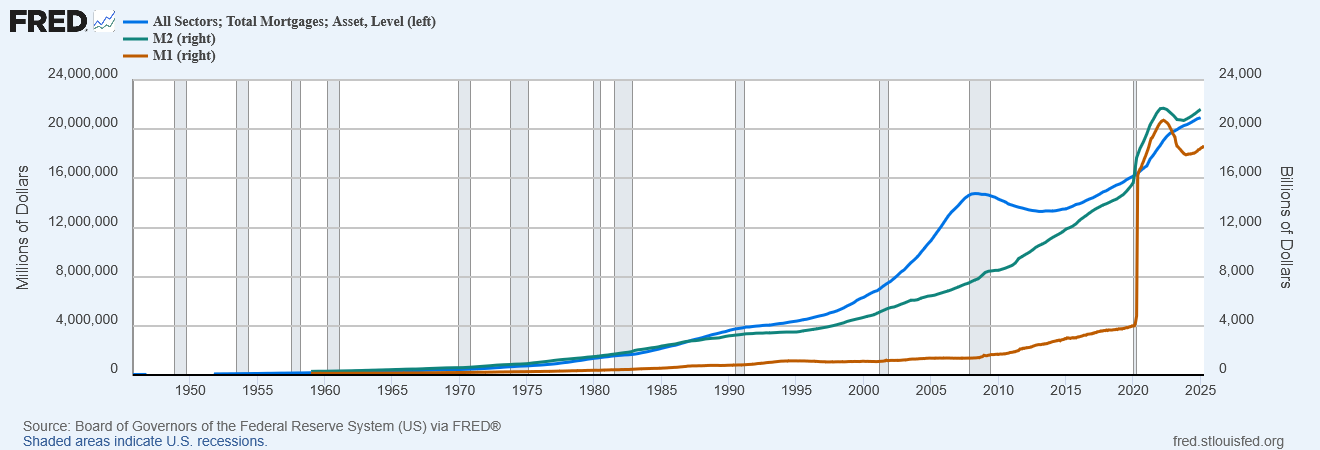
Remind me where 1-STIMMIES, 2-PPP, 3-ERC were delivered to people?
Why does it matter? Read on.
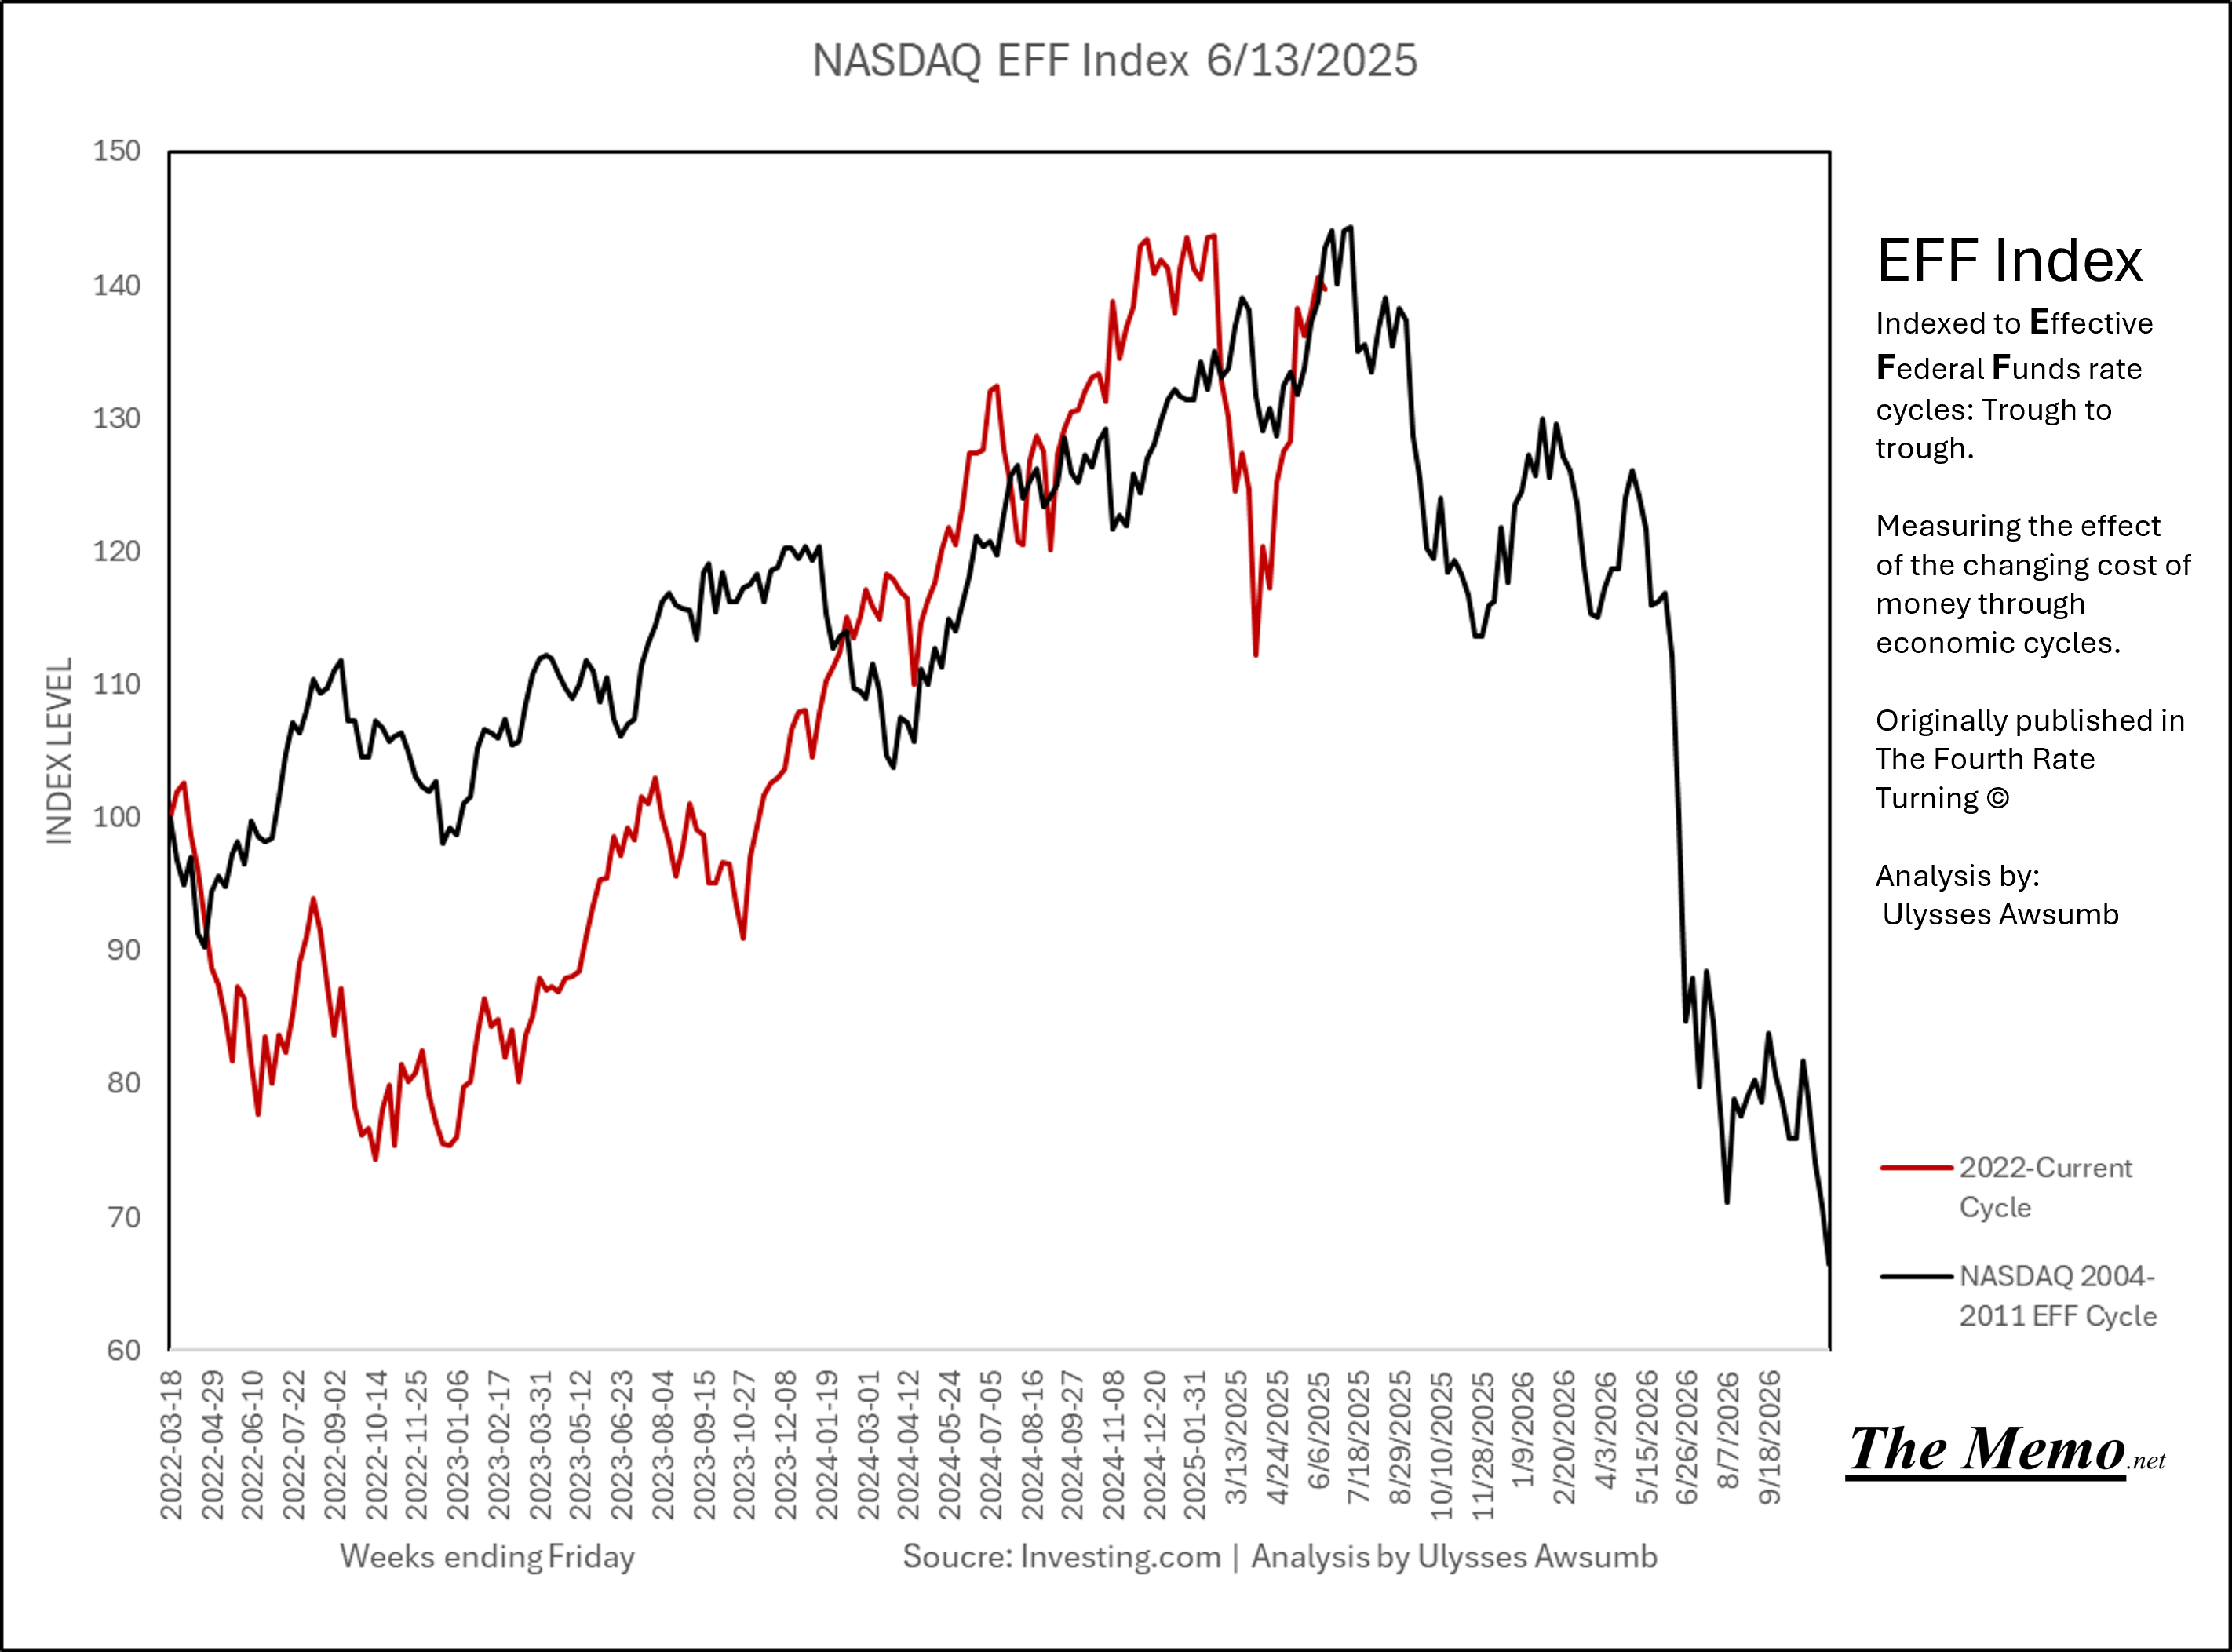
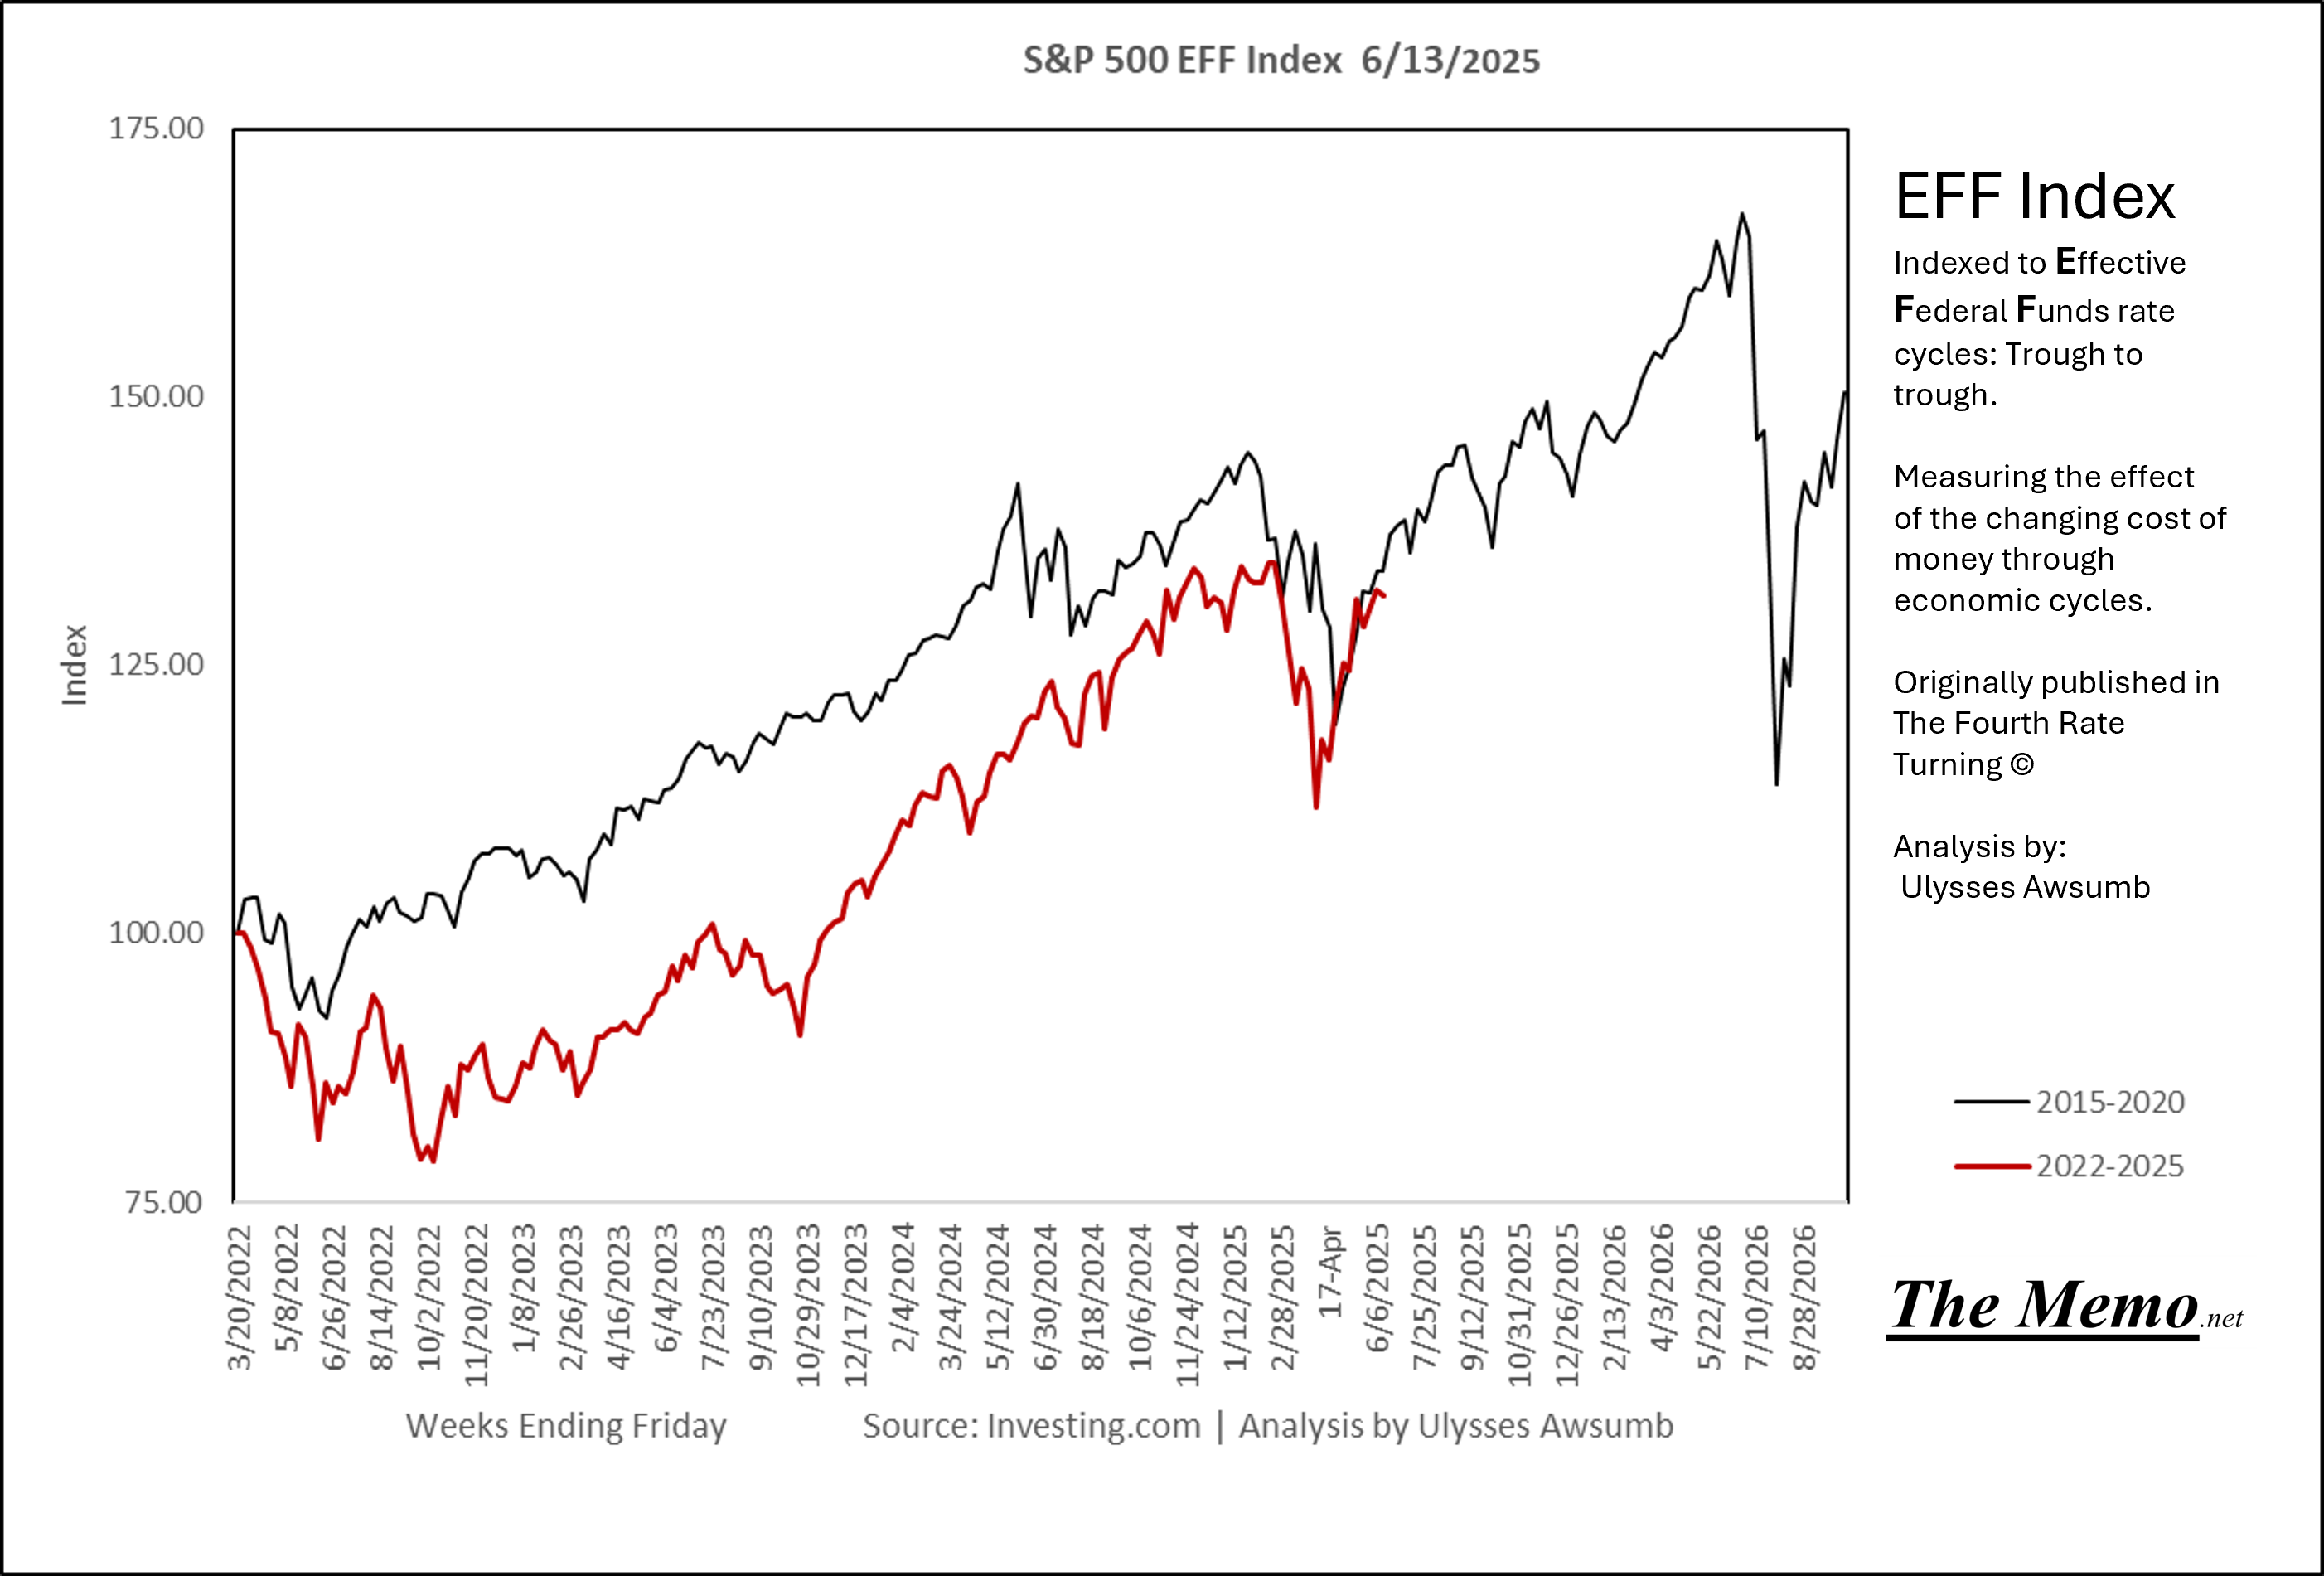
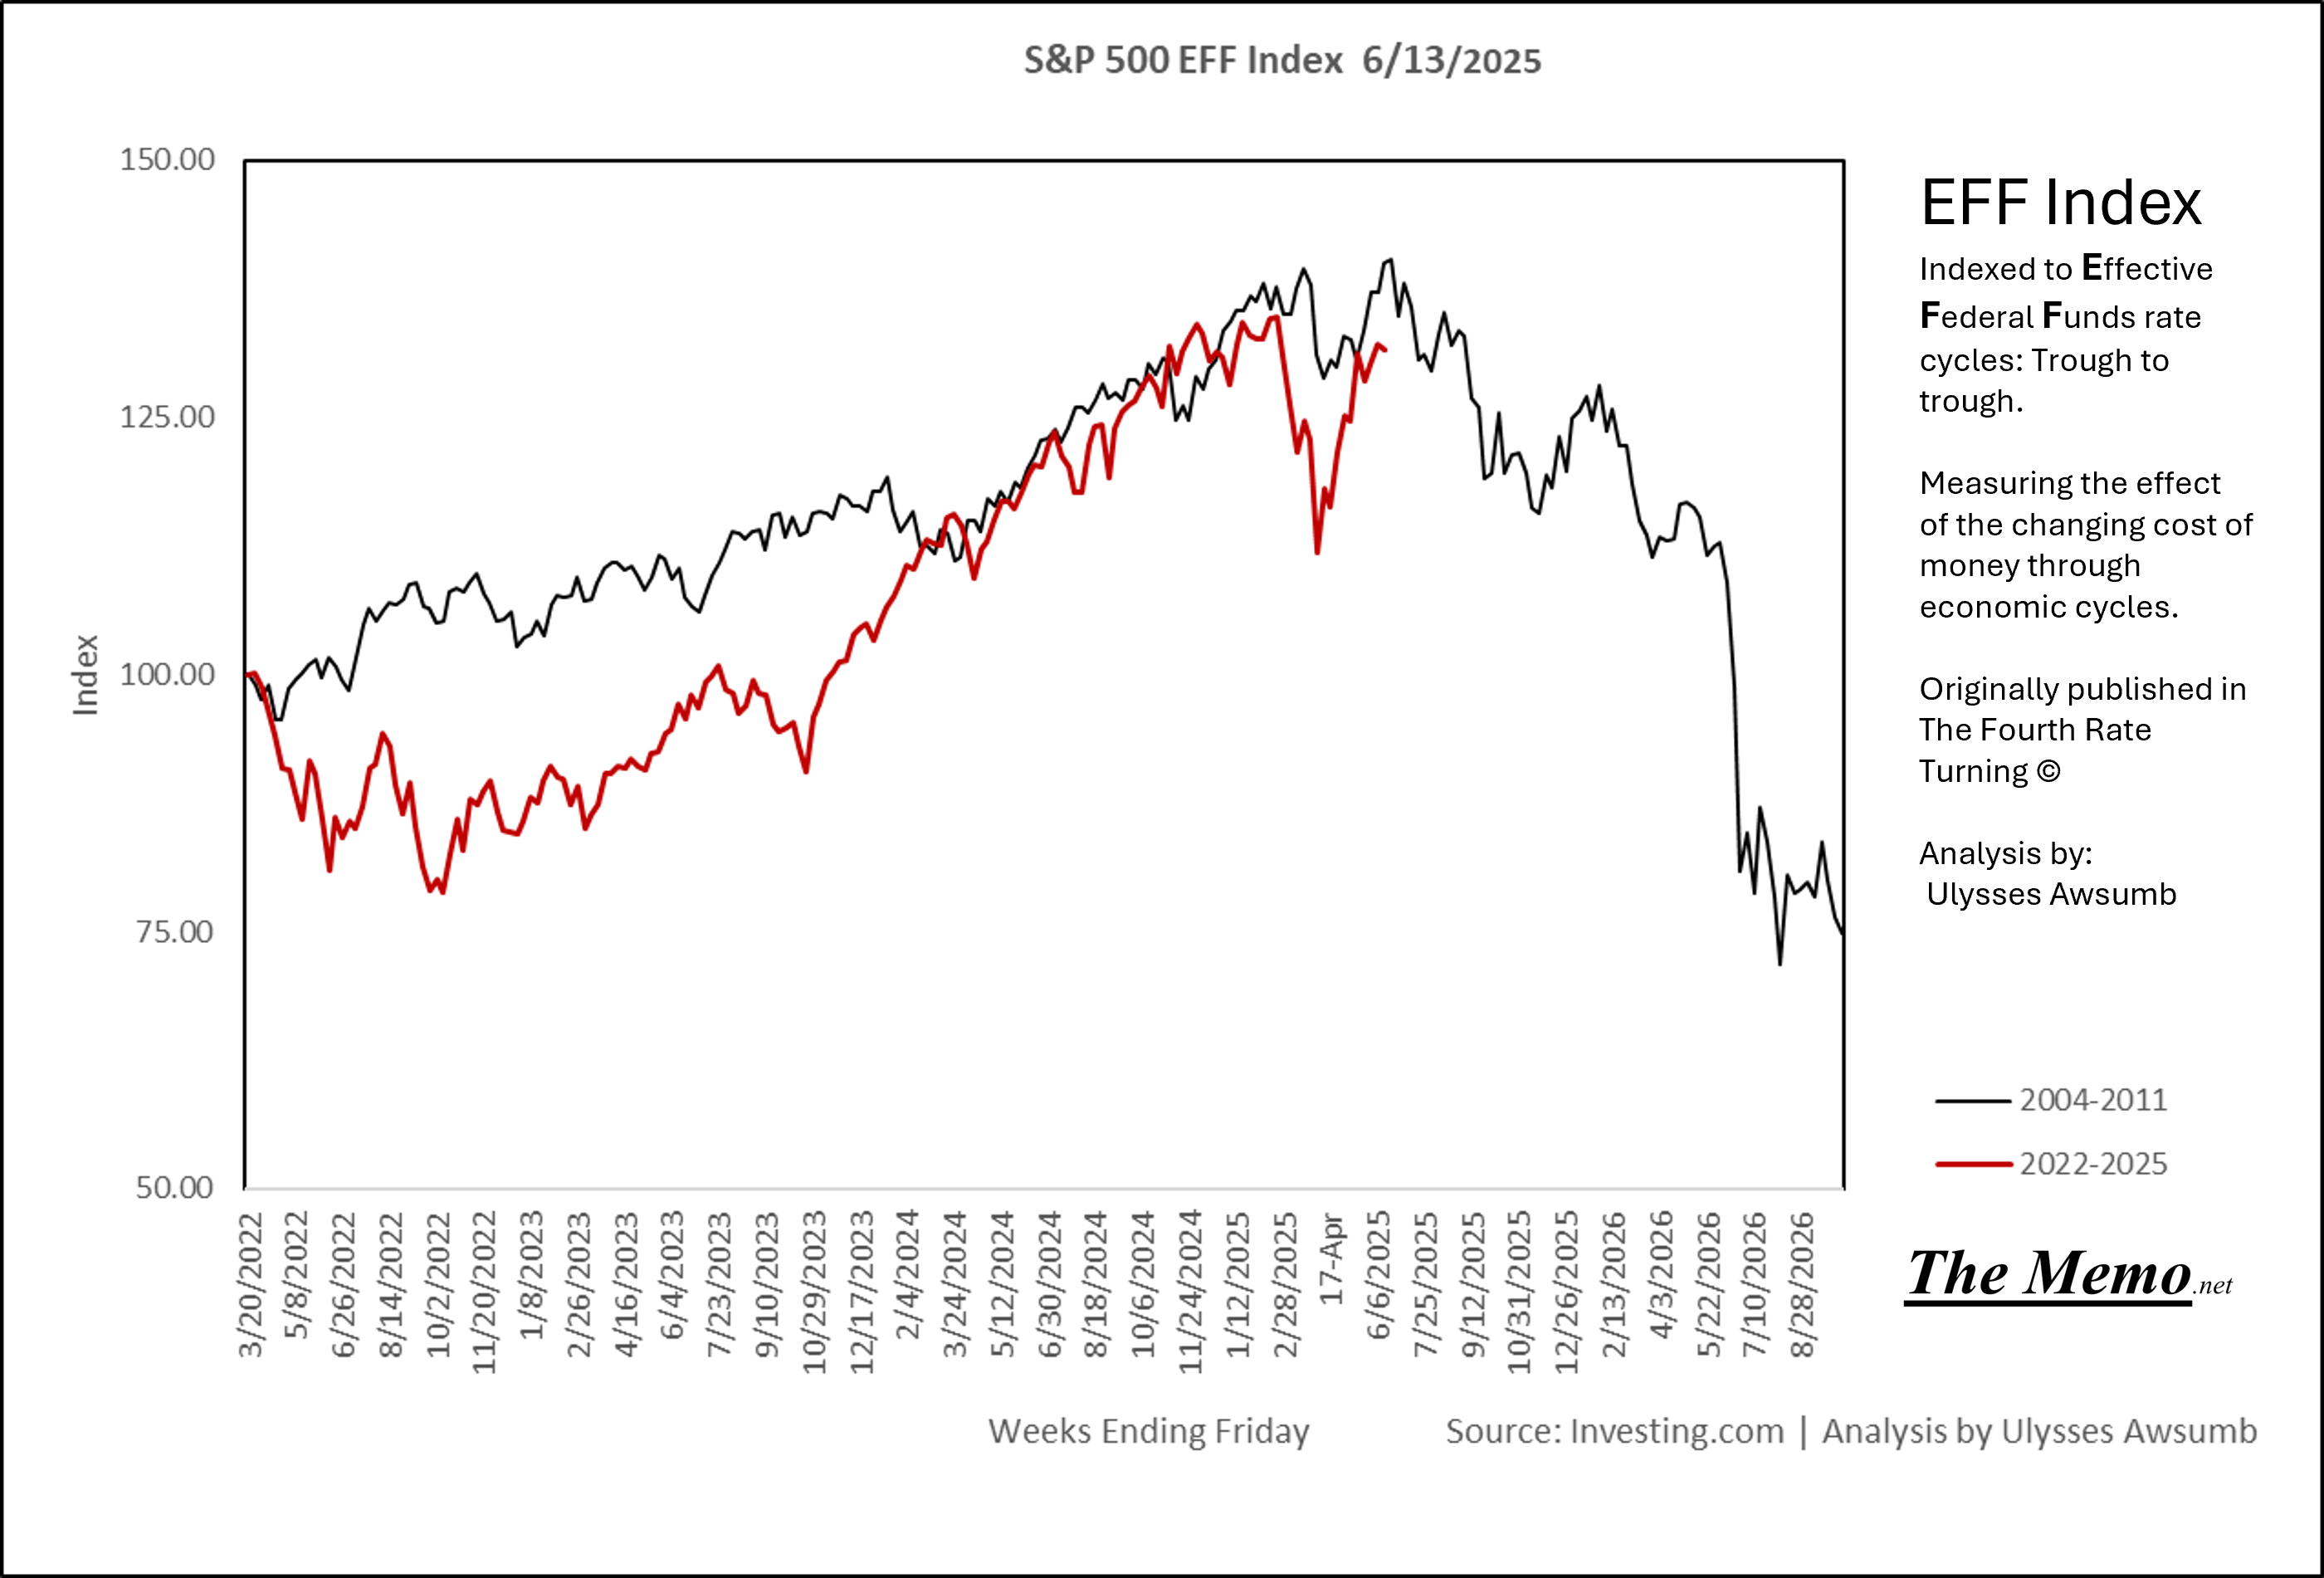
Equities
The S&P 500 and NASDAQ are both closely tracking past cycles. While I’ve delivered the week of this year’s drawdown, level of support for the bottom, and bounce back to upper range levels, I believe the next 9 weeks are going to be crucial in determining the the overall direction of equities. September should see a drawdown, how severe it is will determine if equities follow the path of the 2004-2011 cycle or 2015-2020 cycle. Both will see another major drawdown, one will see further weakness appear beforehand. Both will likely be a meatgrinder for equities, the most plugged in traders will emerge, the continuous up motion of 401k contributions will begin to slow. Most folks will forget all of it by the time the cycle ends, as they only remember what happened most recently.
In Fairness, I can’t even imagine being a day trader and the level of effort to ignore noise some timeframes in markets require.
The NASDAQ is 139% of where it began the cycle while the S&P 500 is at 132%.
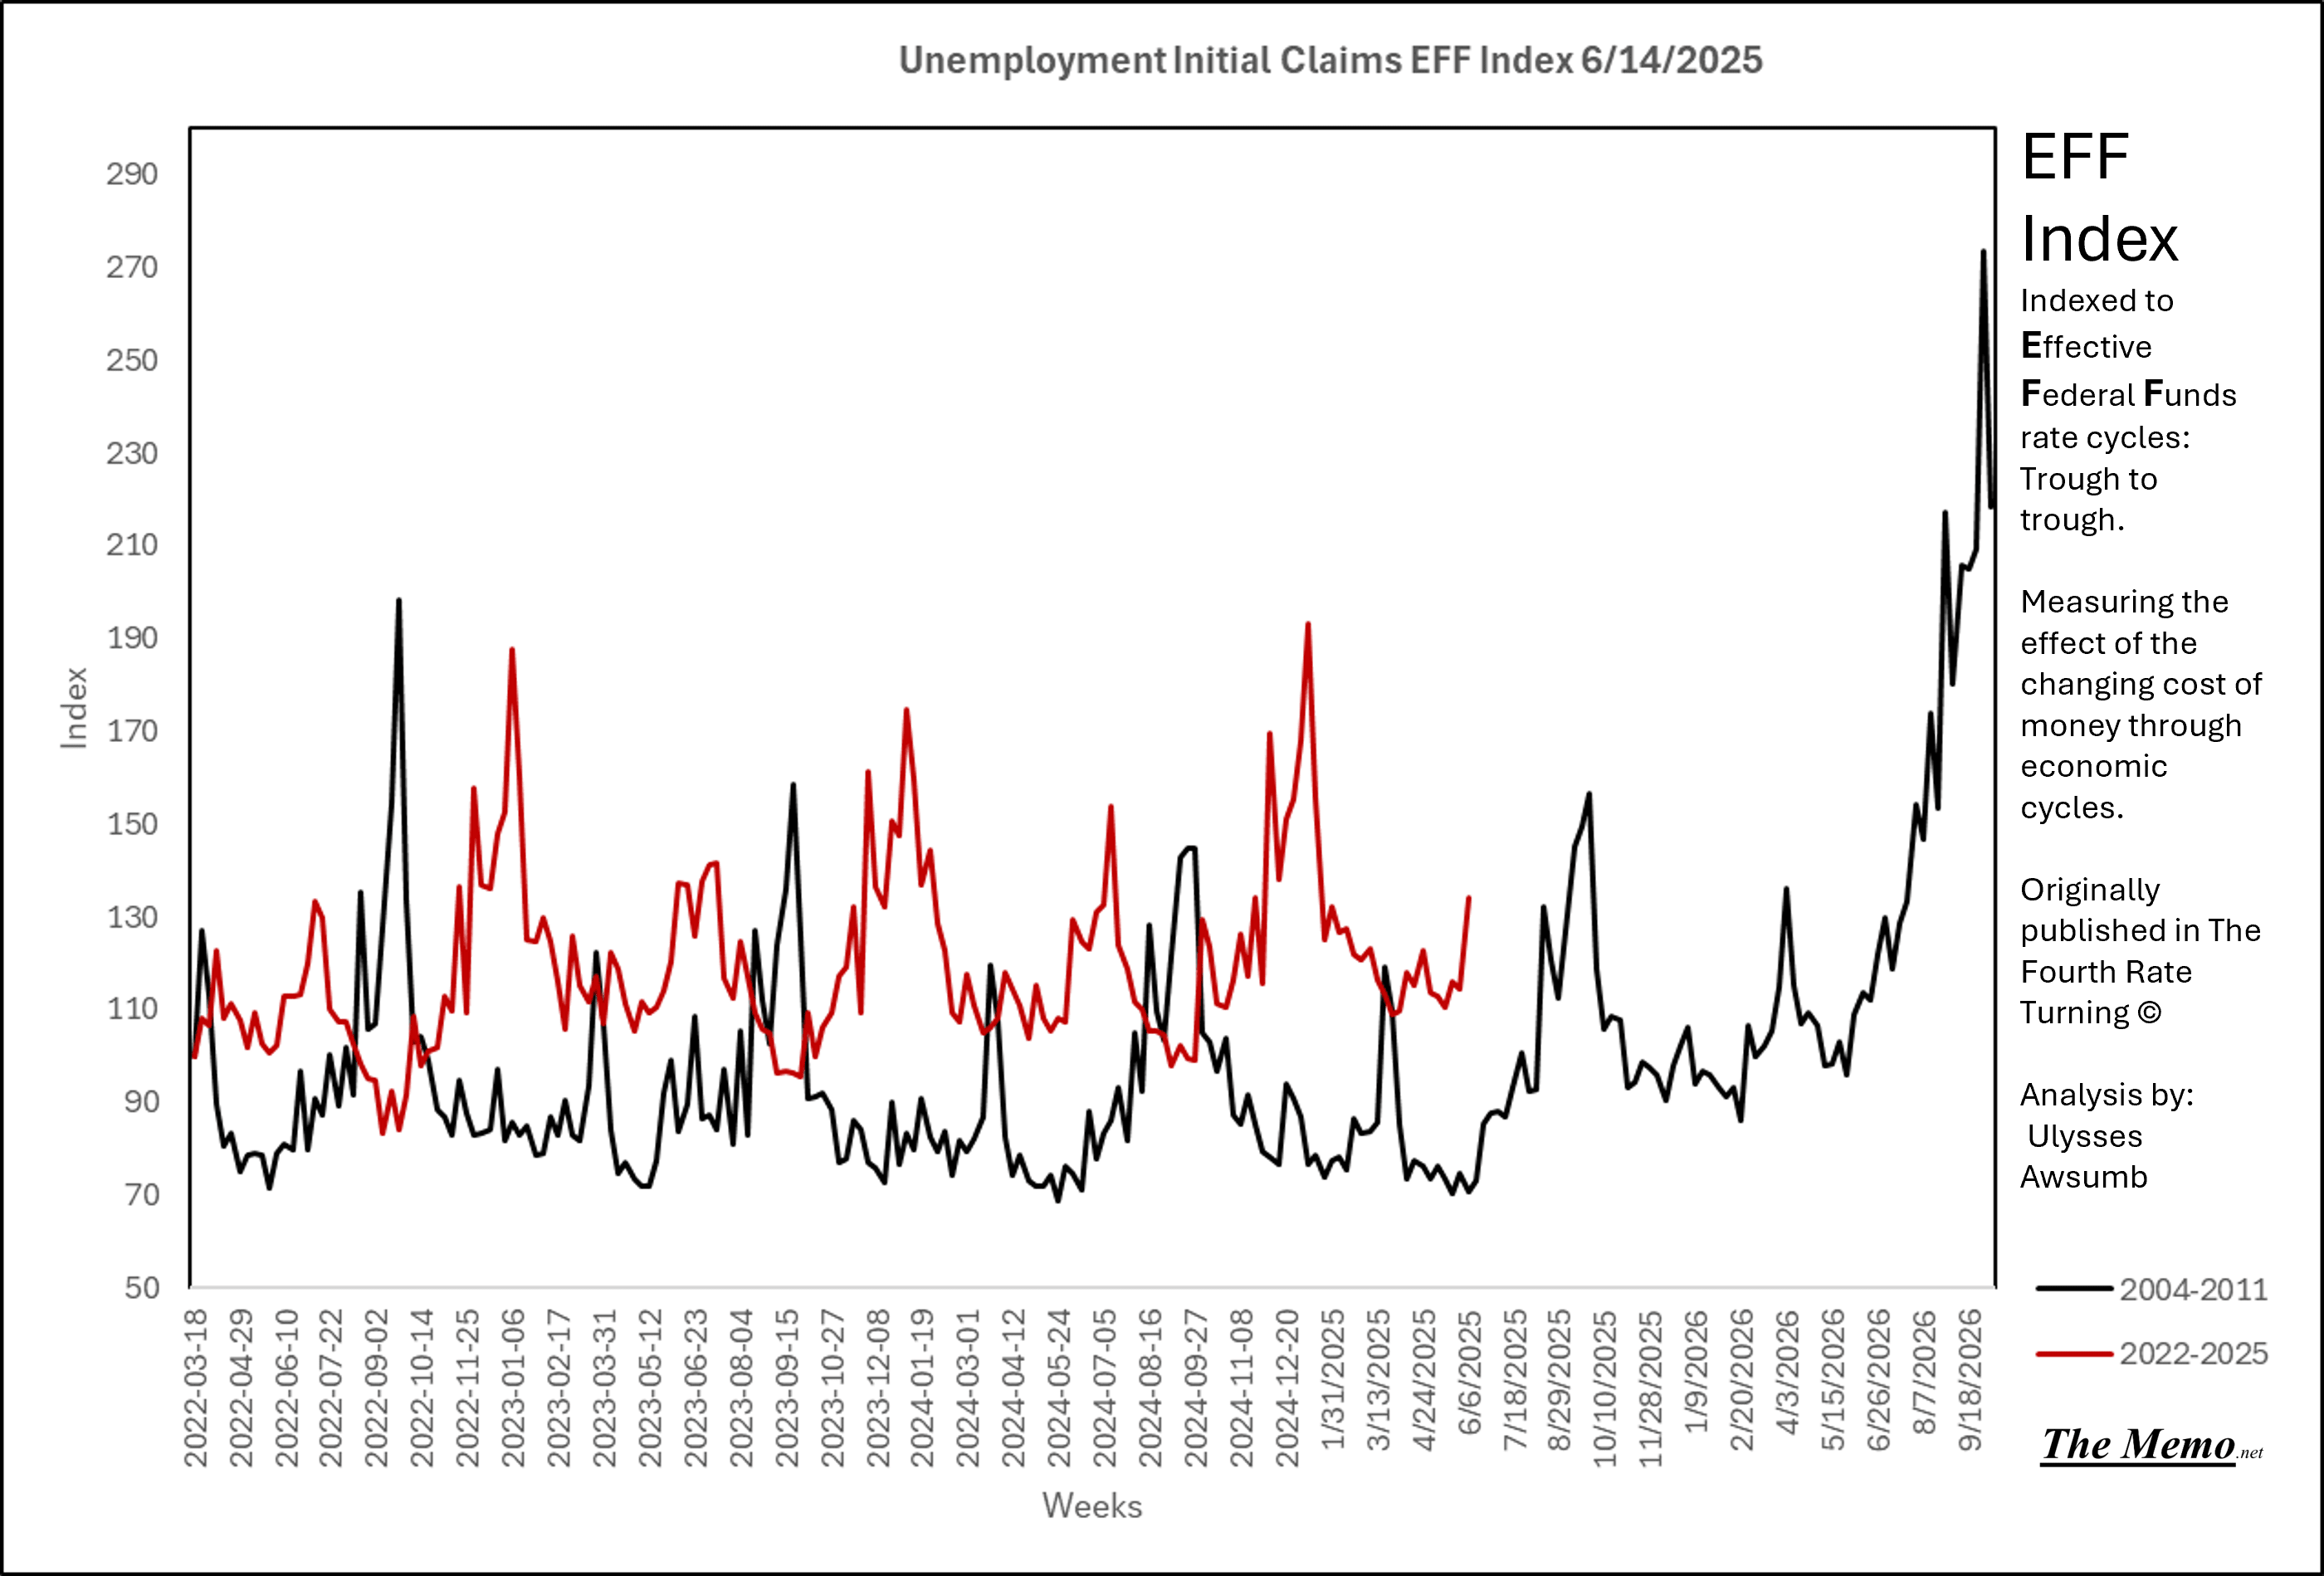
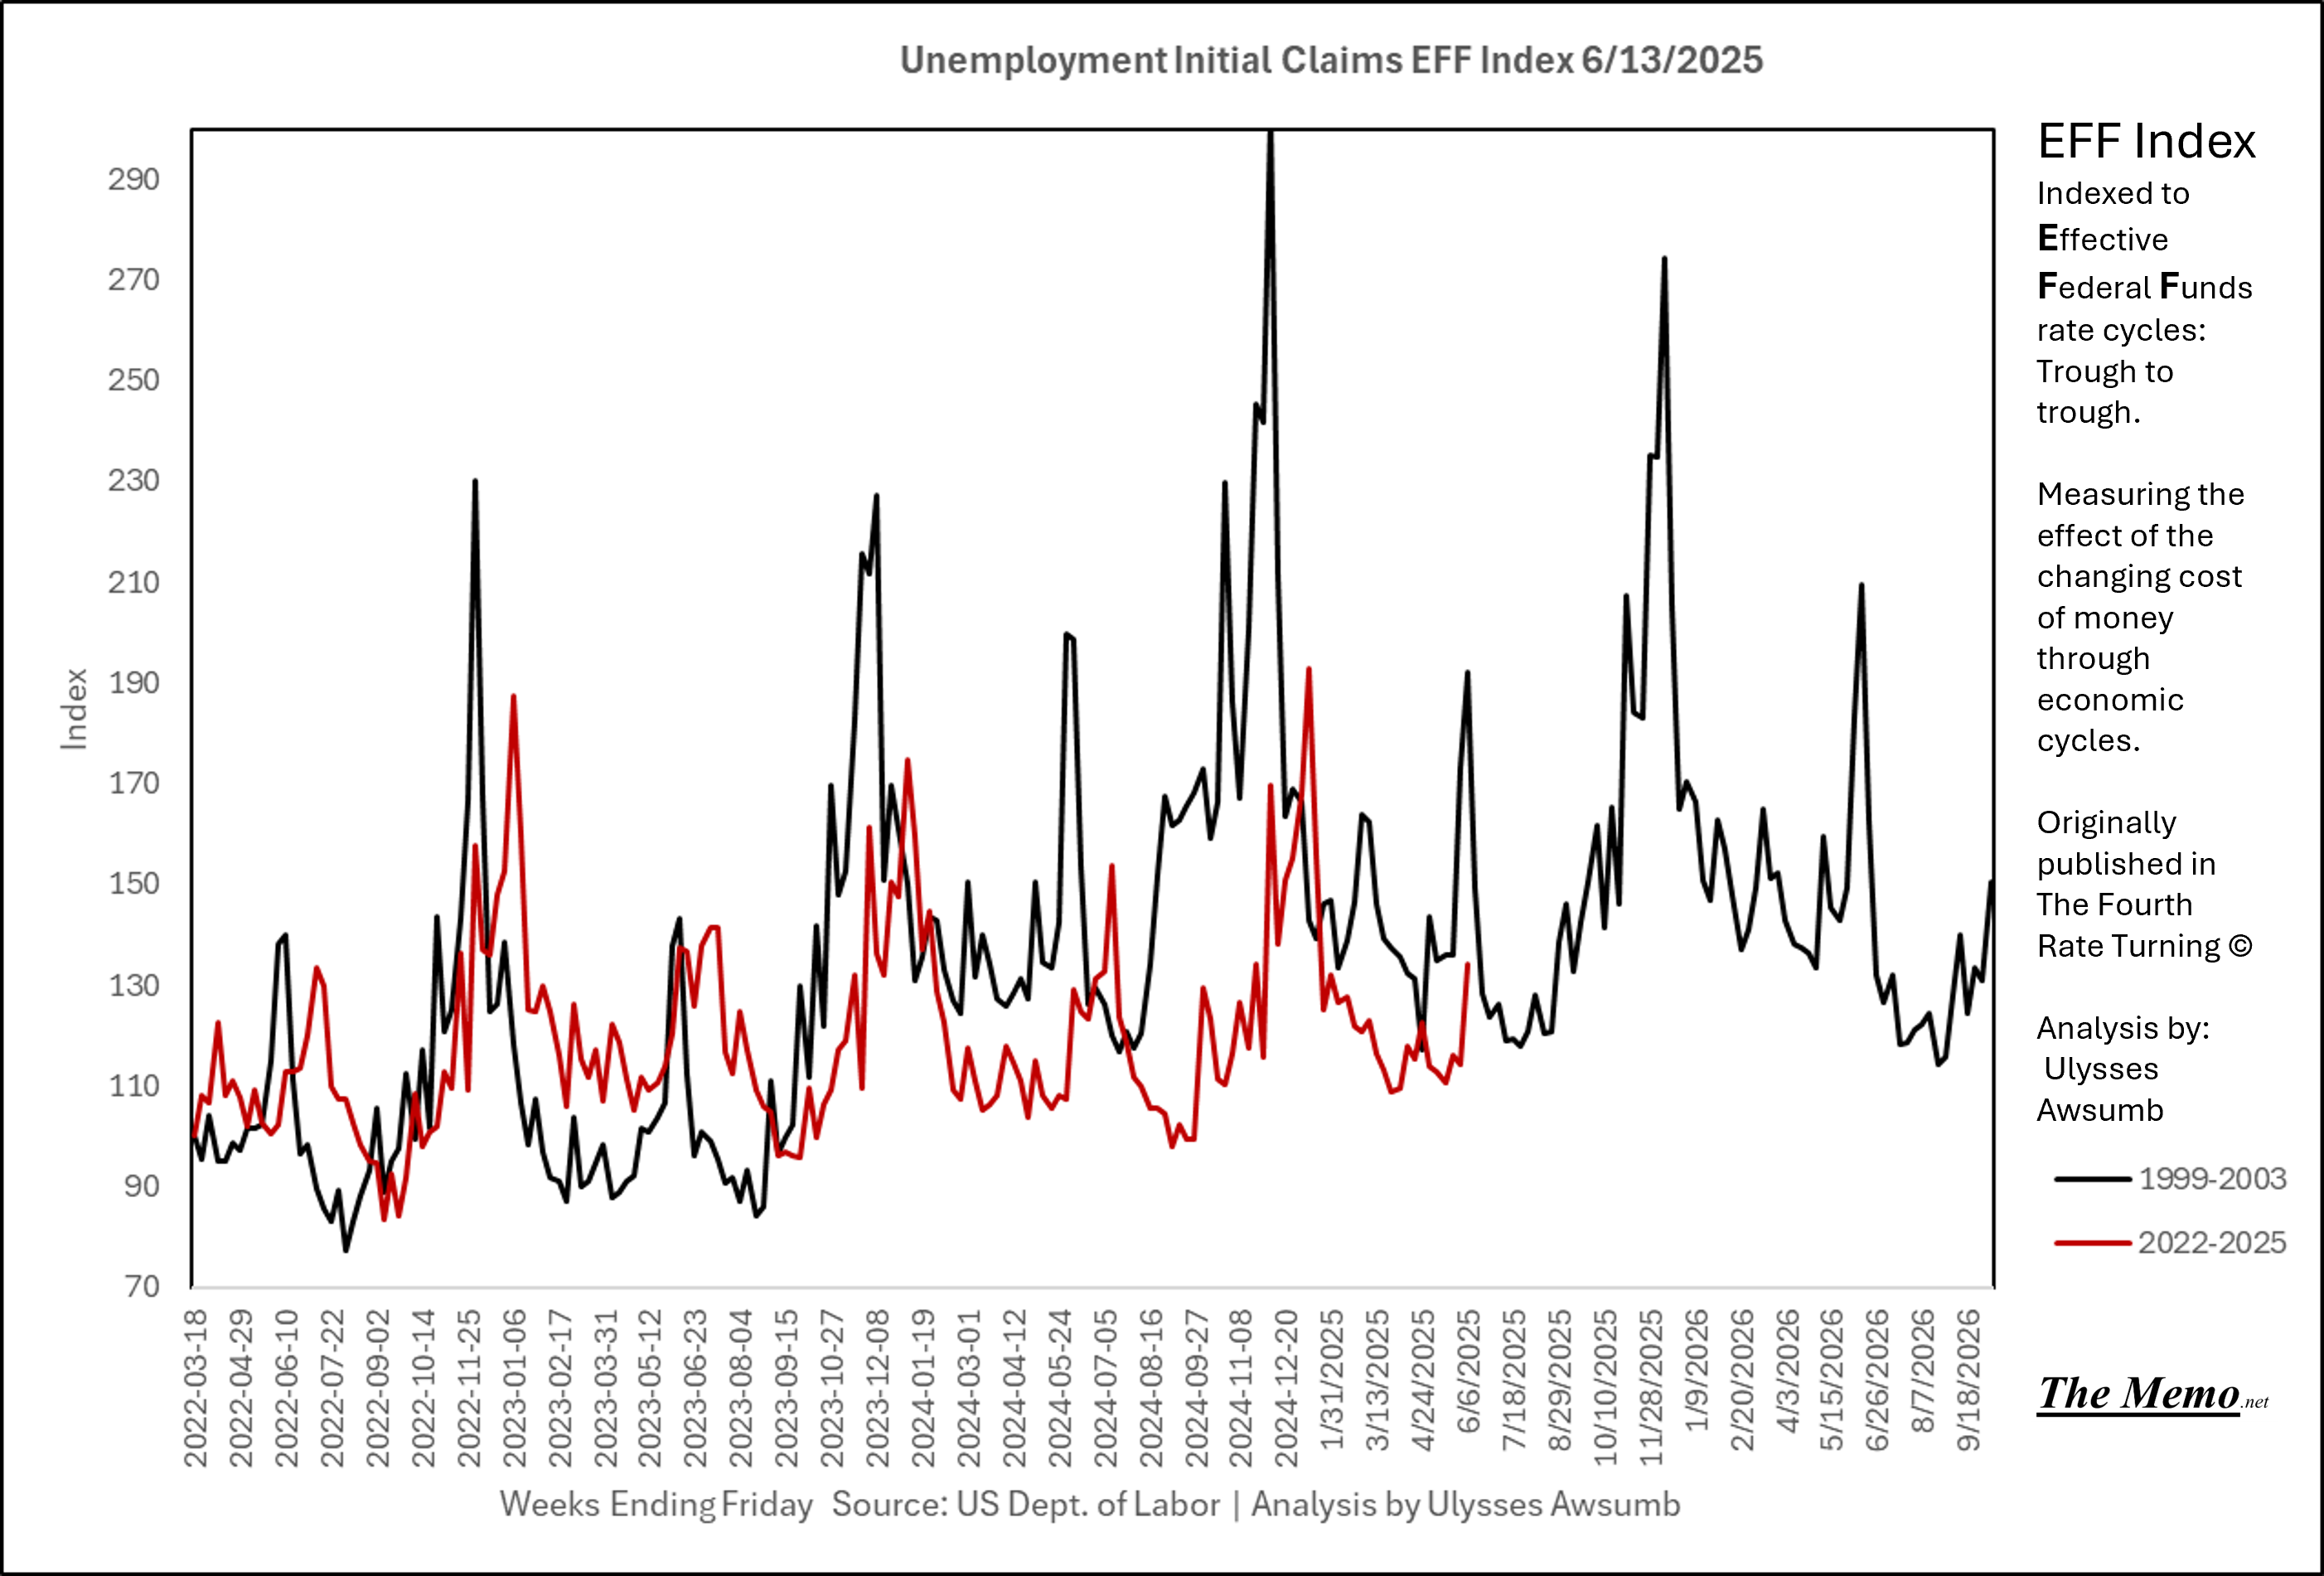
Employment
Initial claims came in at 244k. 134% of where the cycle began.
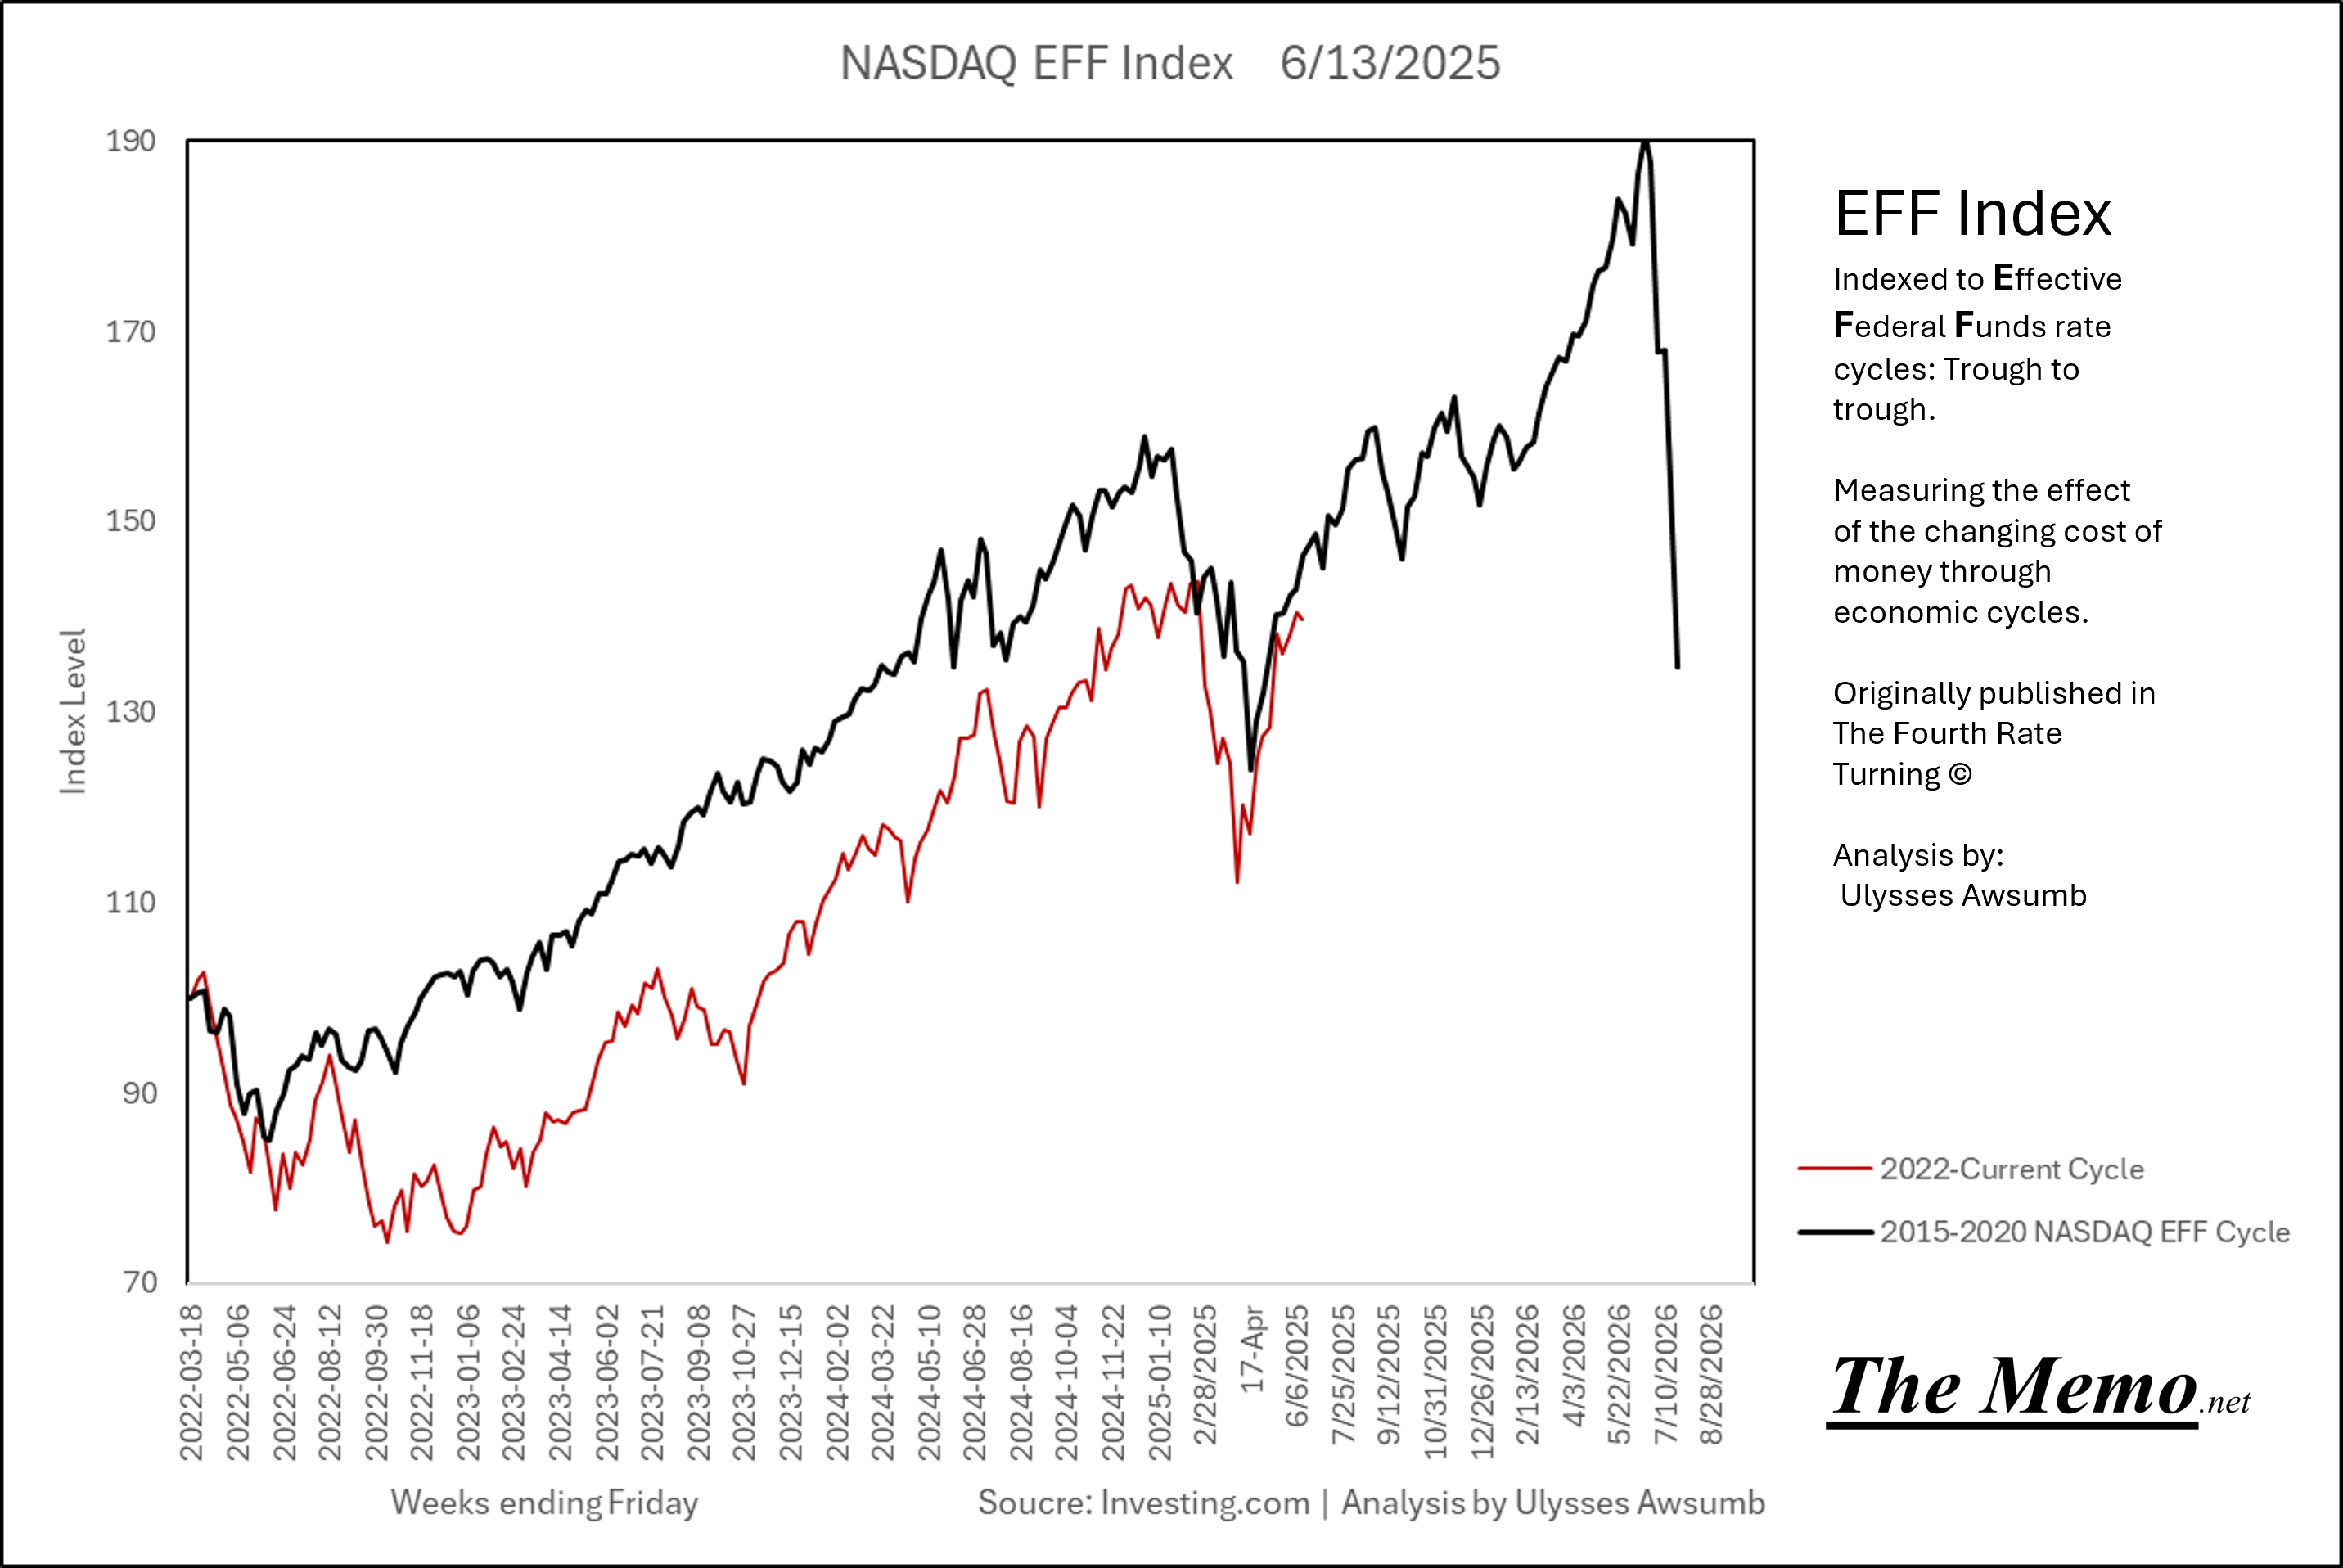
USD/JPY
“Carry” on. Or is it “Carry off”?
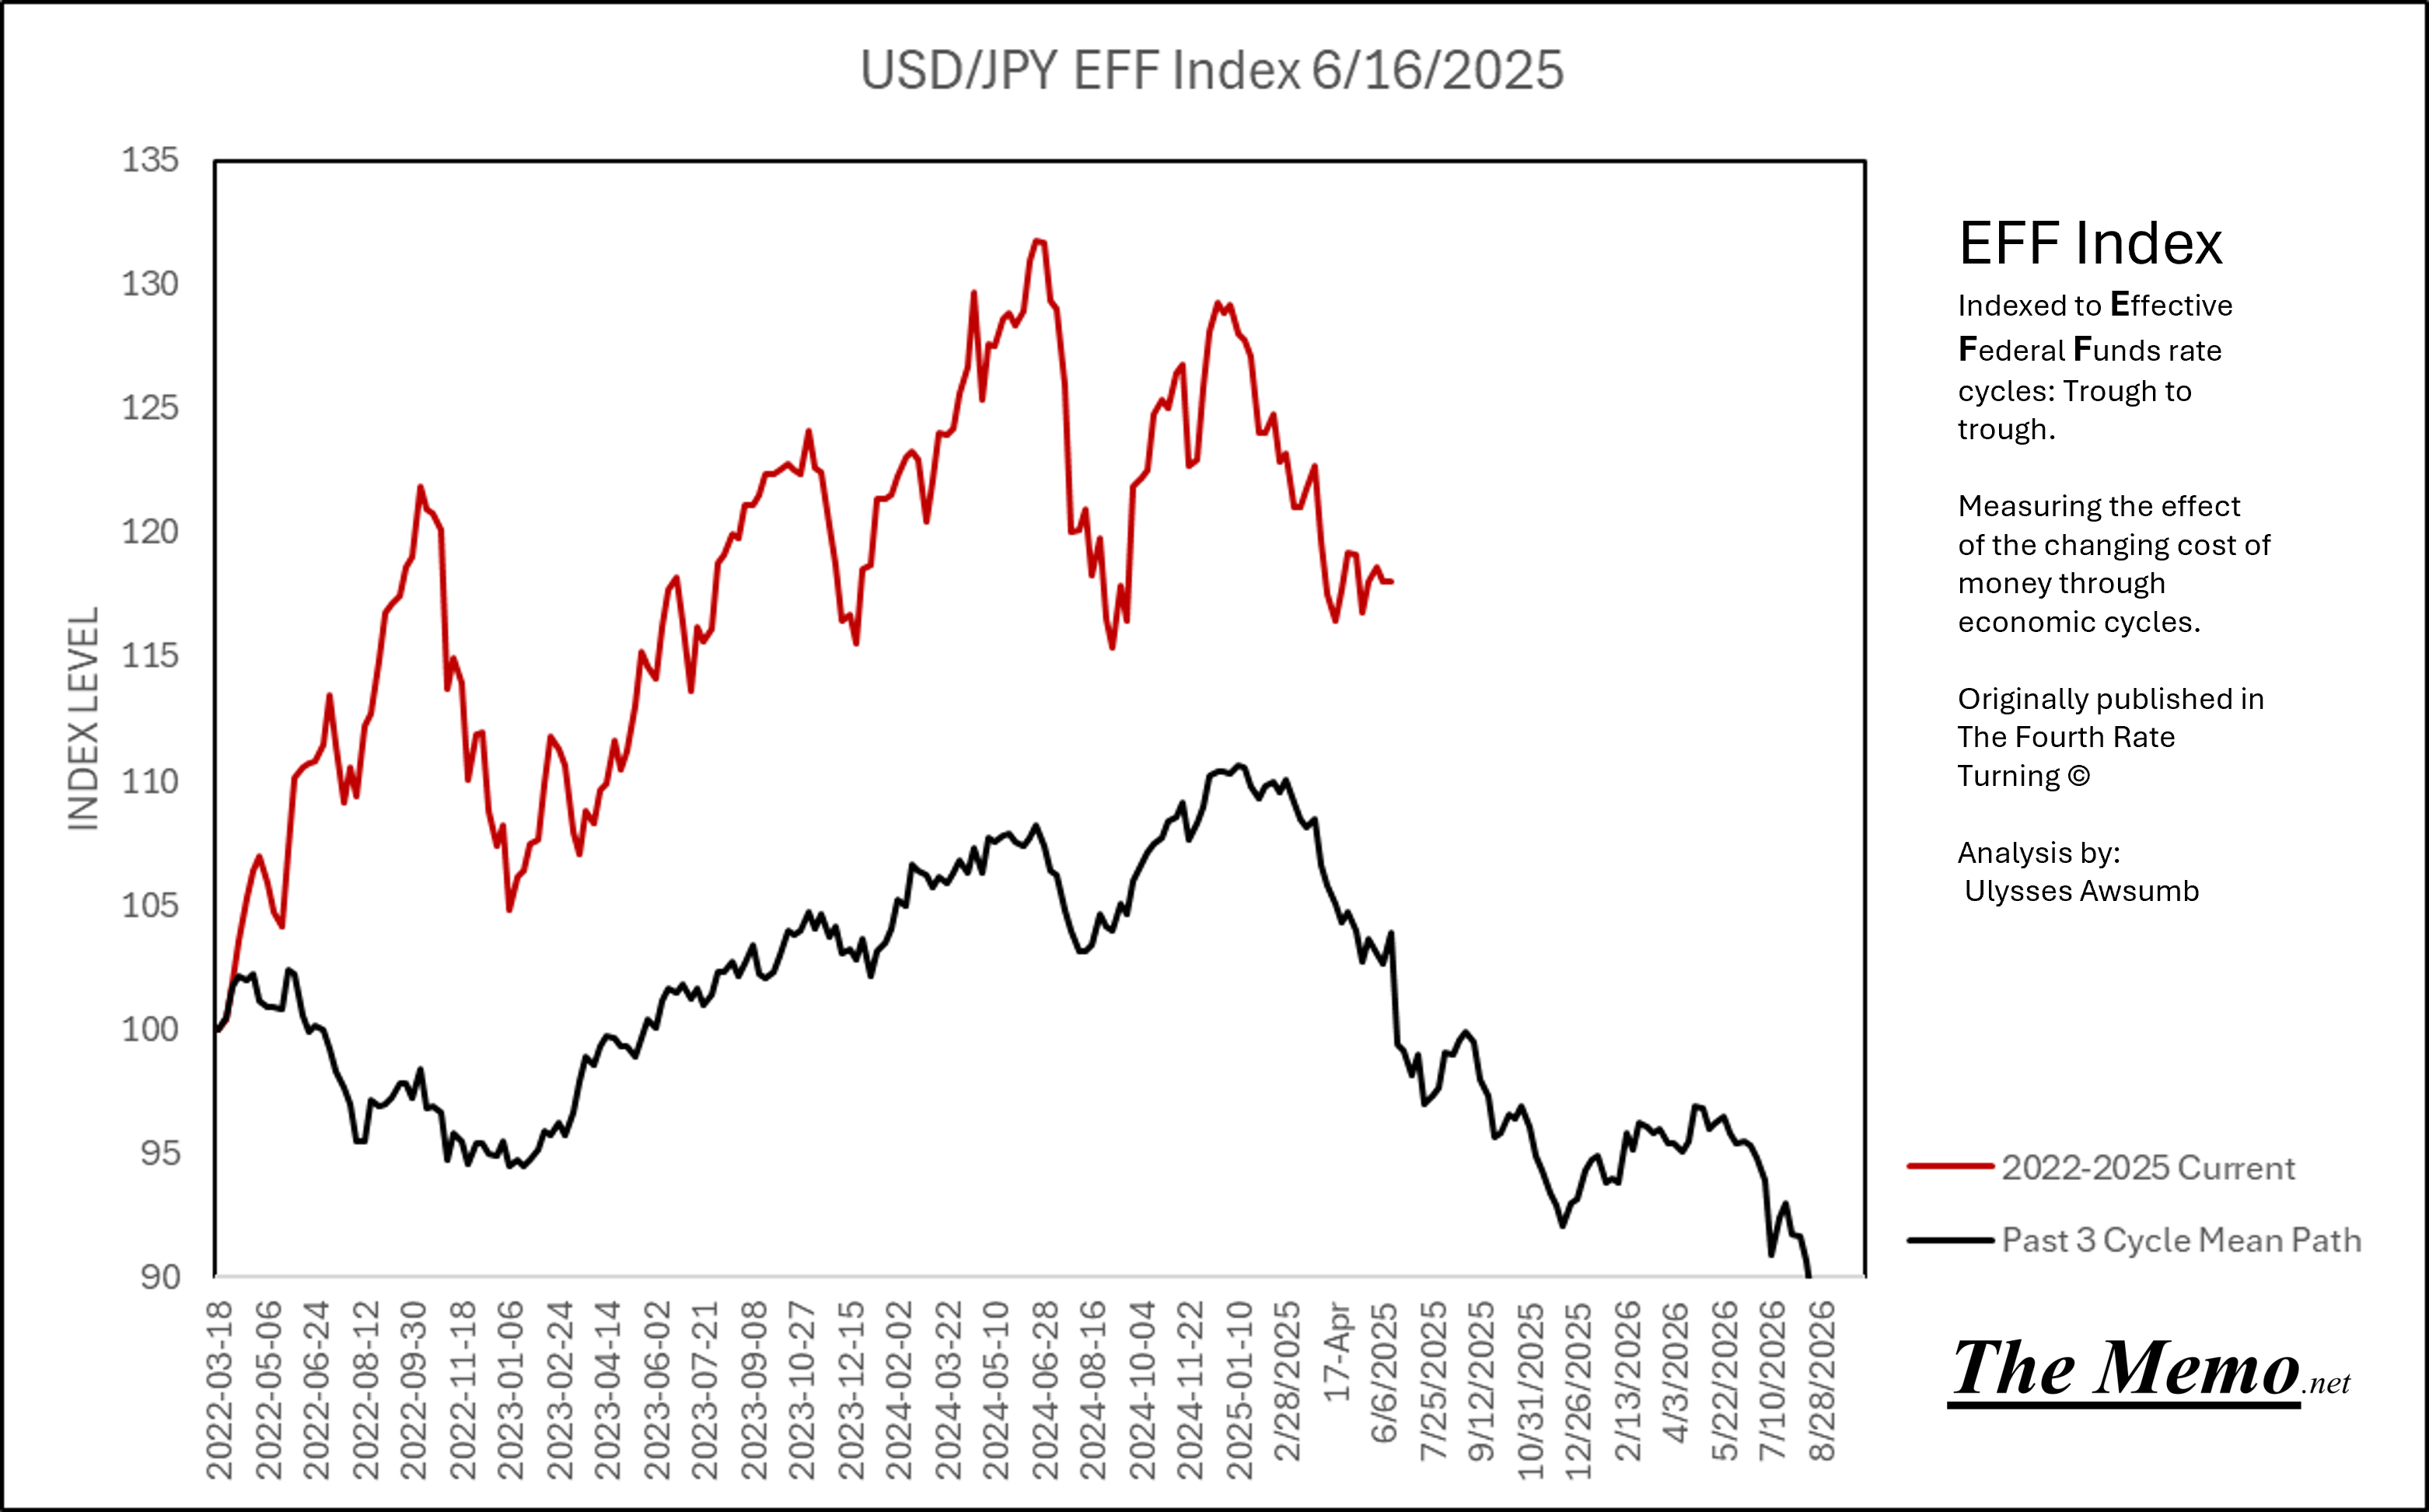
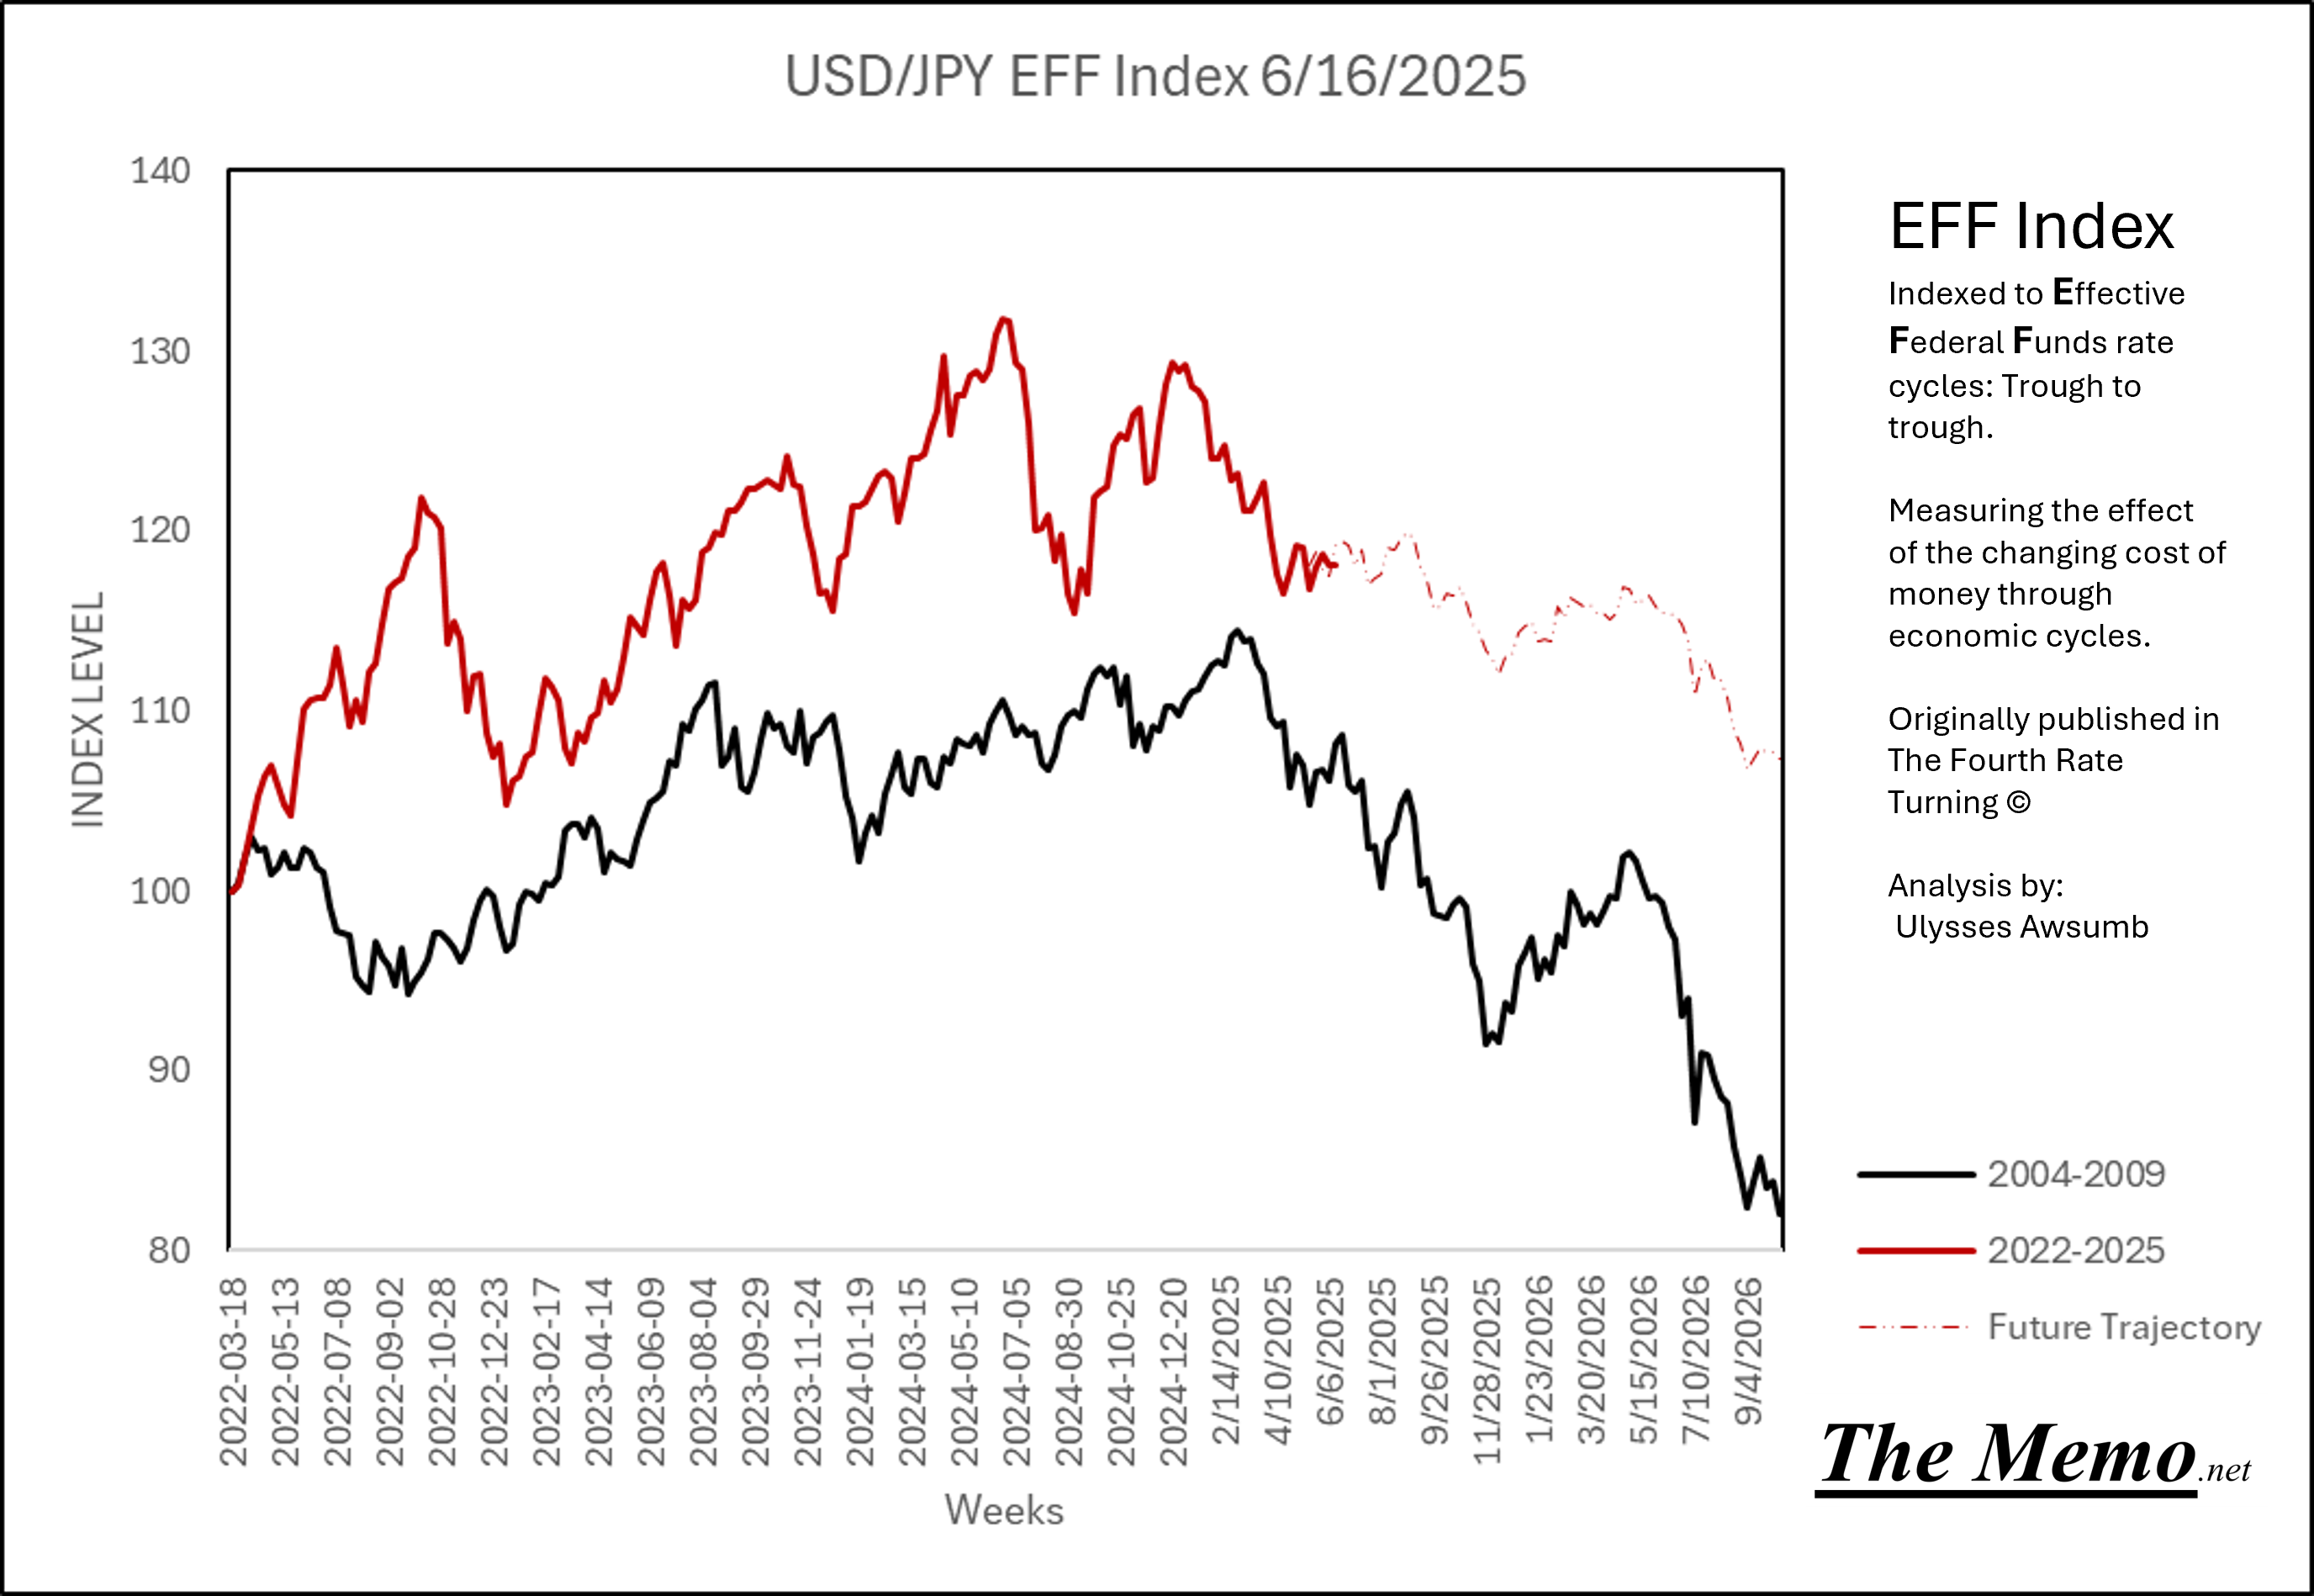
“Hey where did these carry trades come from?”
“Detroit”.
By the way, this exact pattern of the USD/JPY has been happening since Karate Kid hit theaters, which was coincidentally months before the Plaza Accord in which monetary policy was fiddled with to stop the rate of change of the USD to other currencies. Including the JPY.
Debt Ceilings. Hard Feelings.
Directionally….maybe.
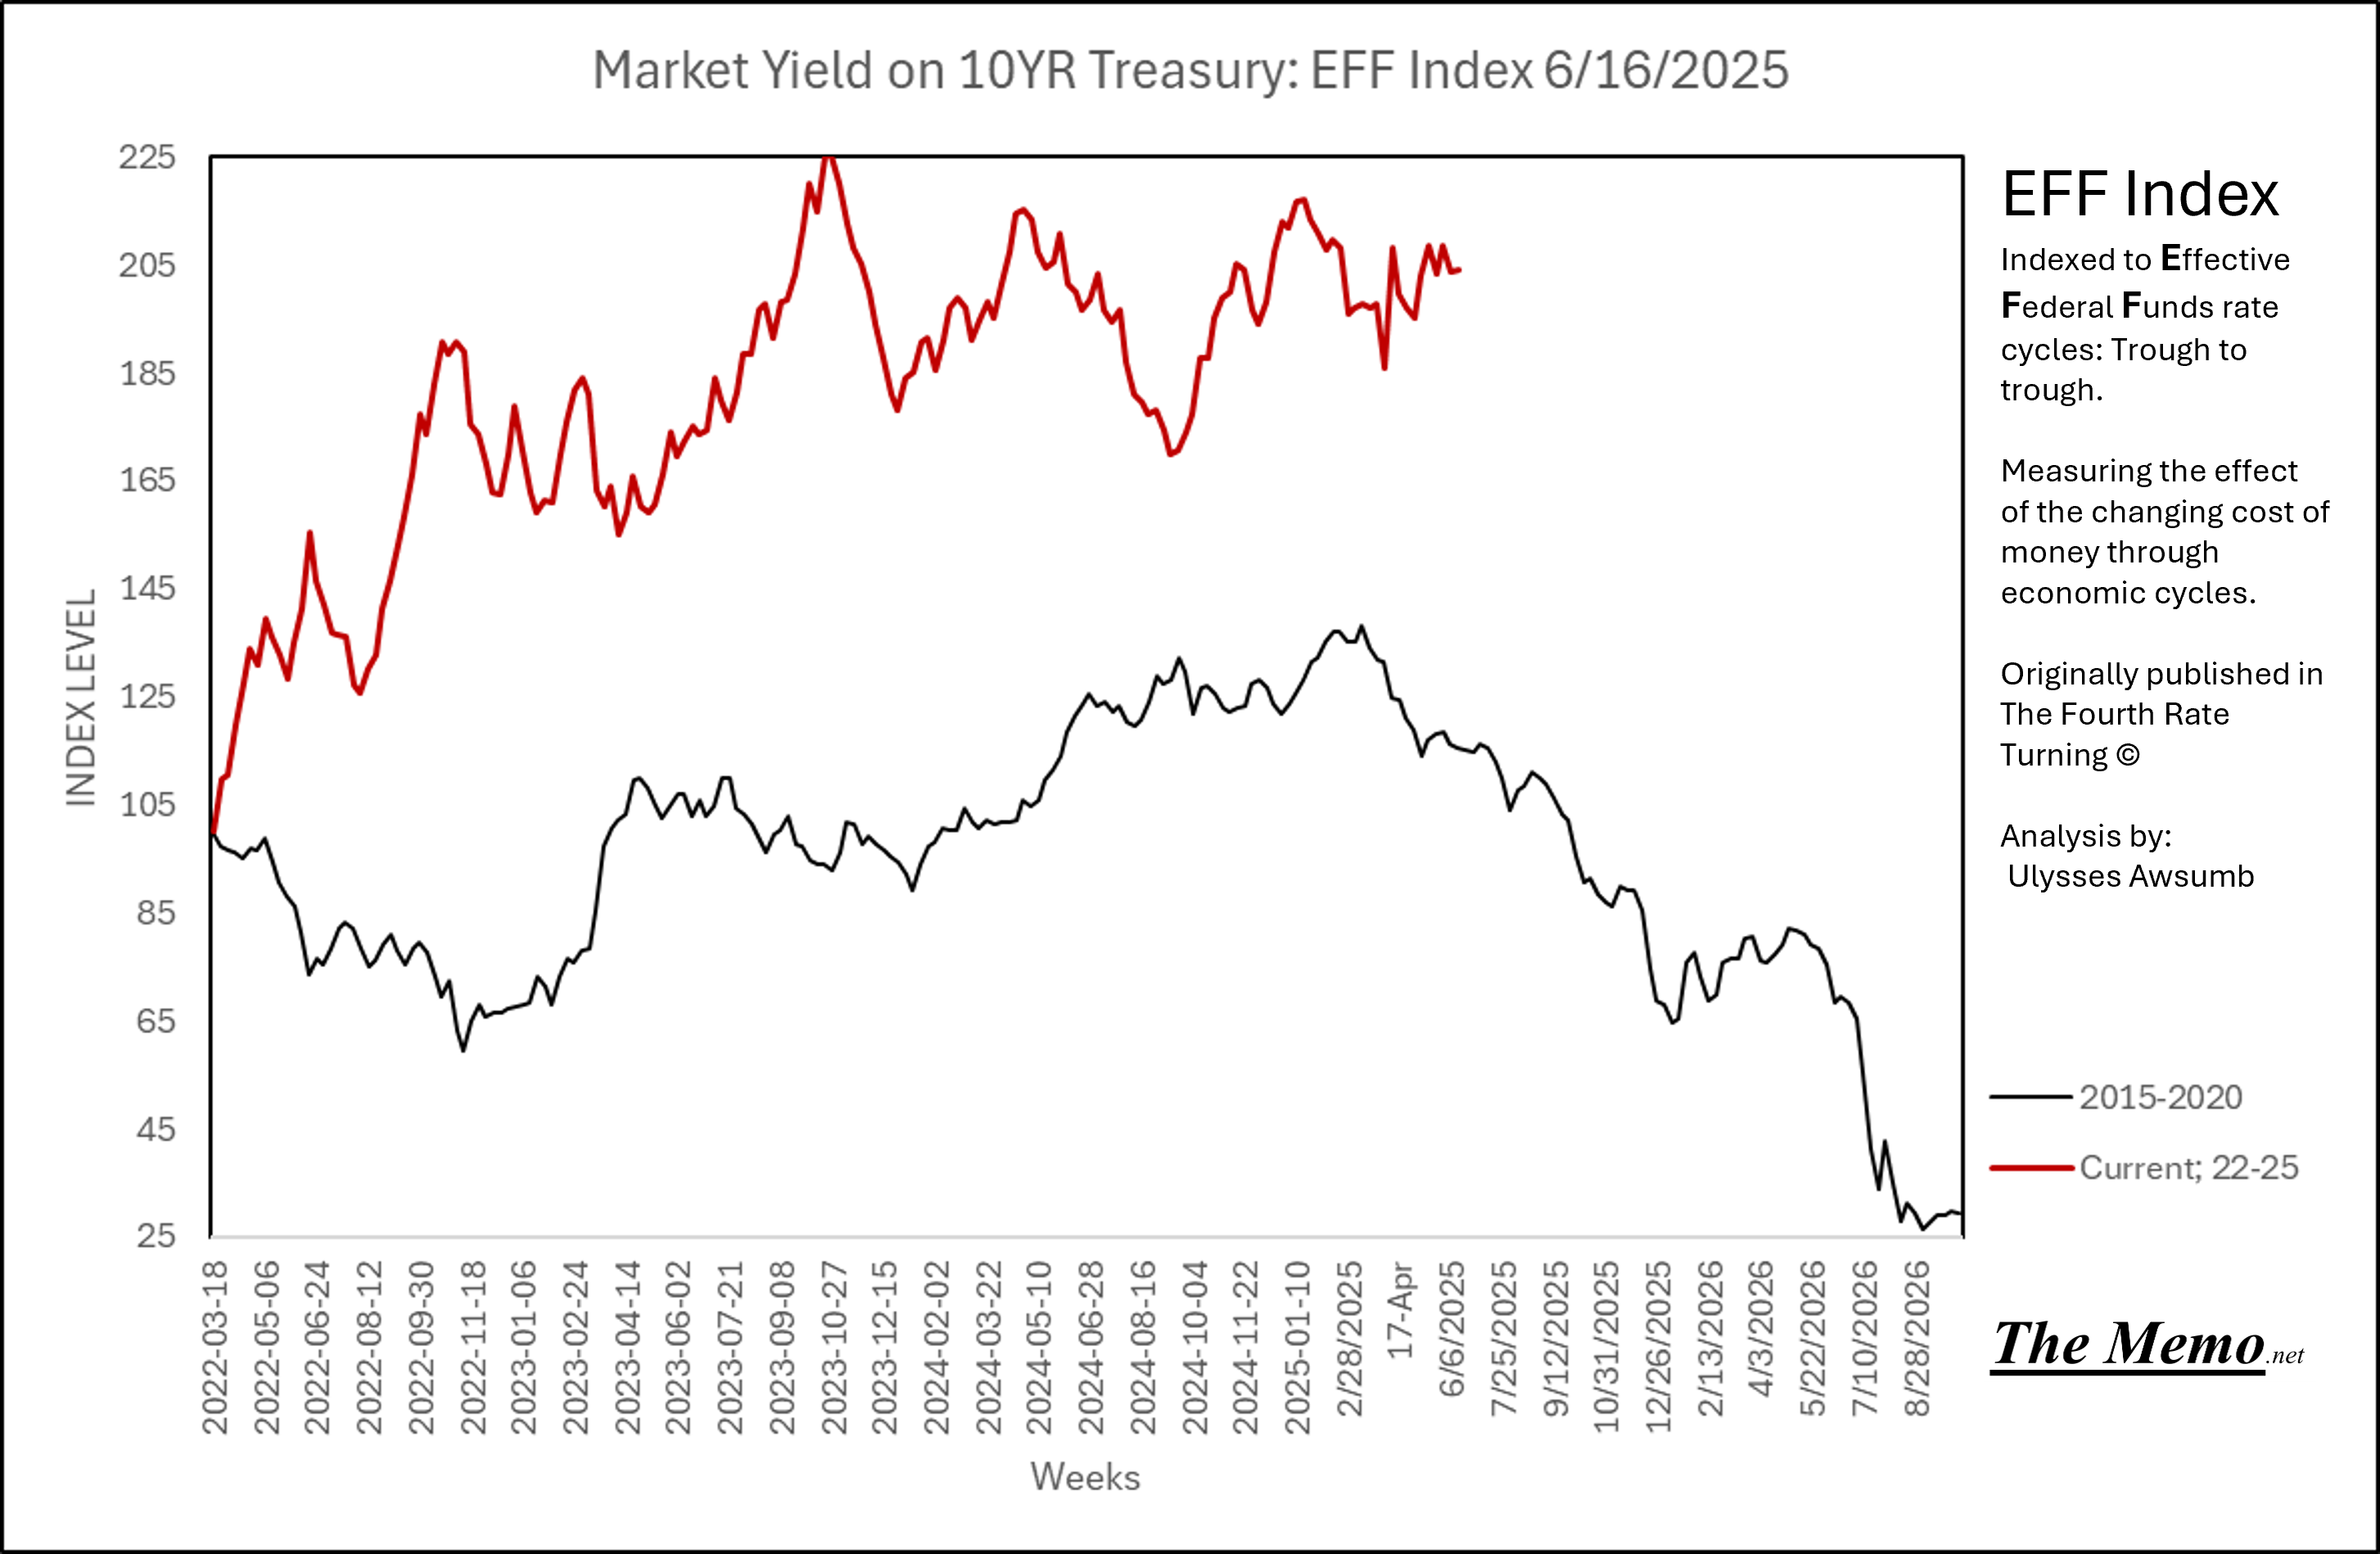
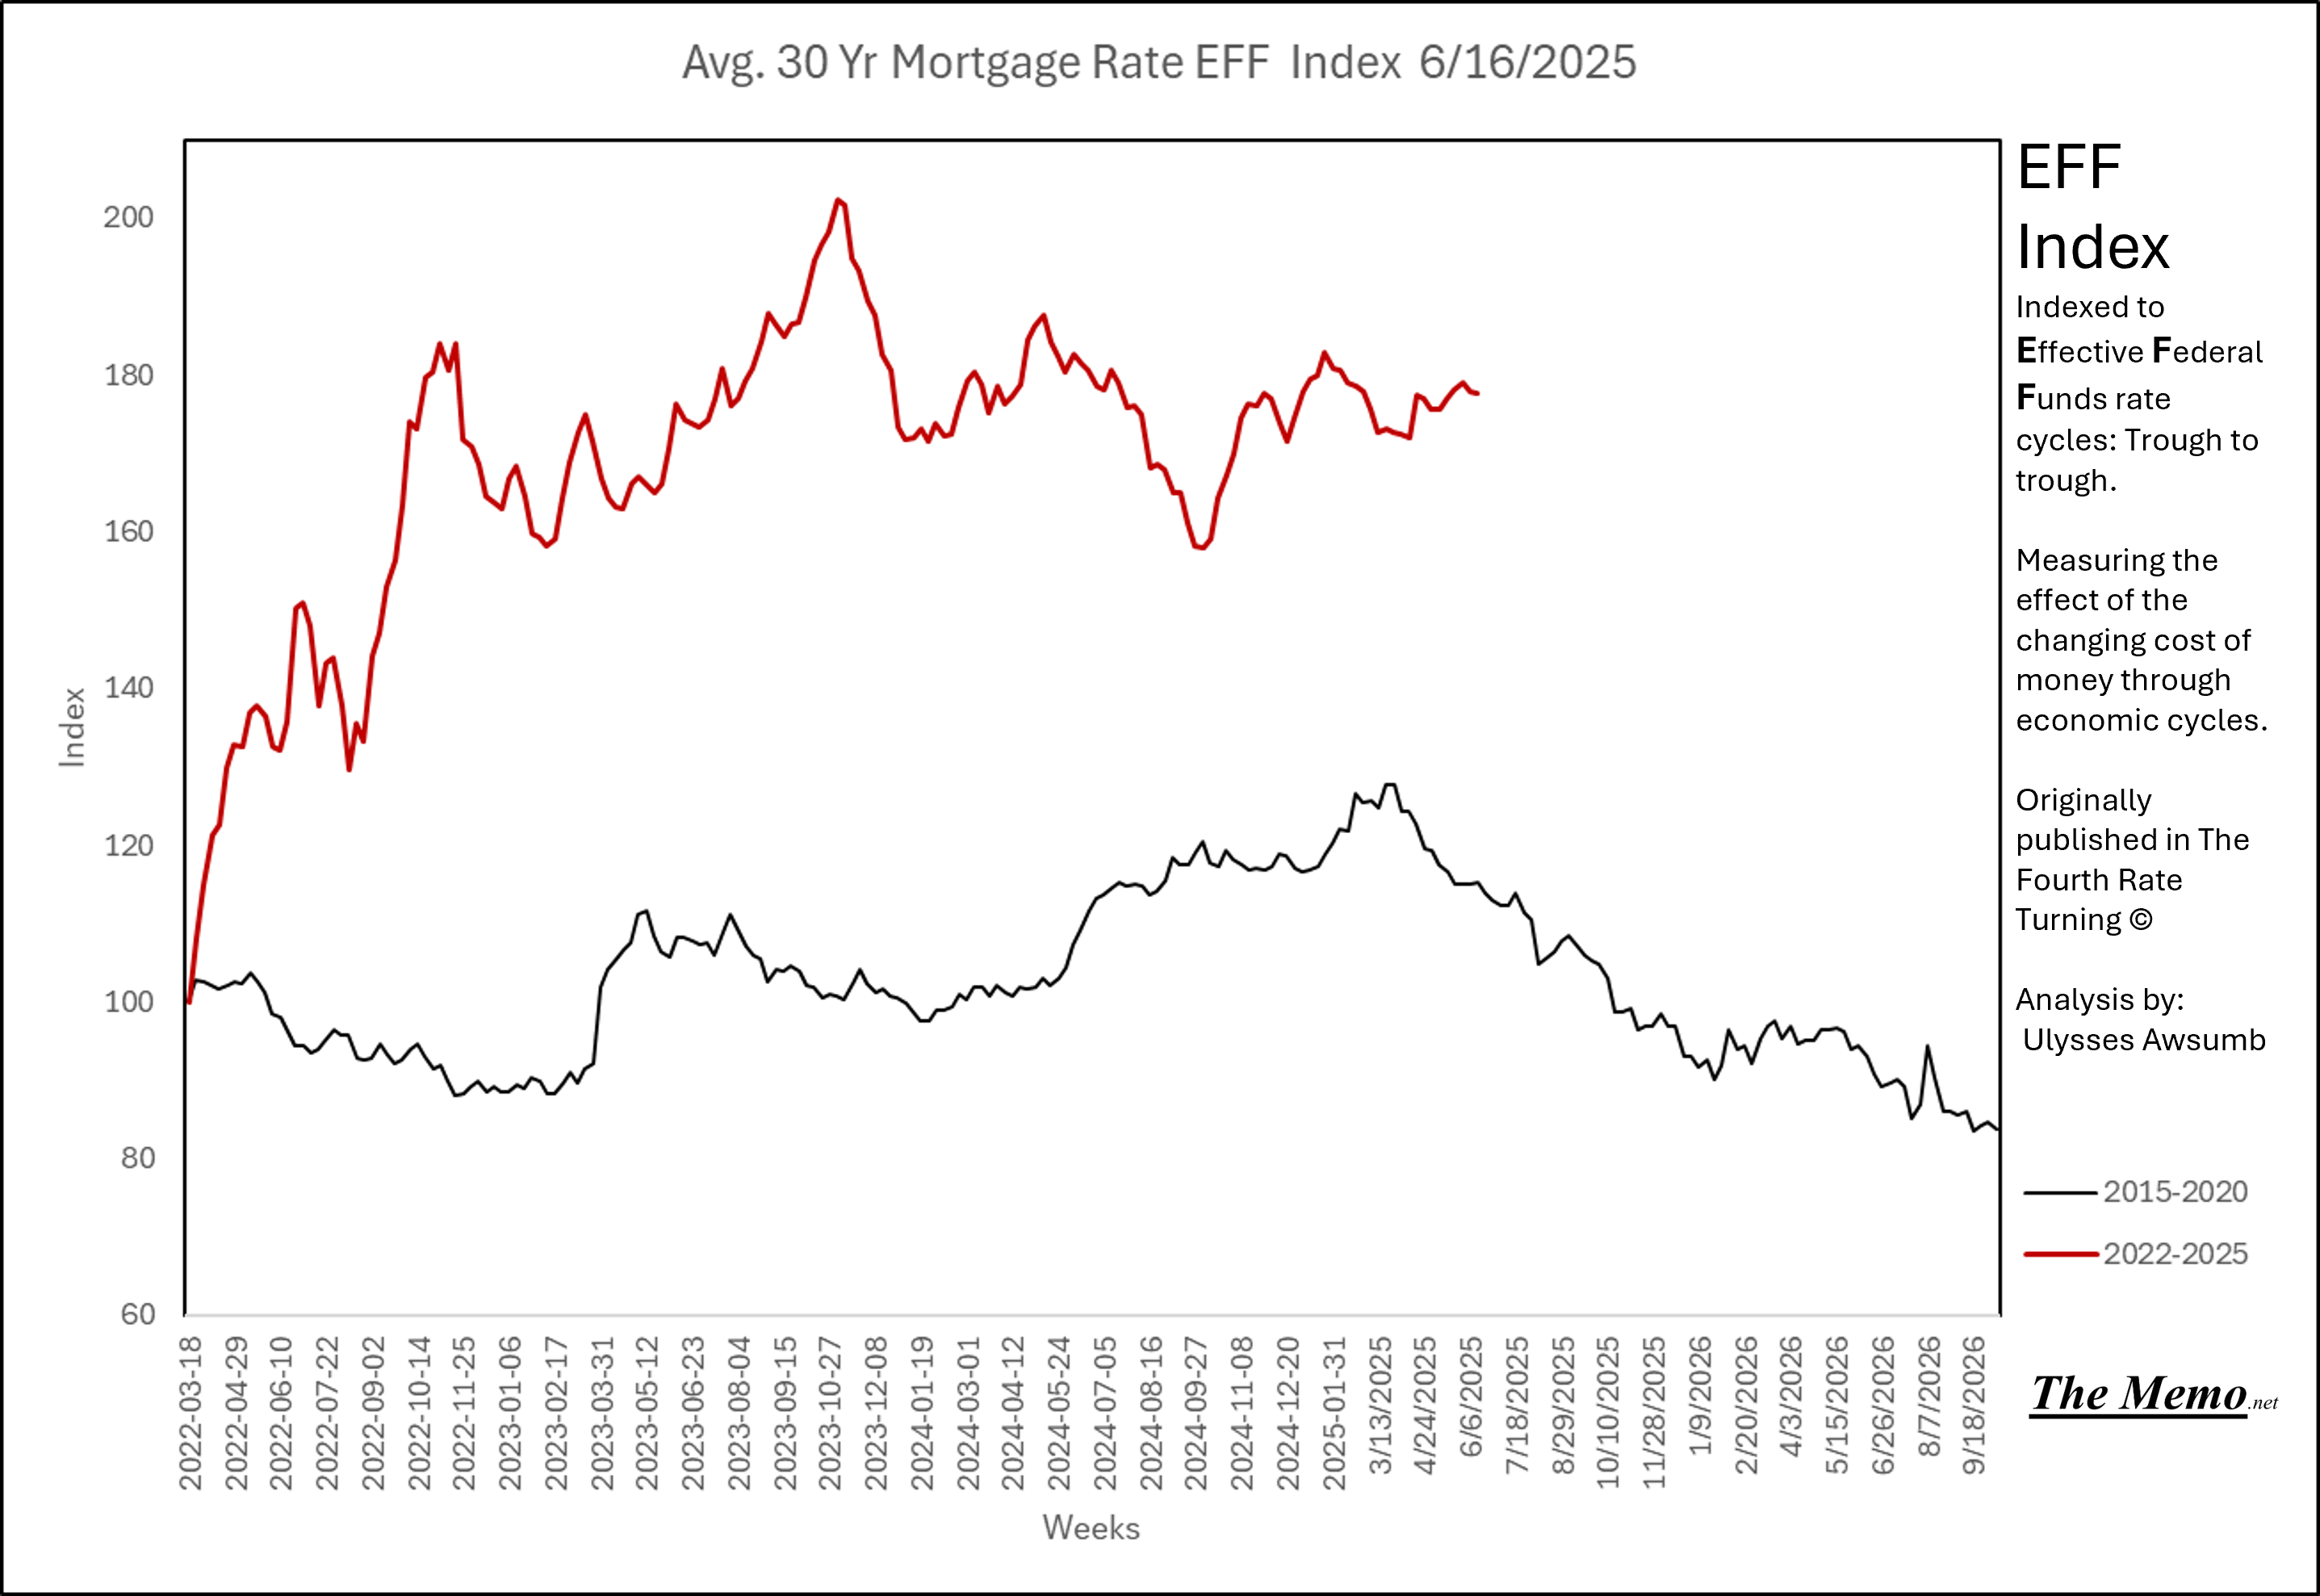
Mortgage Rates
Continue to be elevated.
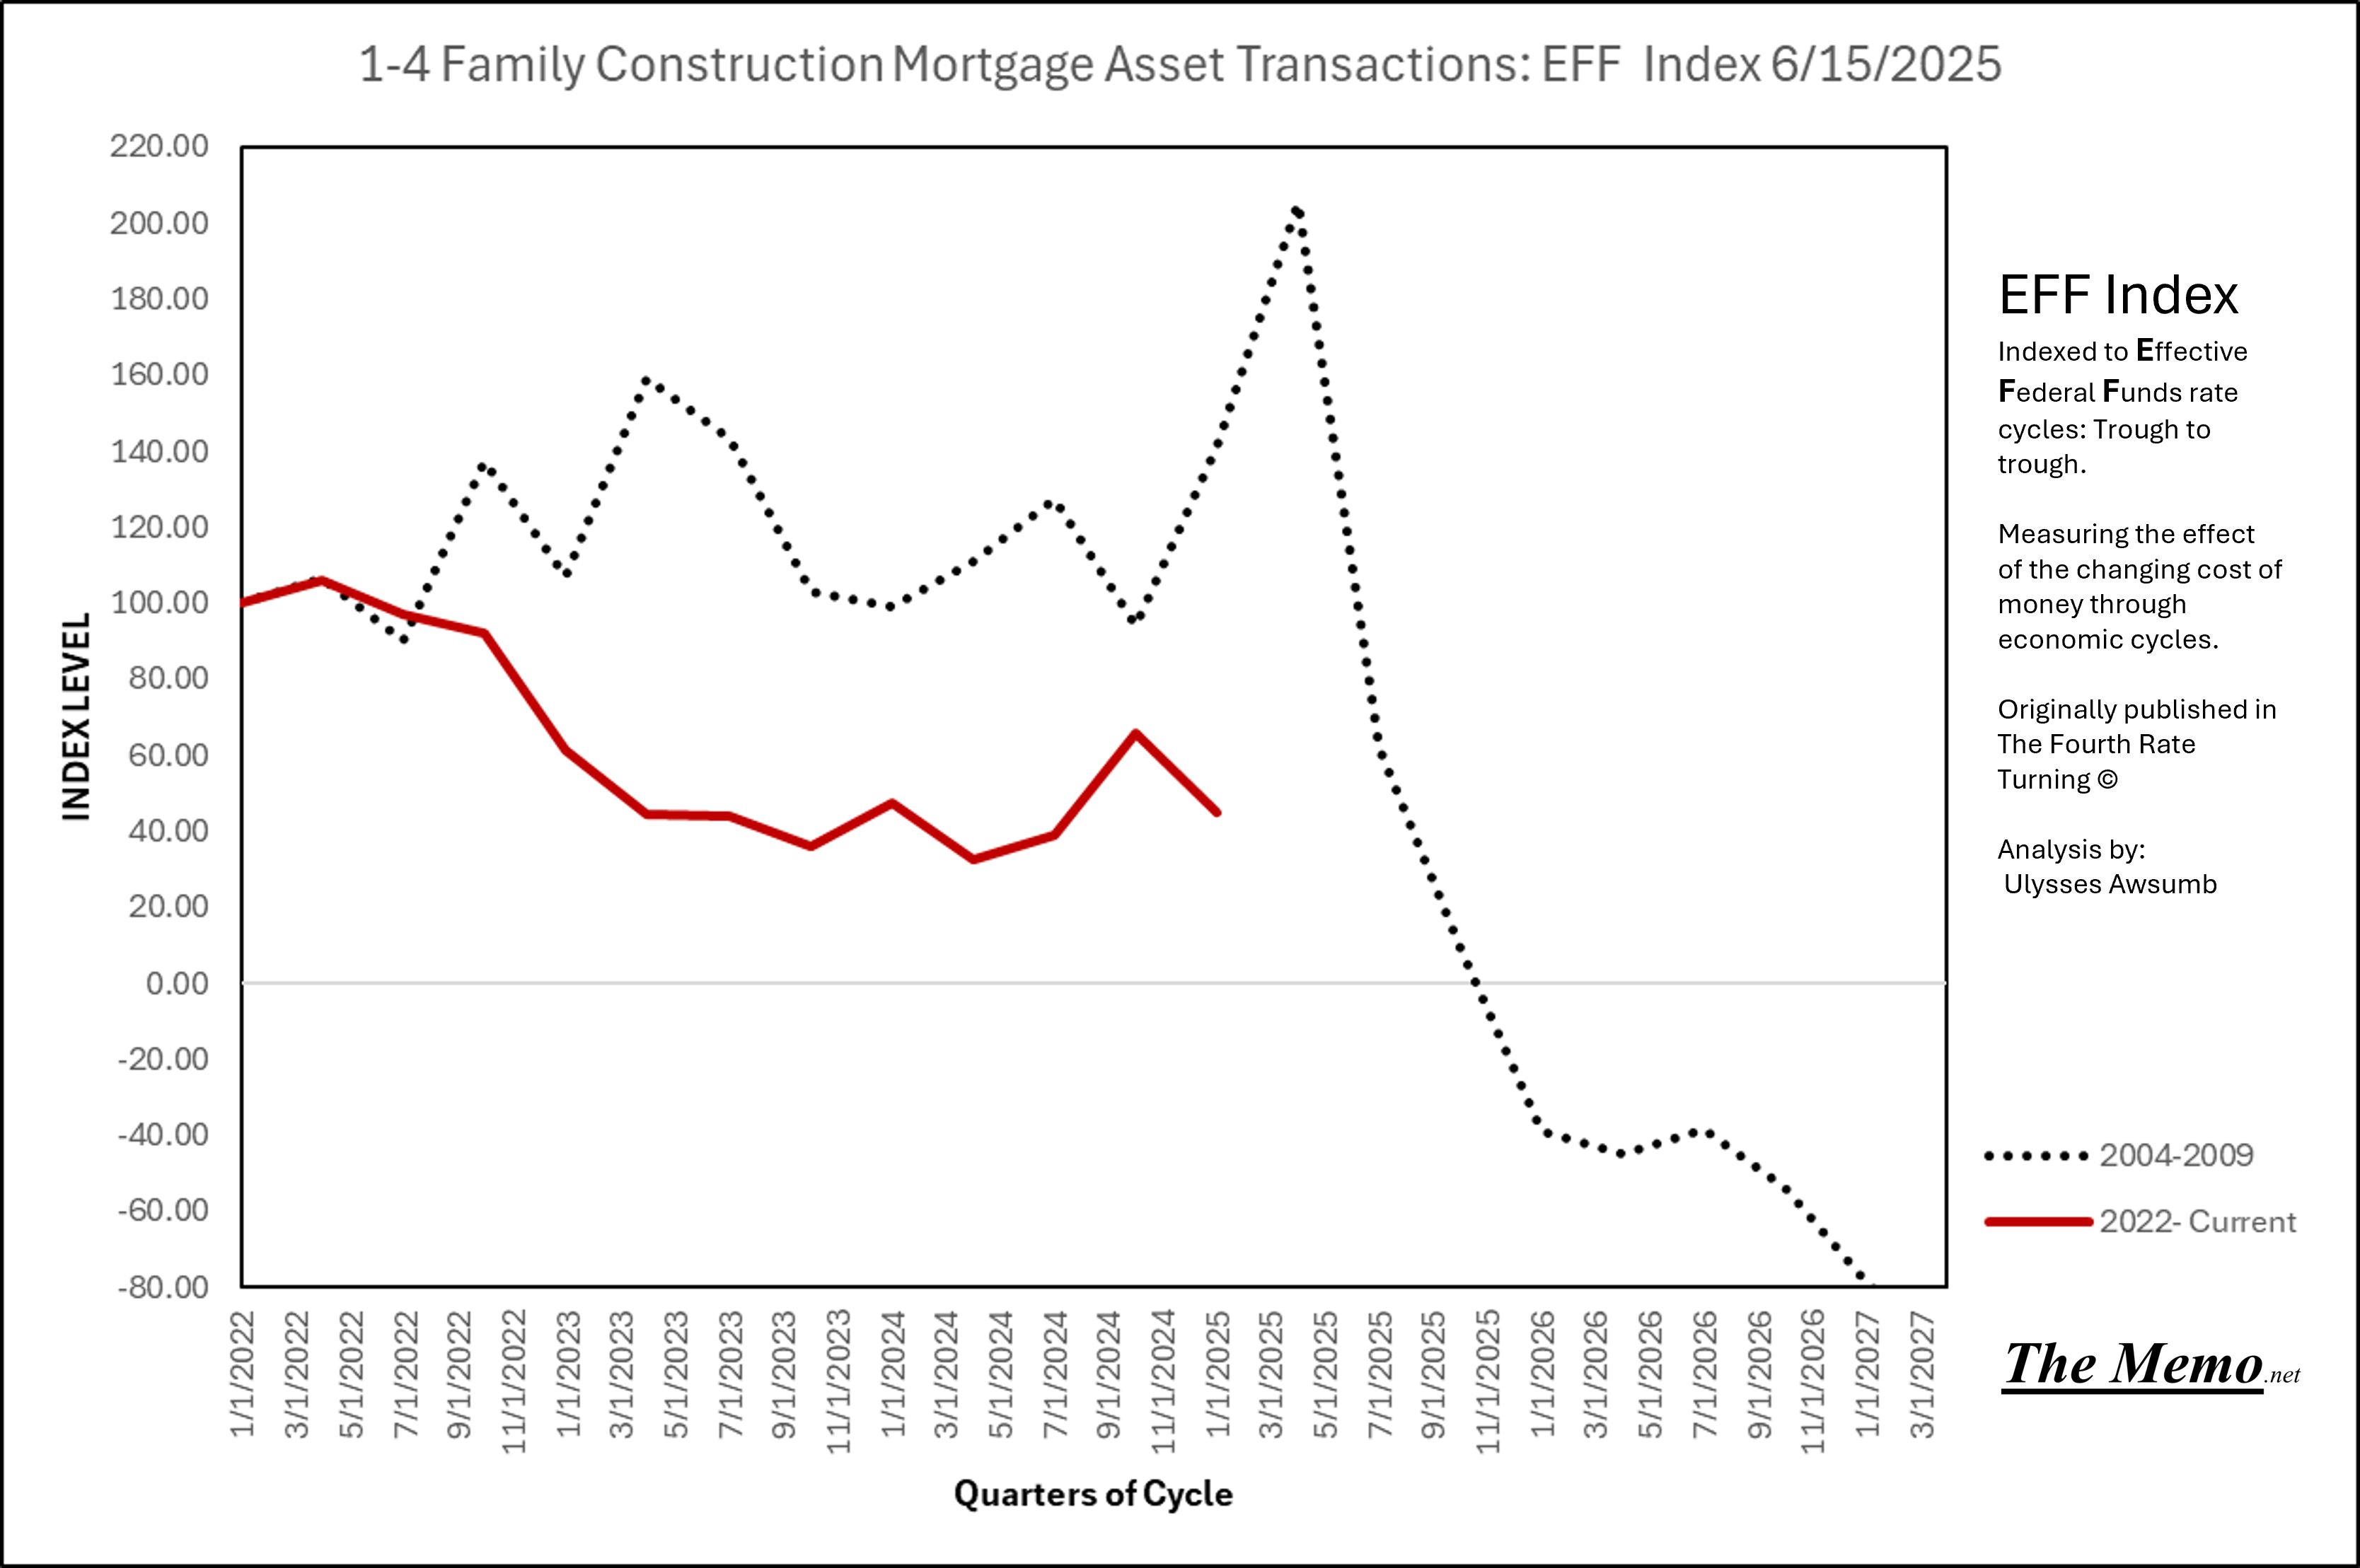
Mortgage Asset Transactions
Let’s put it all together in EFFing time shall we?
Commercial mortgage asset transactions are performing way worse than the 2004-2011 cycle. So close to negative.

Multifamily mortgage asset transactions are performing way worse than the 2004-2011 cycle.
Single family mortgage asset transactions are performing way worse than the 2004-2011 cycle.
Single family construction mortgage asset transactions are performing way worse than the 2004-2011 cycle.
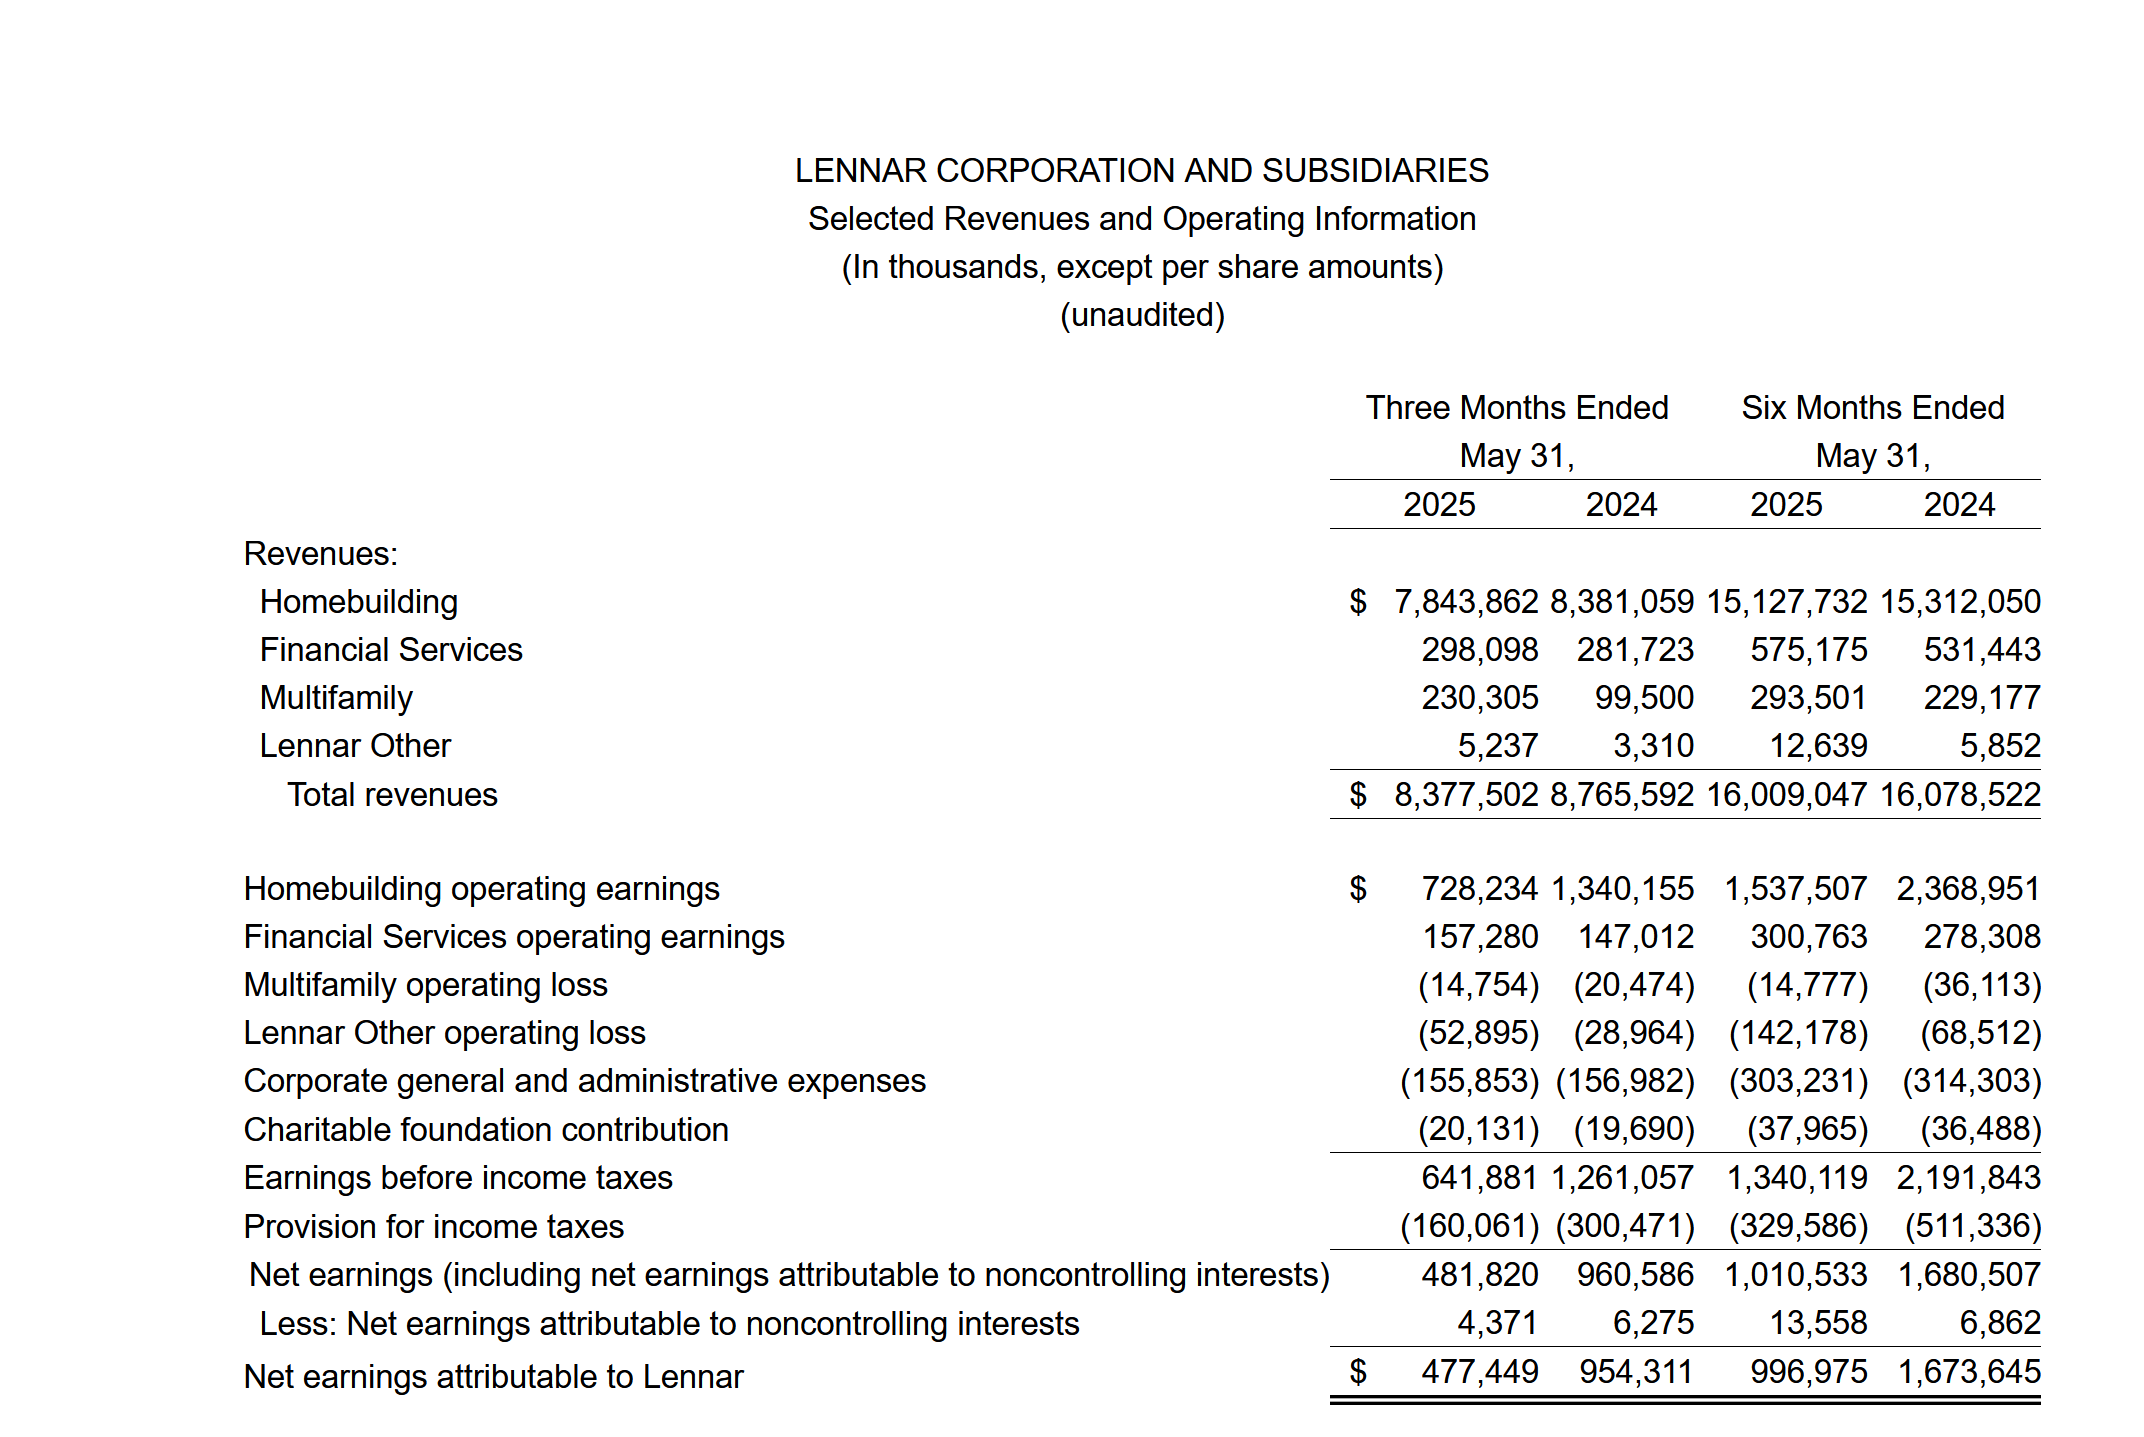
The weight is beginning to be felt. Lennar, the Nation’s 2nd largest Homebuilder just published their earnings for the Quarter ending May 31st (budget quarter not calendar).
Net Income is down 50% year over year, in the strongest selling season of the year.
Full Faith and Credit
The expansion of and contraction of credit has literally been the cycle(s) since they shot Kennedy.
Today in EFFing Time
(The exact past date in time, based on Effective Federal Funds rate timing of cycles)
It is:
3/8/2019
9/28/2007
7/26/2002 C.I.A.’s Special Activities Division was the first U.S. Forces team to enter Iraq, prior to invasion, to prepare for the upcoming “campaign”.
G.W.M.D4/5/1996
12/15/1989
4/25/1986
The 1980 Cycle was over
5/25/1979: Iranian Revolutionary Culmination: following Khomeini’s return in February, and the Islamic Referendum in March, April saw the drafting of the new constitution of Iran’s current government. May brough about a new Iran. By the end of the 1979, 66 US citizens were held hostage, 52 of them for 400+ days and the U.S. Embassy in Tehran had been seized. Operation Eagle Claw failed to save hostages, and lead to the death of 8 U.S. Service members. Iran would deliver the remaining hostages minutes after Ronald Reagan was sworn into office.
This memo has been brough to you by: