Date: April 5th 2026
Time: 6:45pm

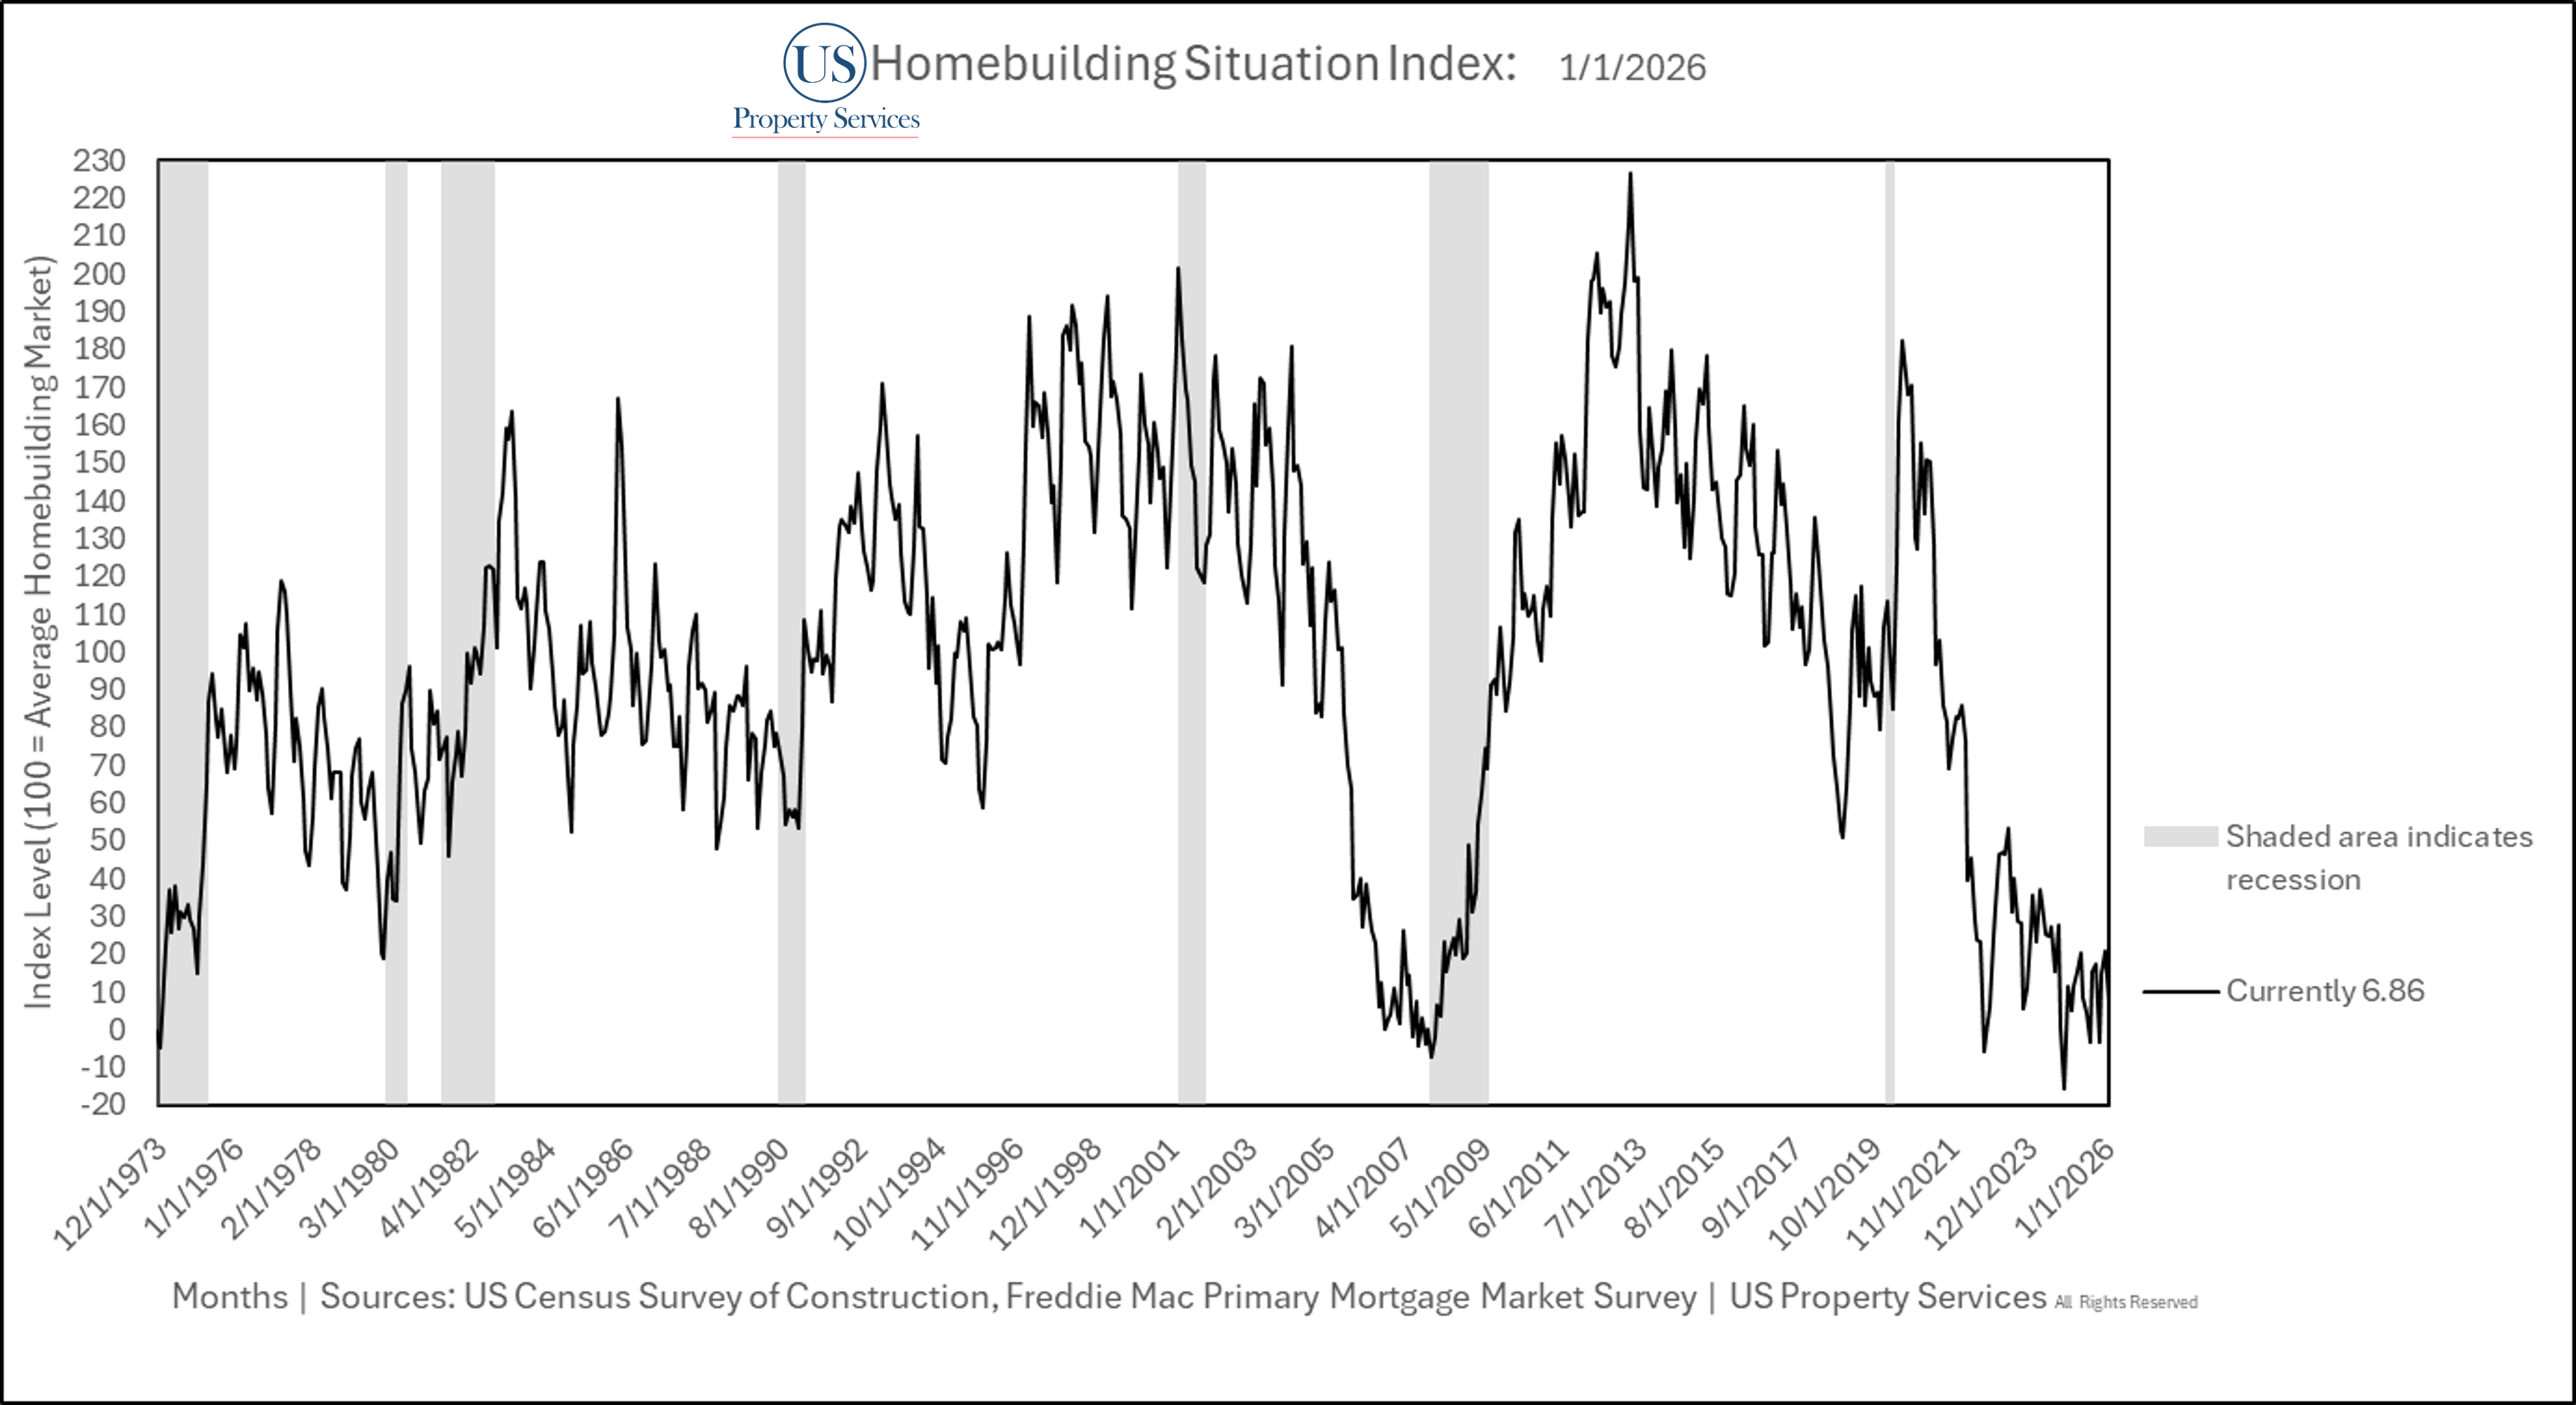
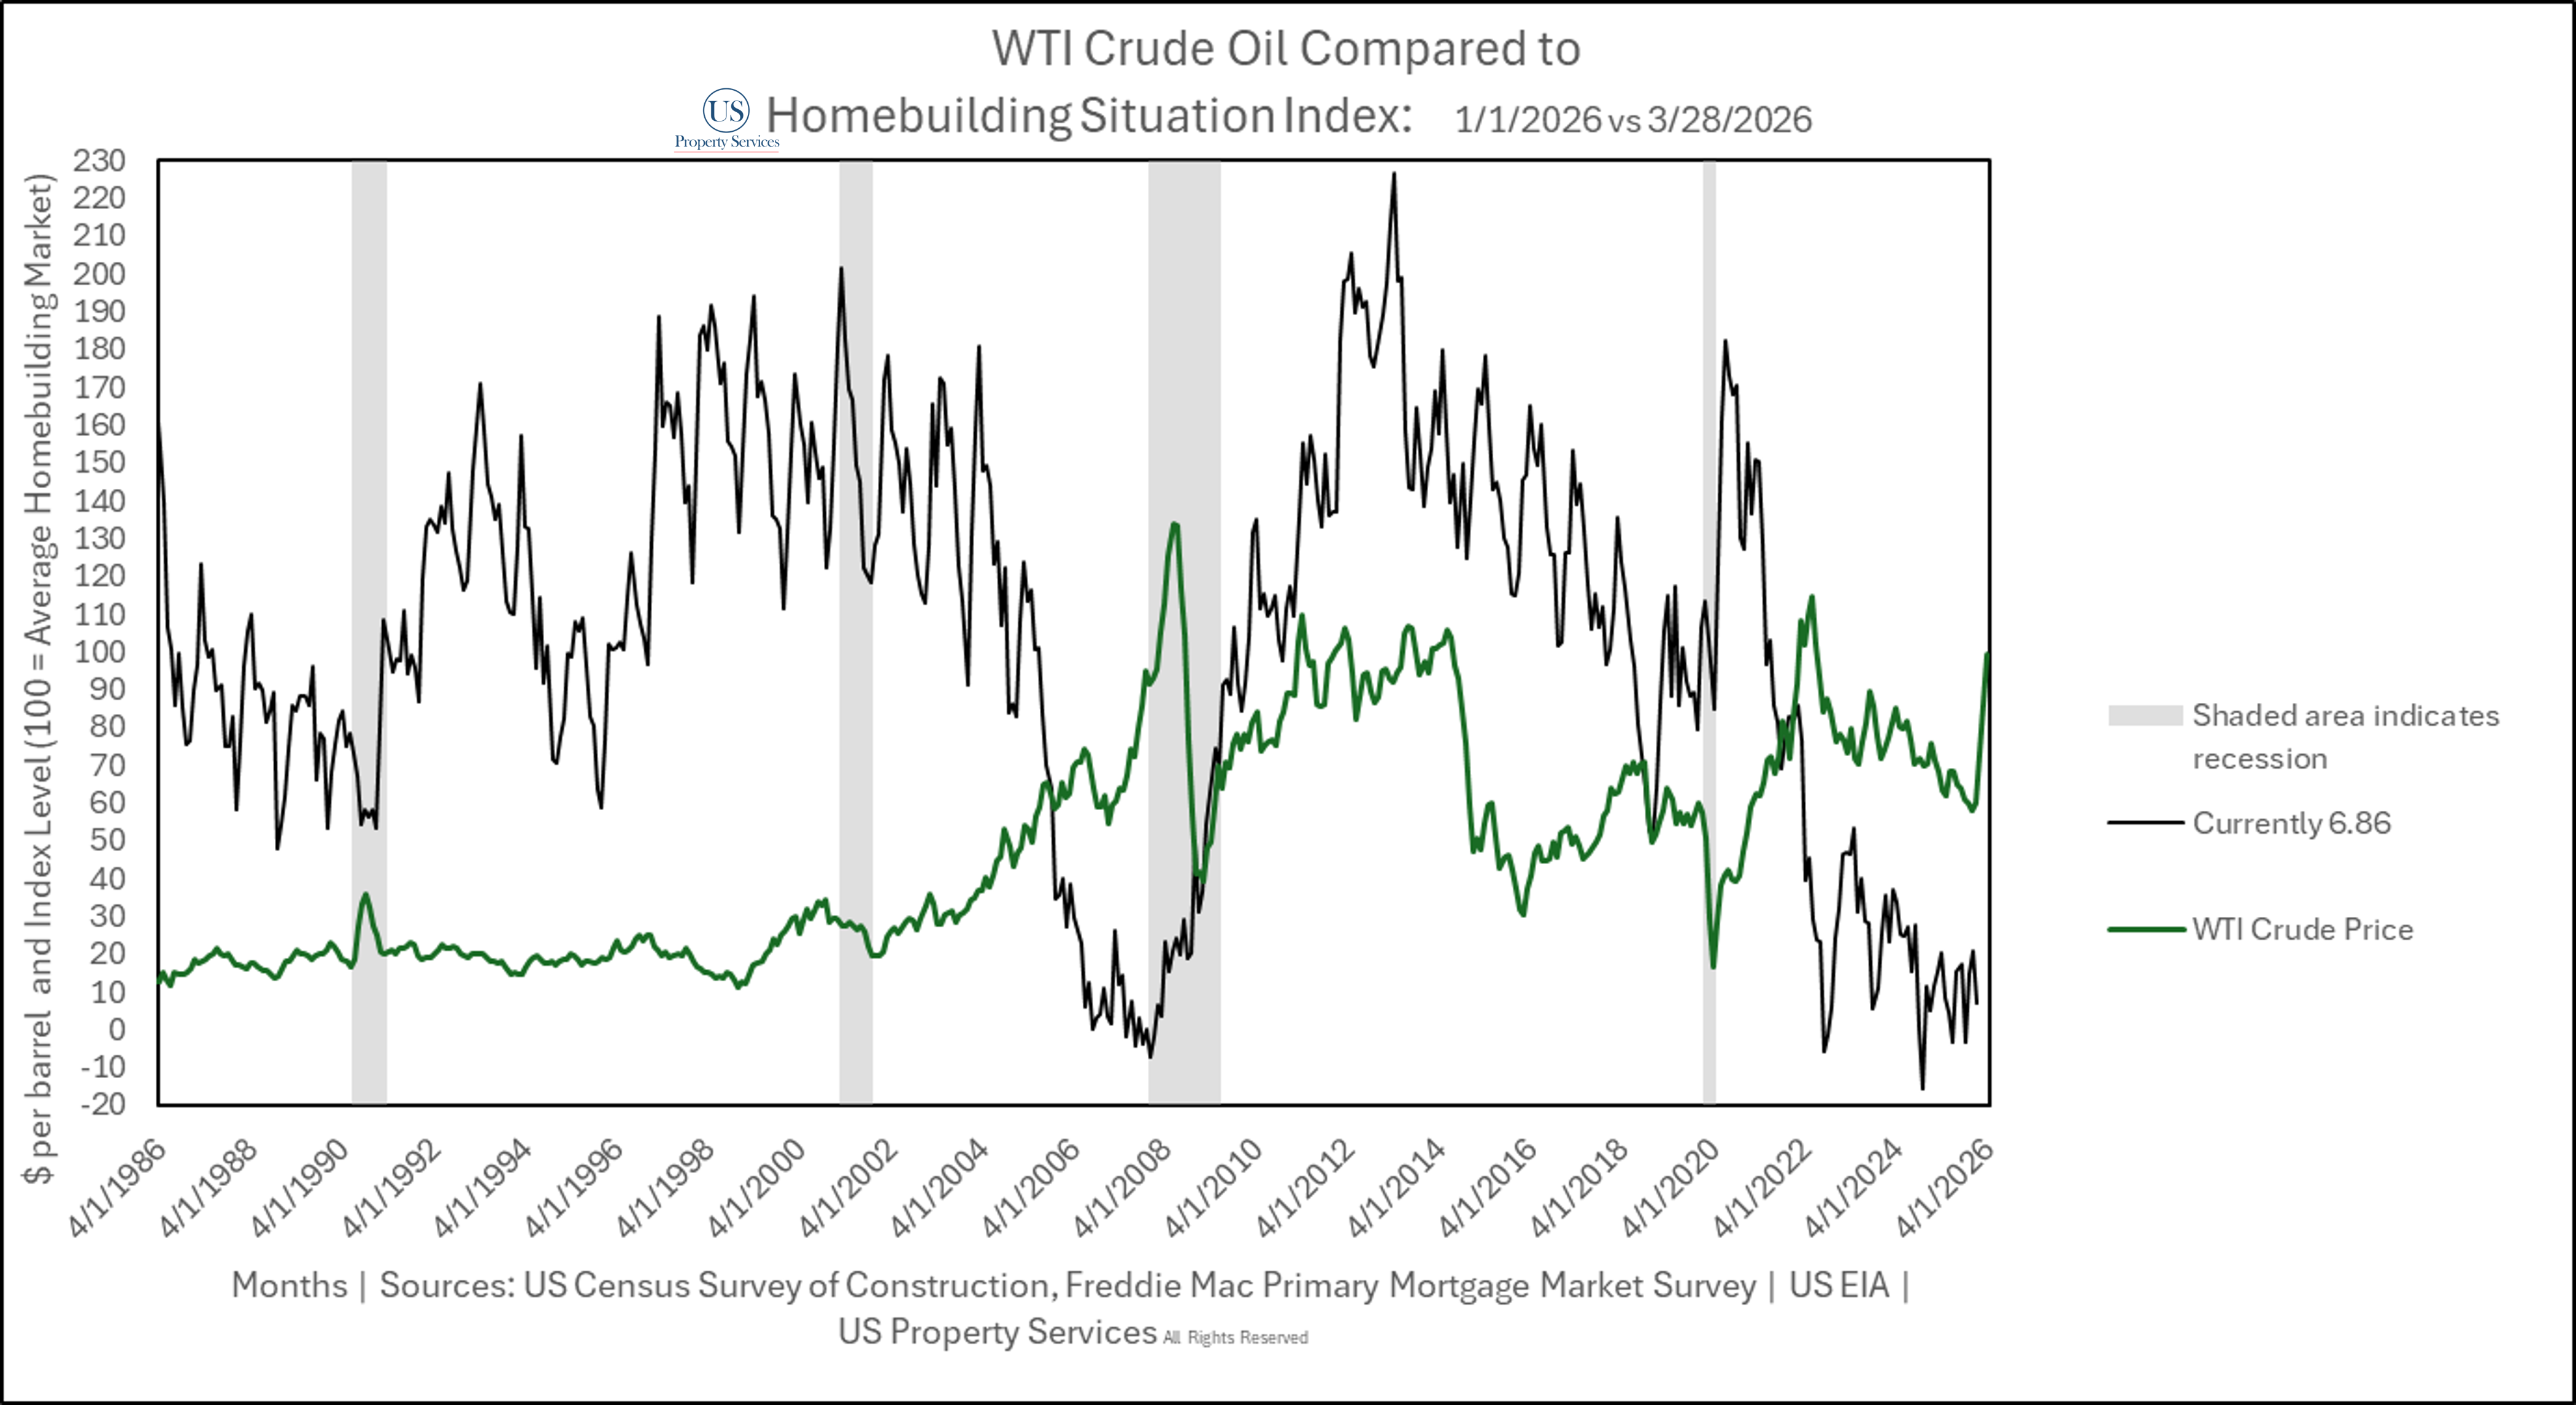
The Homebuilding Situation (Composite index measuring sales, inventory, price and mortgage rate direction change) Nationally from January (March Release) 2026 stands at 6.86 This is 93.14 points below the Average Situation for Homebuilders. The situation decreased by >13 points.
Regionally:
Northeast Census Region stands at 134.4
Midwest Census Region stands at 69.86
South Census Region stands at -16.6
West Census Region stands at 25.63
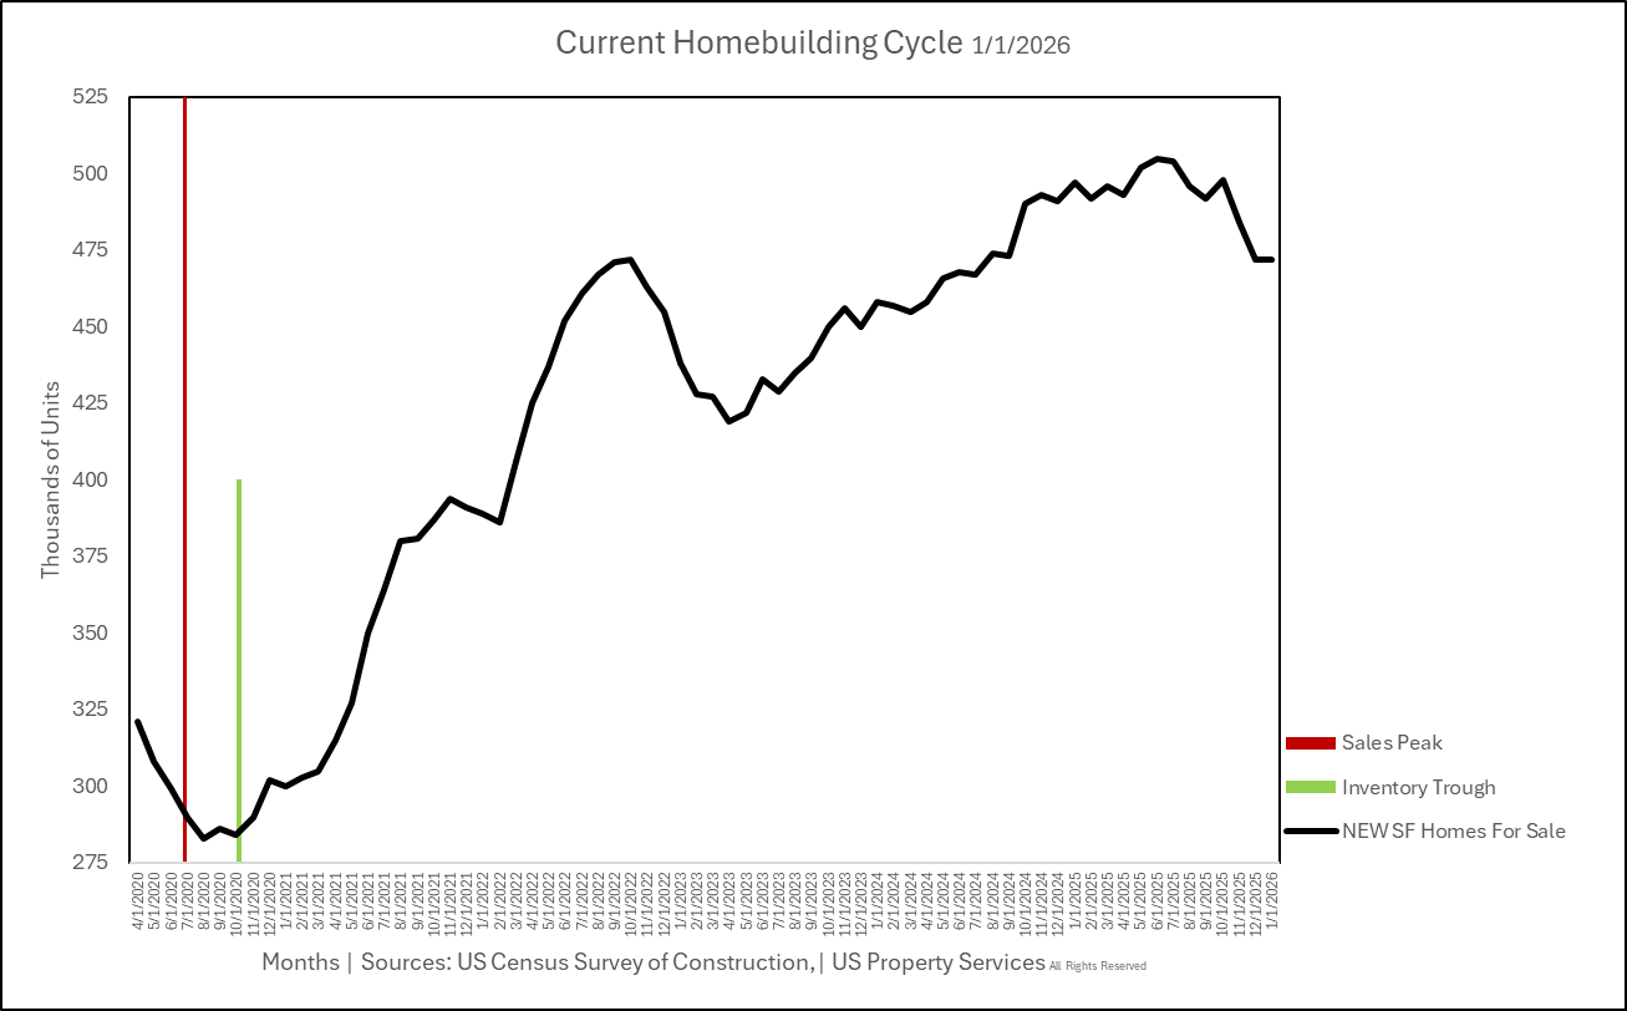
Sales
January sales fell to 48,000 units sold from 55,000 in December. 7,000 less than the average monthly sales rate across the last 52 years. January sales were down >-14% year over year.
Inventory
There are 472,000 new single family homes for sale . No change over the past month (revised). The past 18 consecutive months have been revised to remain range bound. Despite the 23% increase in Spec Homes for sale during the same time period.
Price Direction
Median Sales Price decreased year over year by -6.7%. The Median Sale Price for a New Home was $400,500. Prices have been declining for 40 months going back to October 2022.
Mortgage Rates
Mortgage rates decreased by -1.4% month over month. January’s average 30yr Fixed Mortgage Rate was 6.1%..
Additional Commentary:
This report contains builder earnings analysis, per share analysis of publicly traded builders, Lennar Earnings analysis, home price component breakdown and Crude Oil + Diesel price impact on new home sales. Comments and charts for those are below the Situation Component Charts (Figures 2-8).
Fig. 2
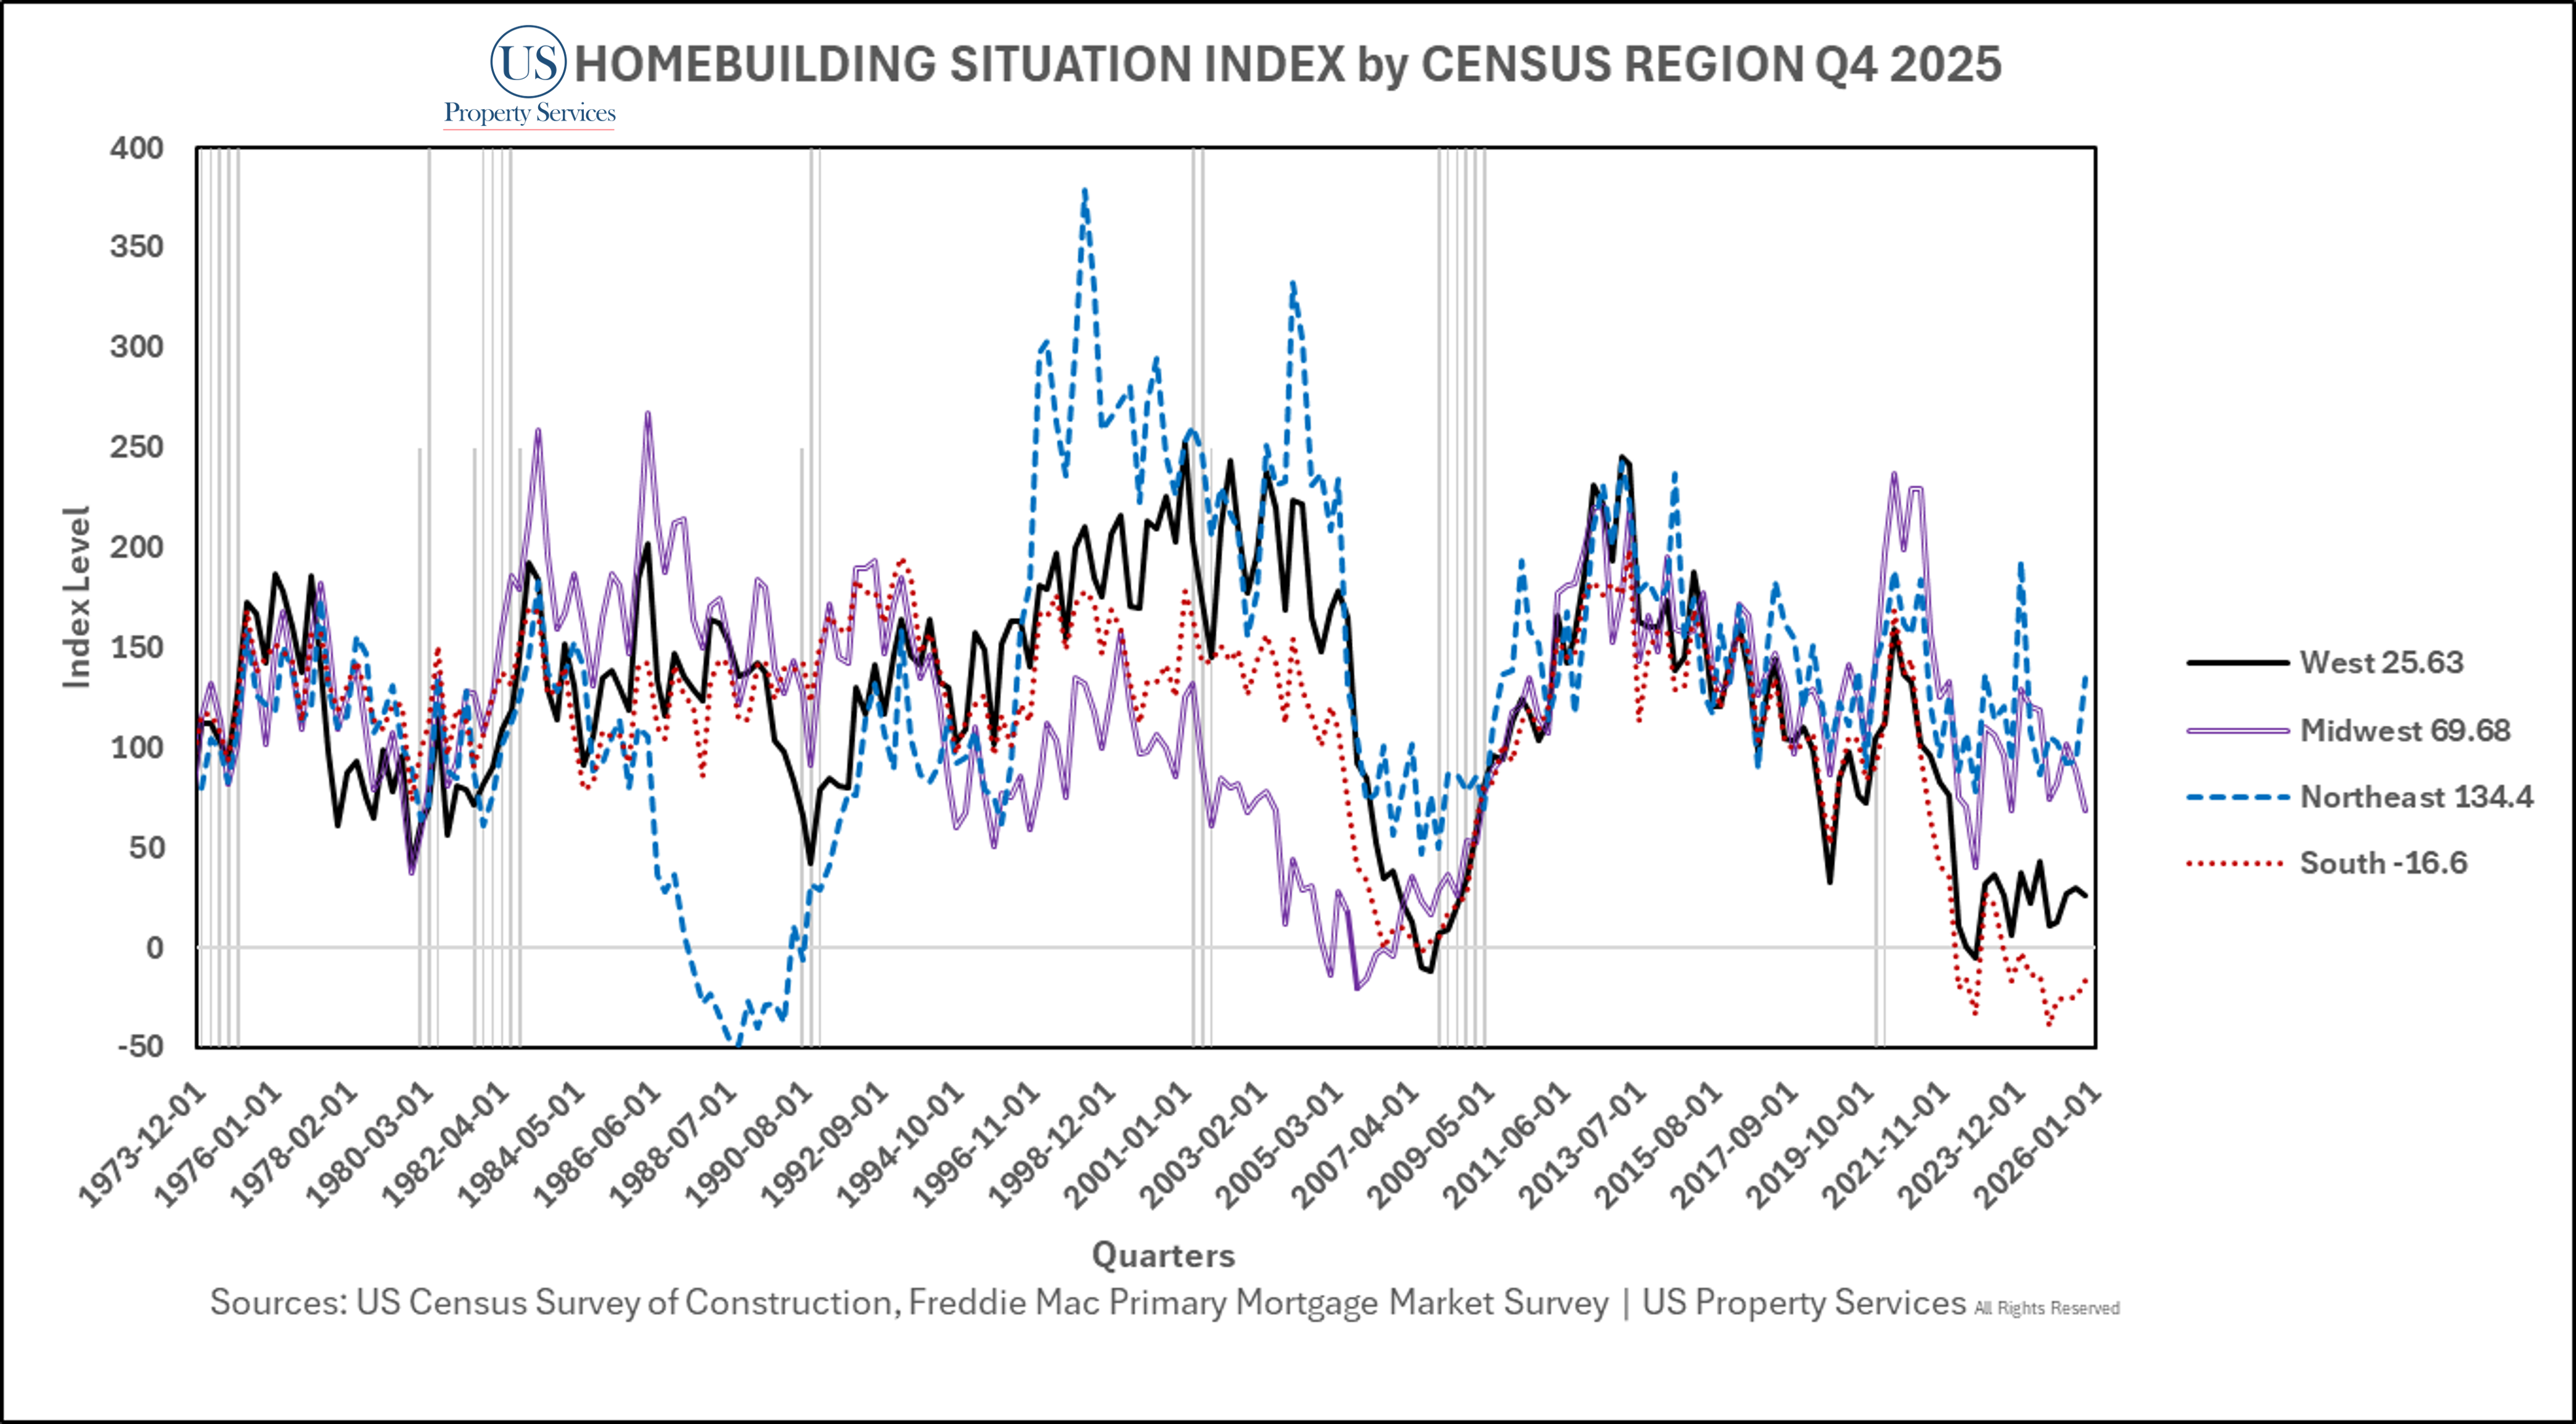
Fig. 3
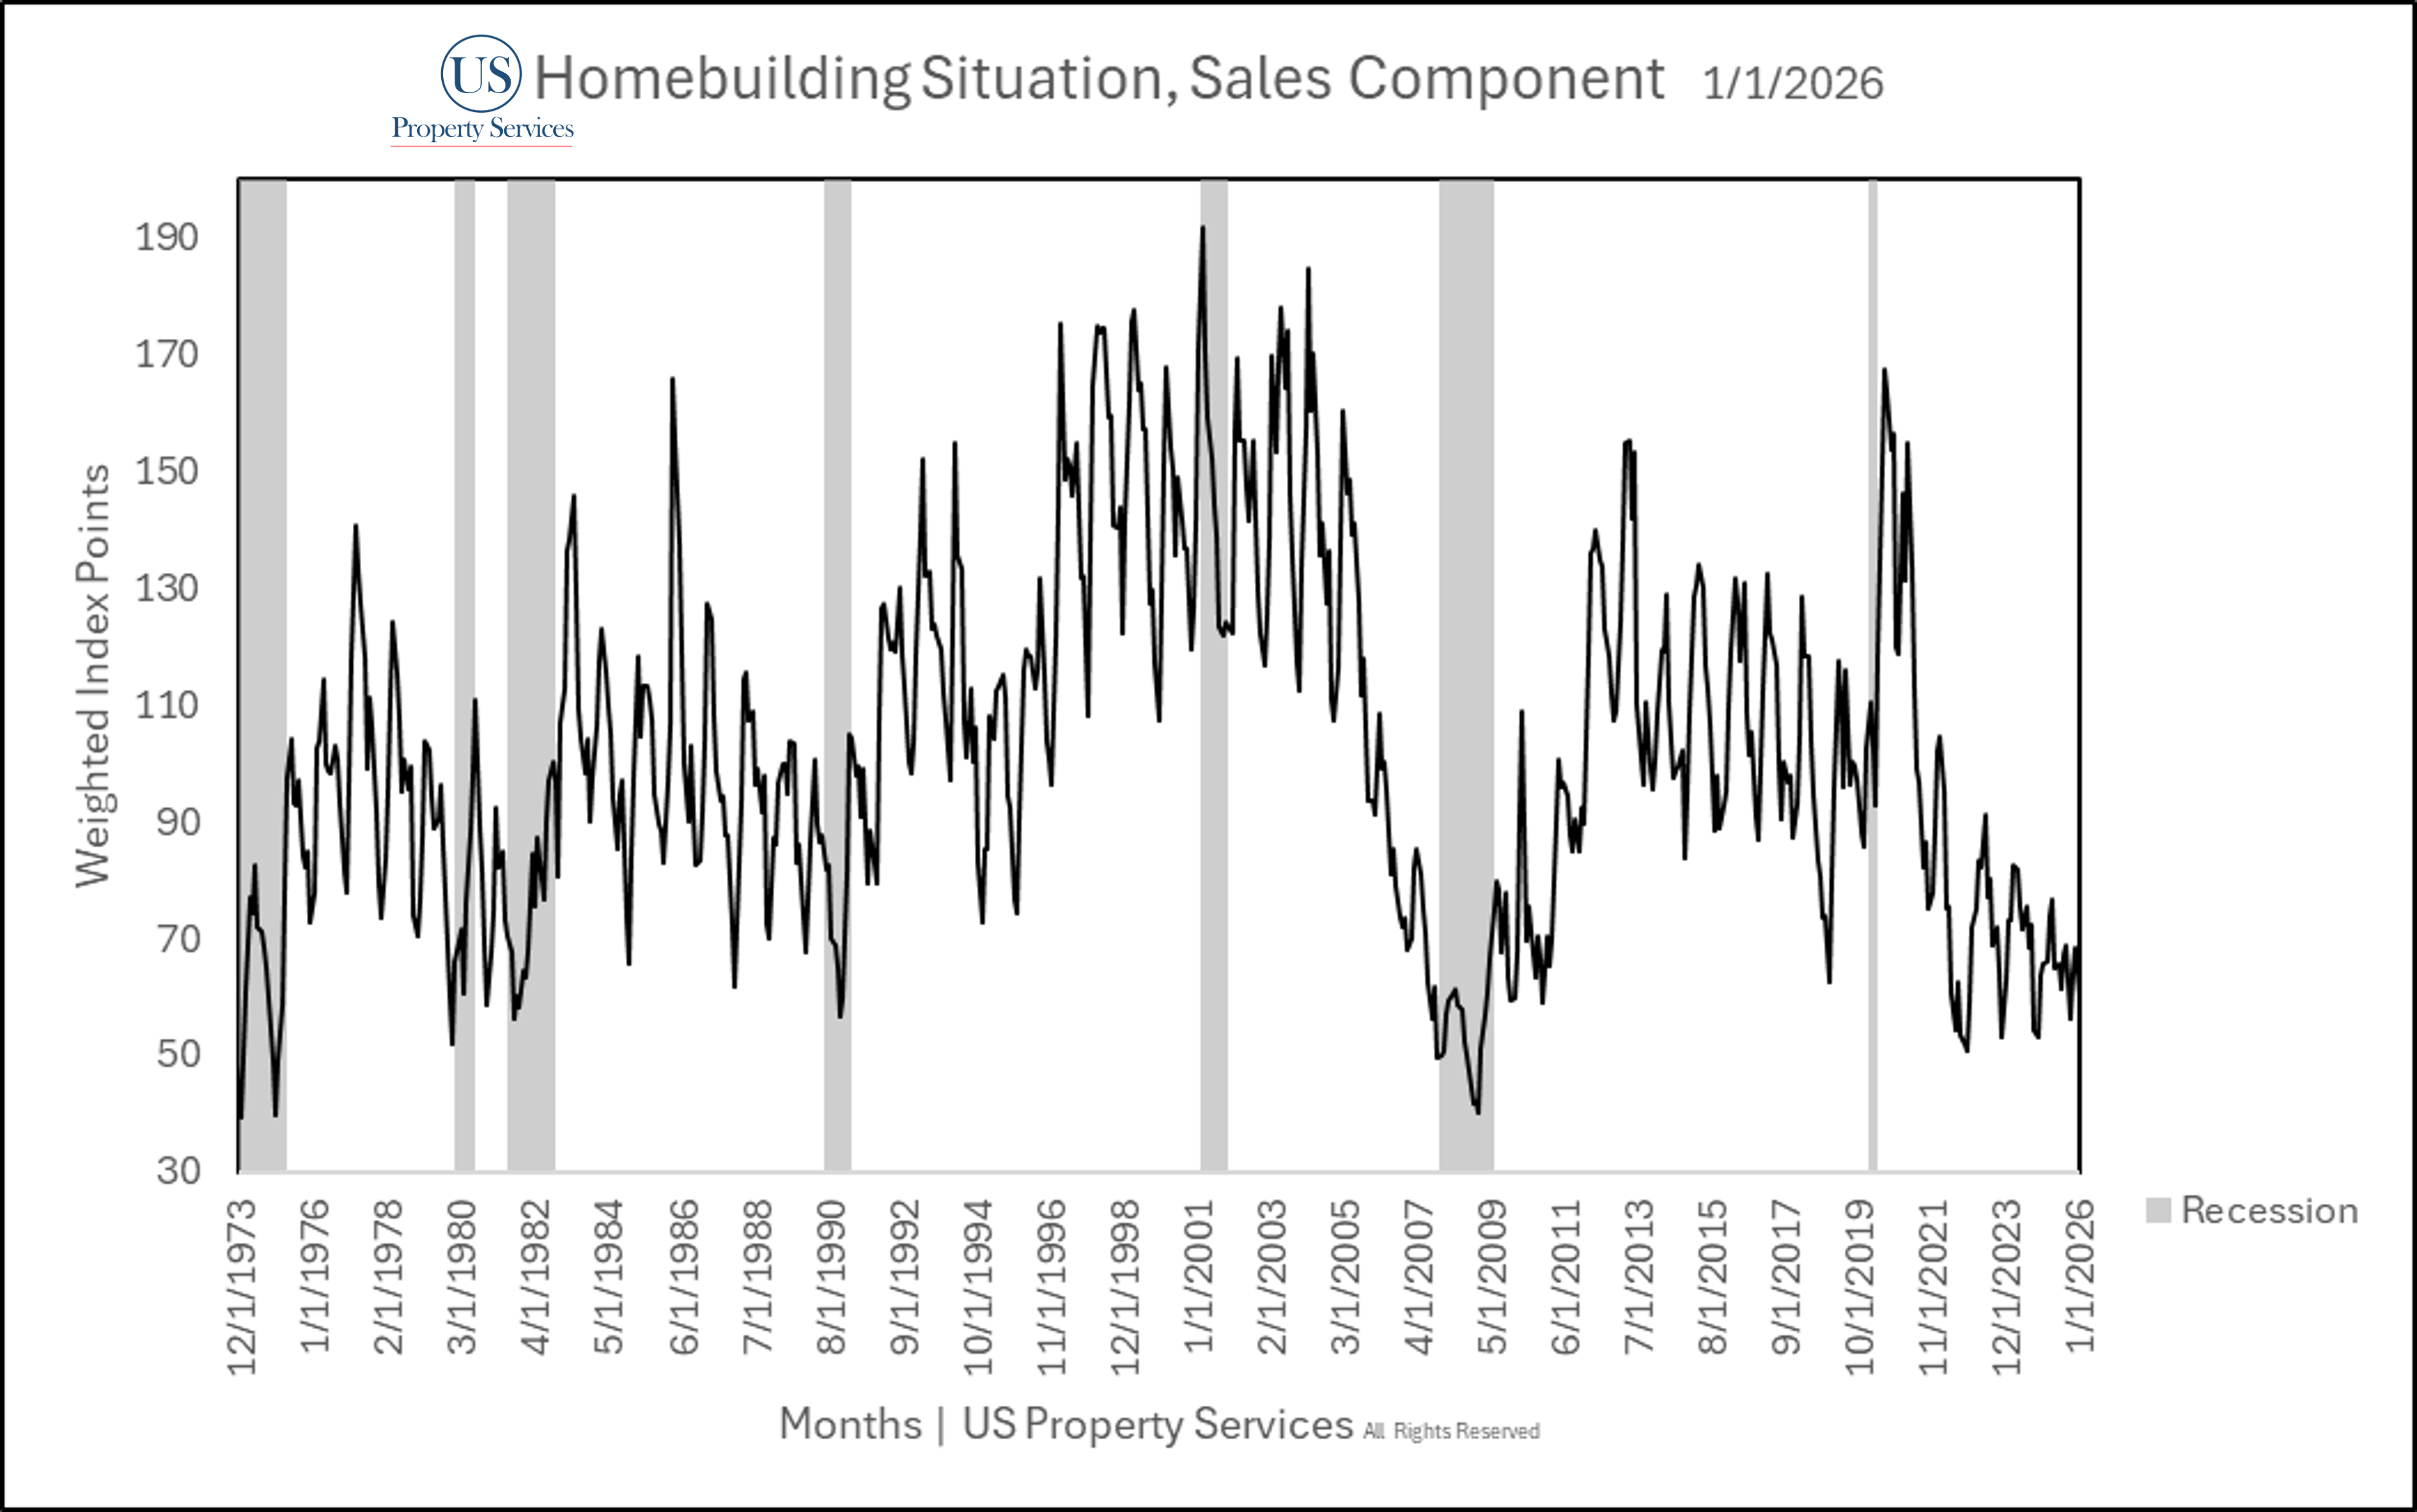
Fig. 4
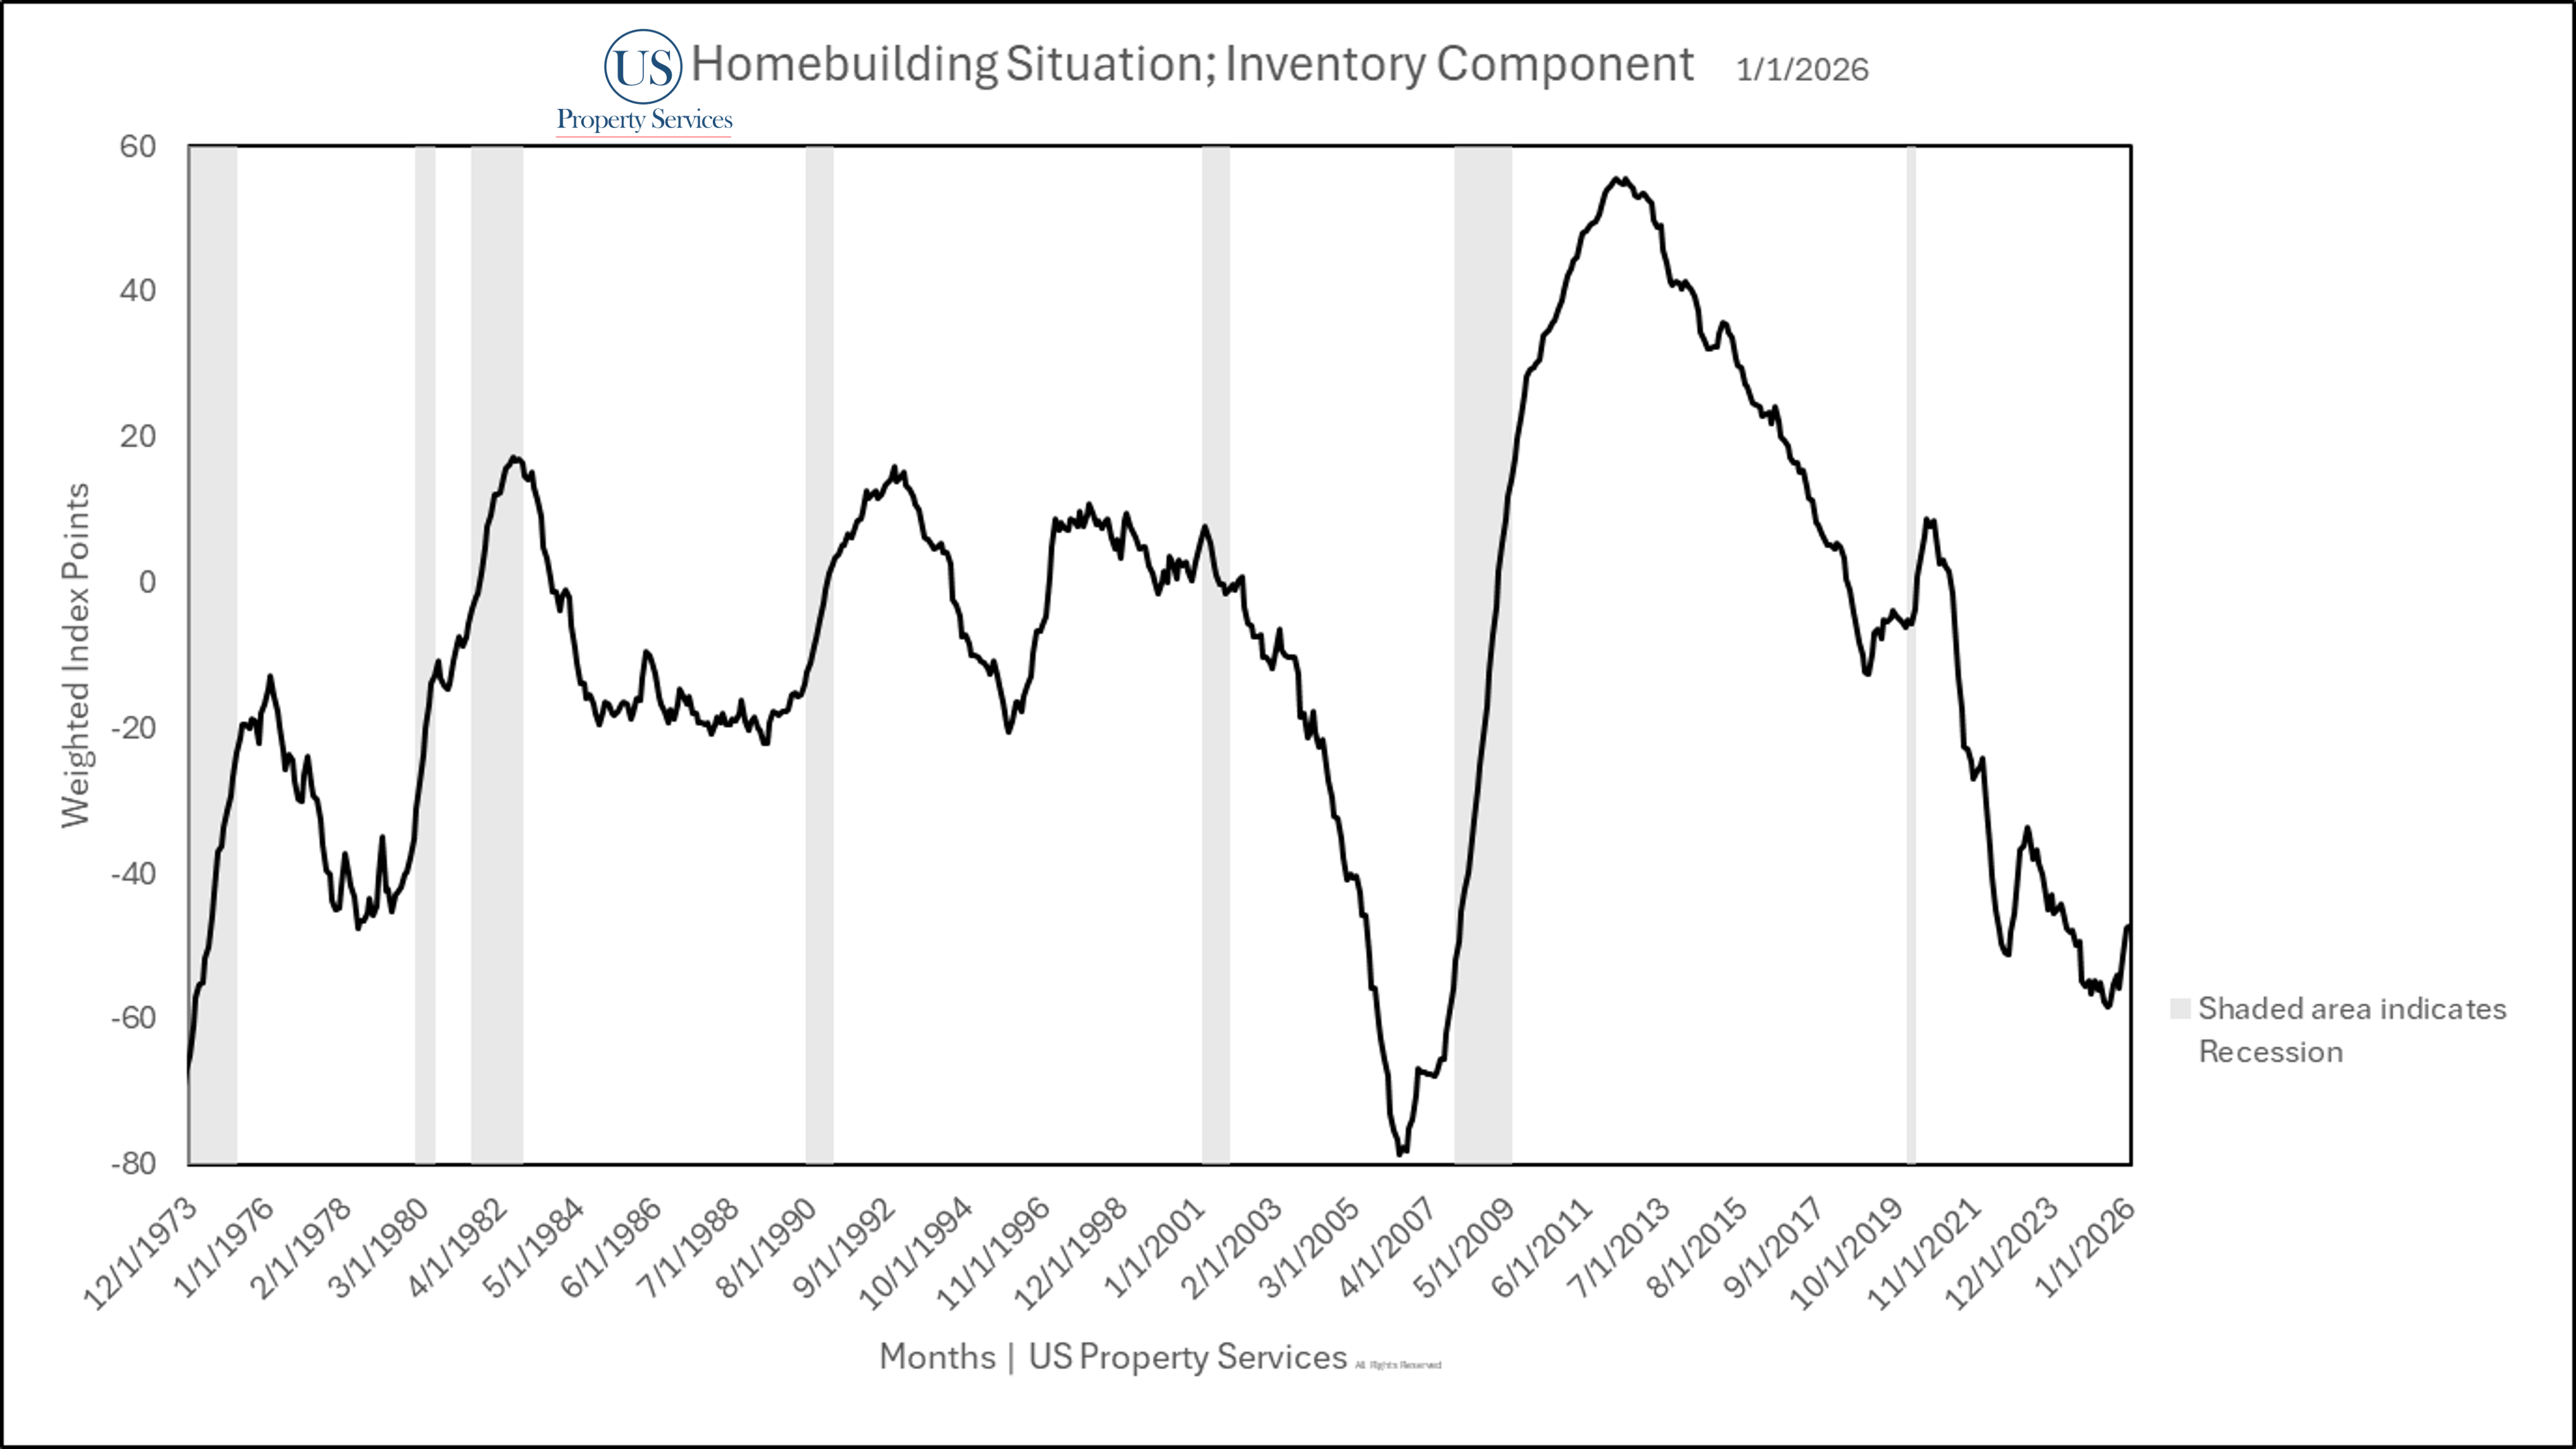
Fig. 5
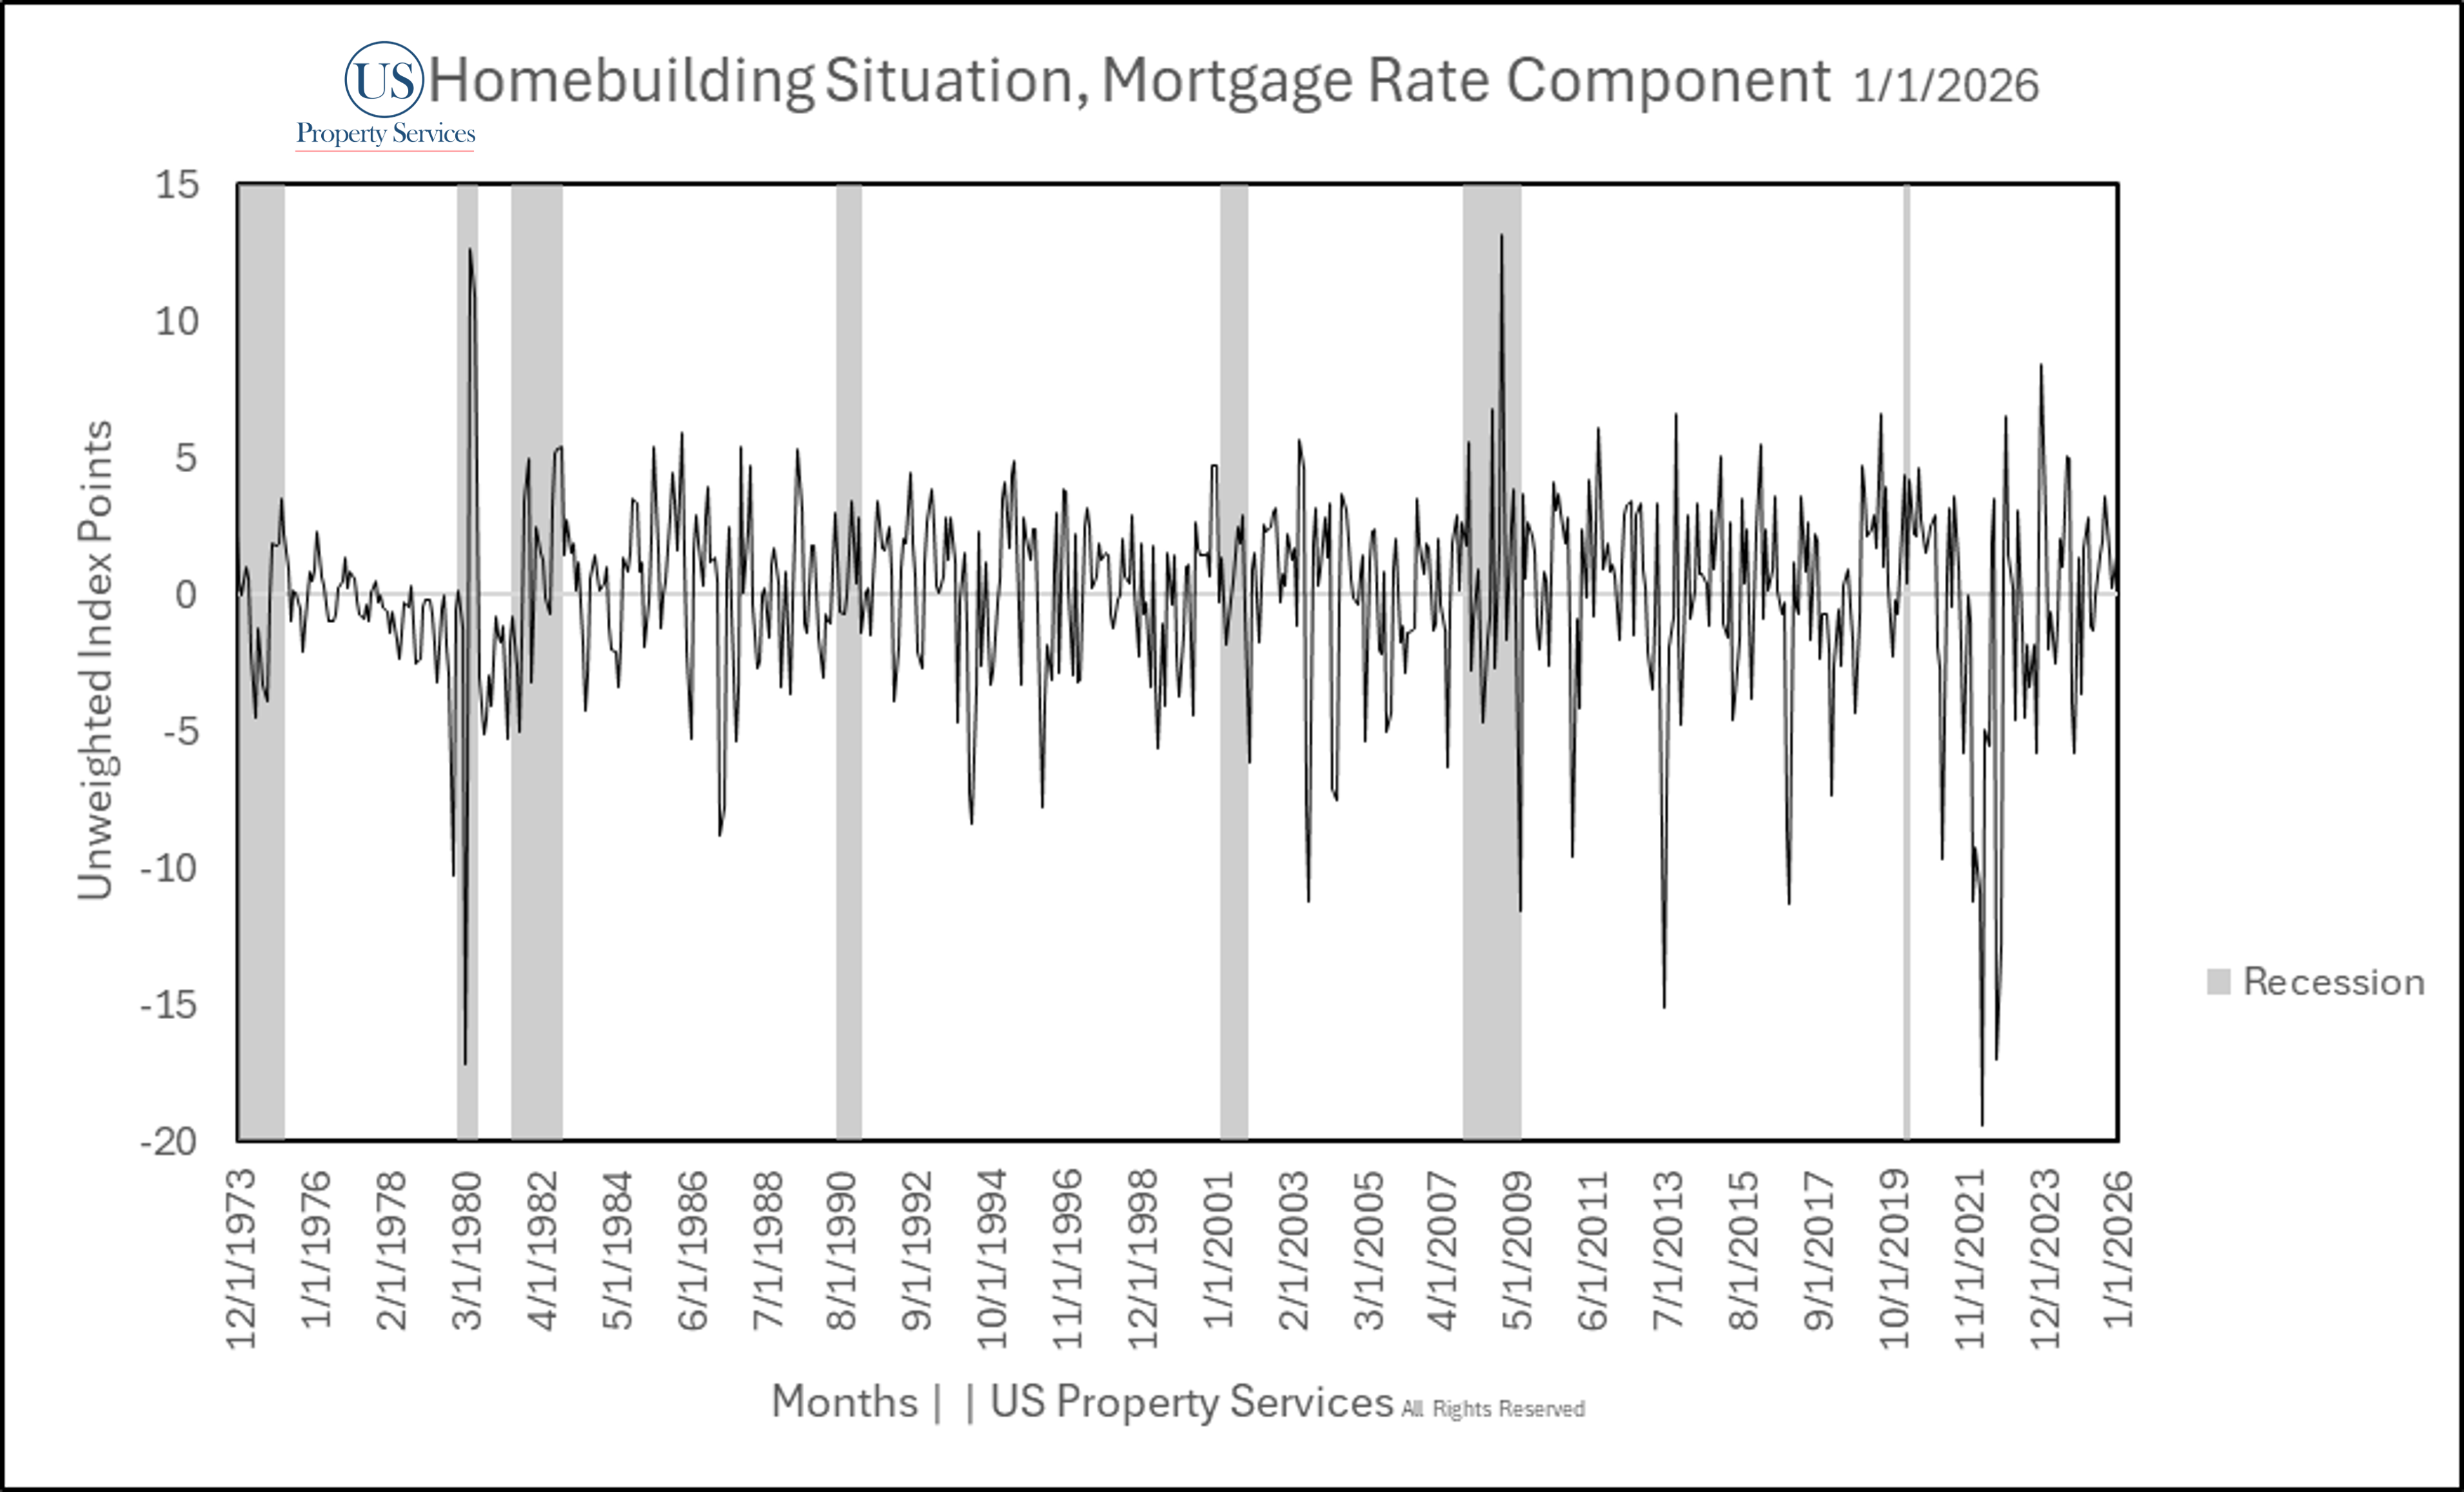
Fig. 6
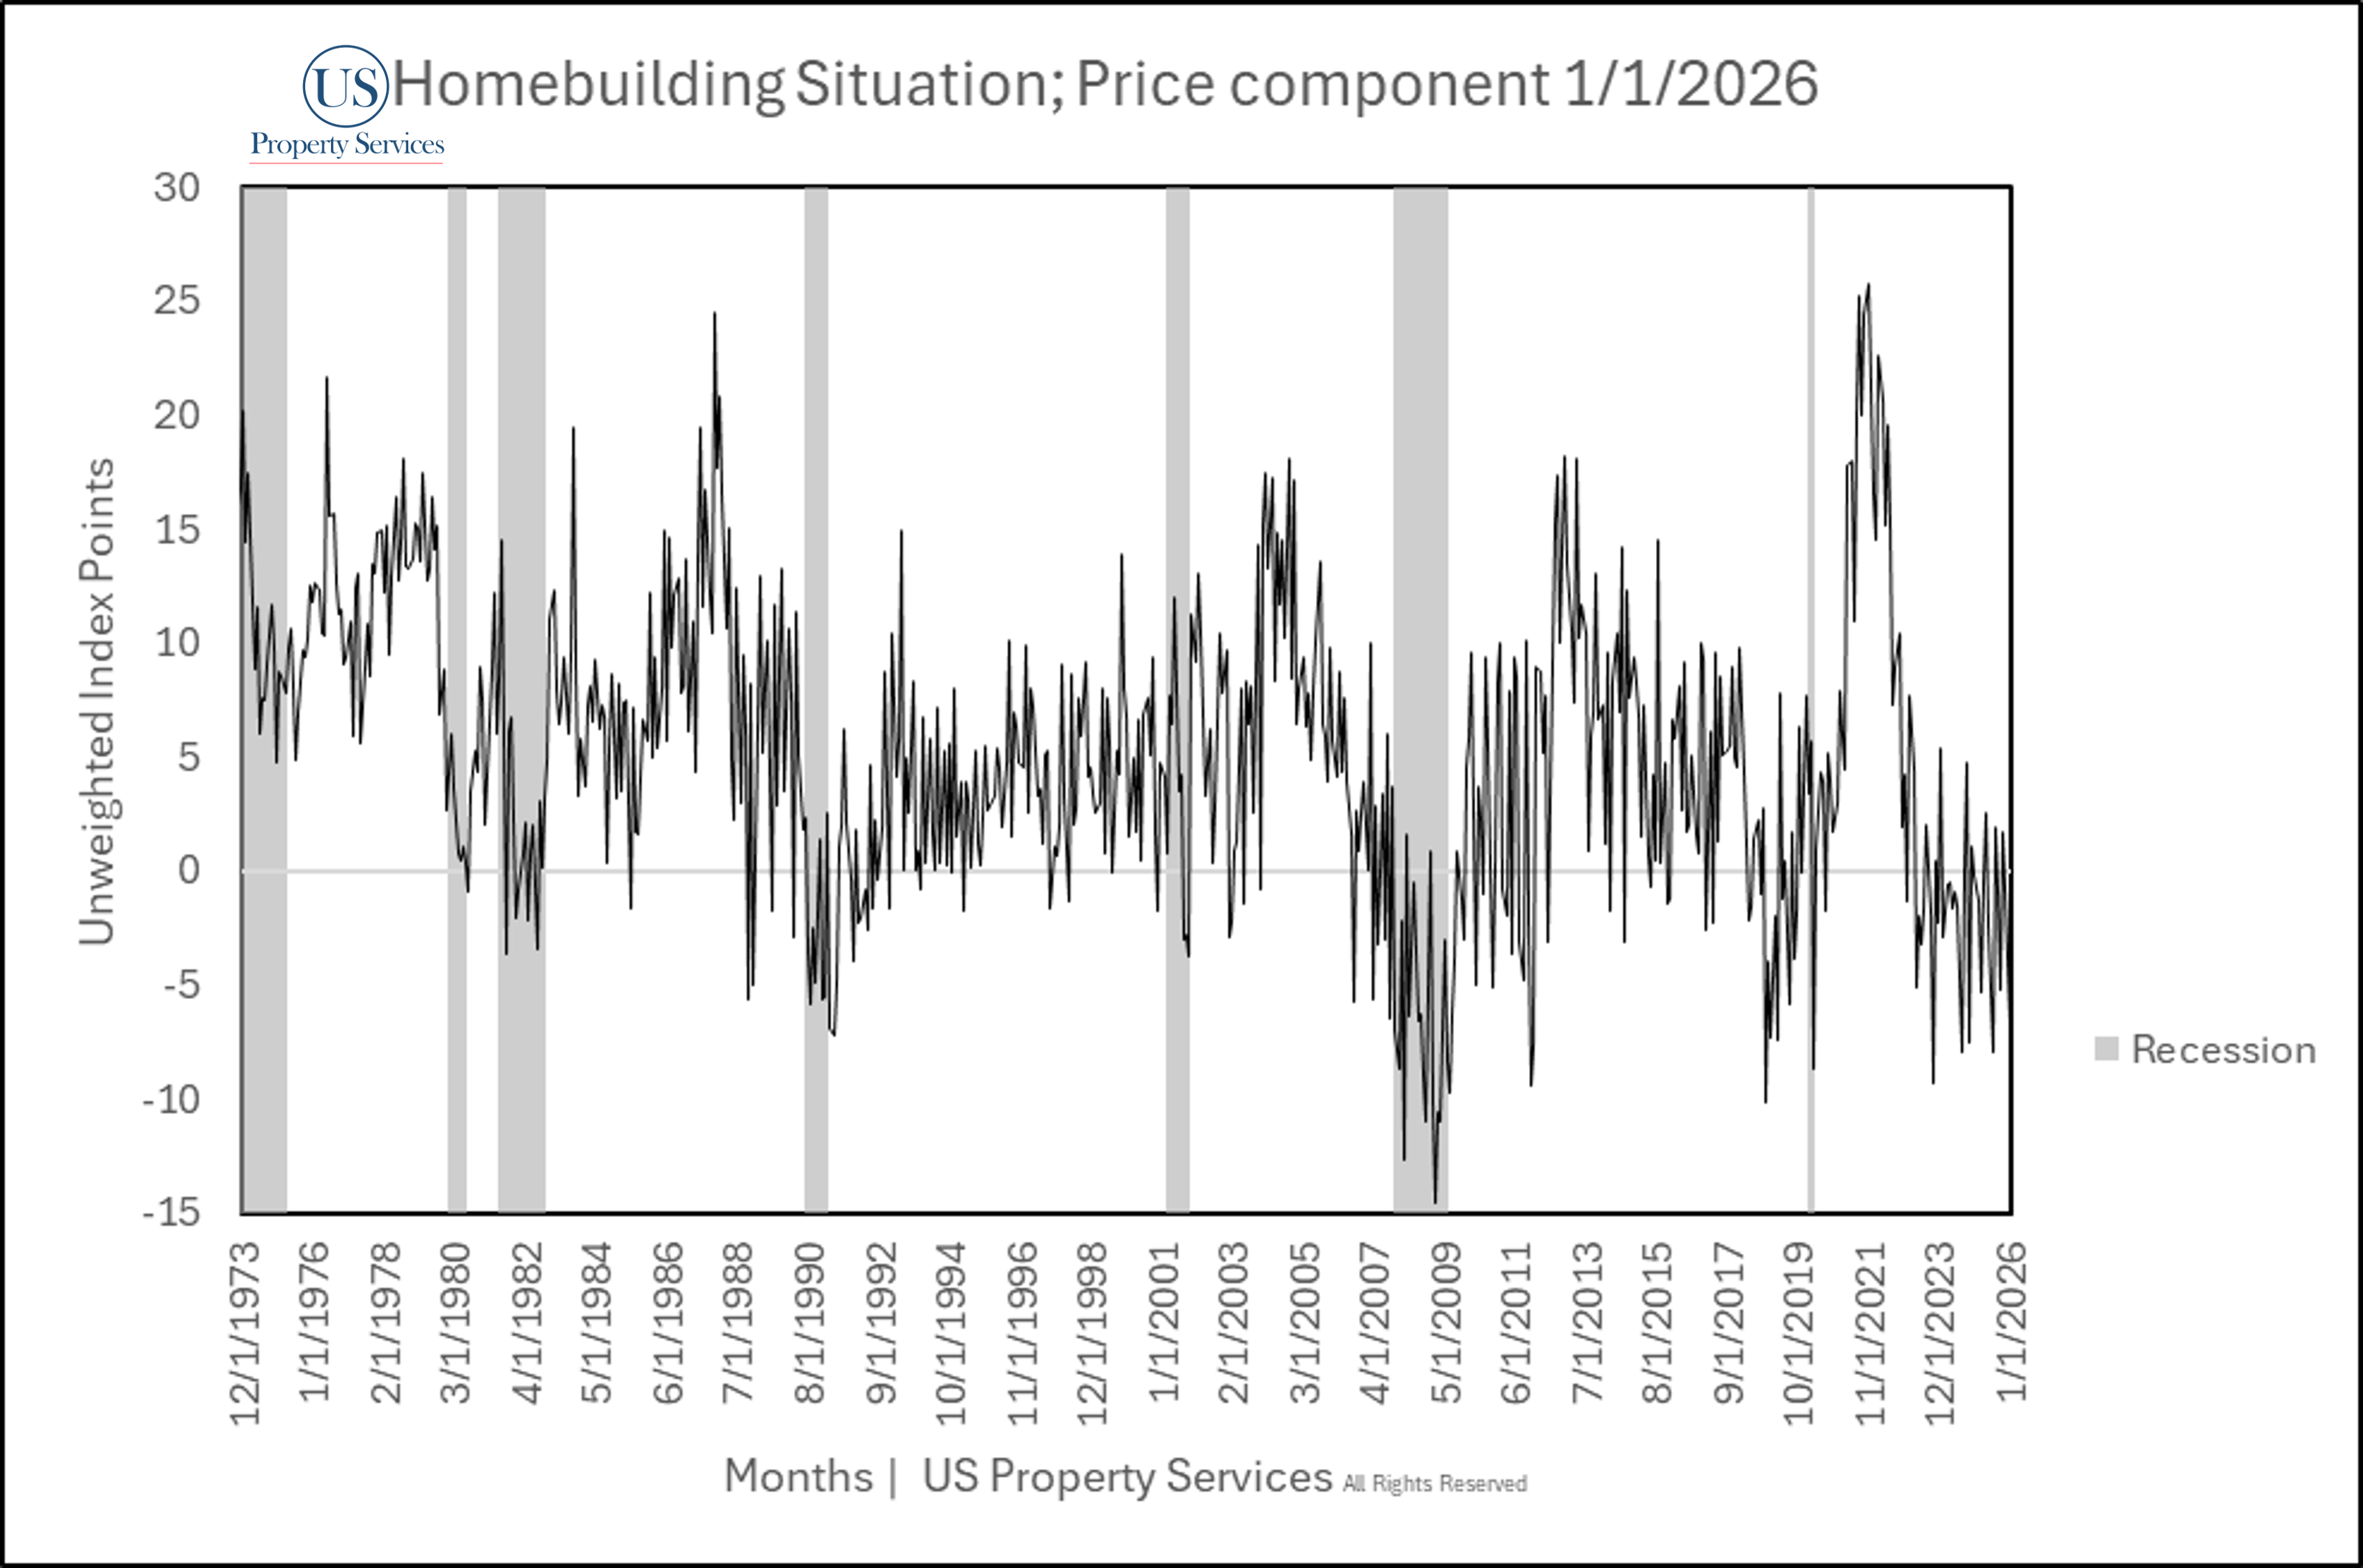
Fig. 7

Fig. 8
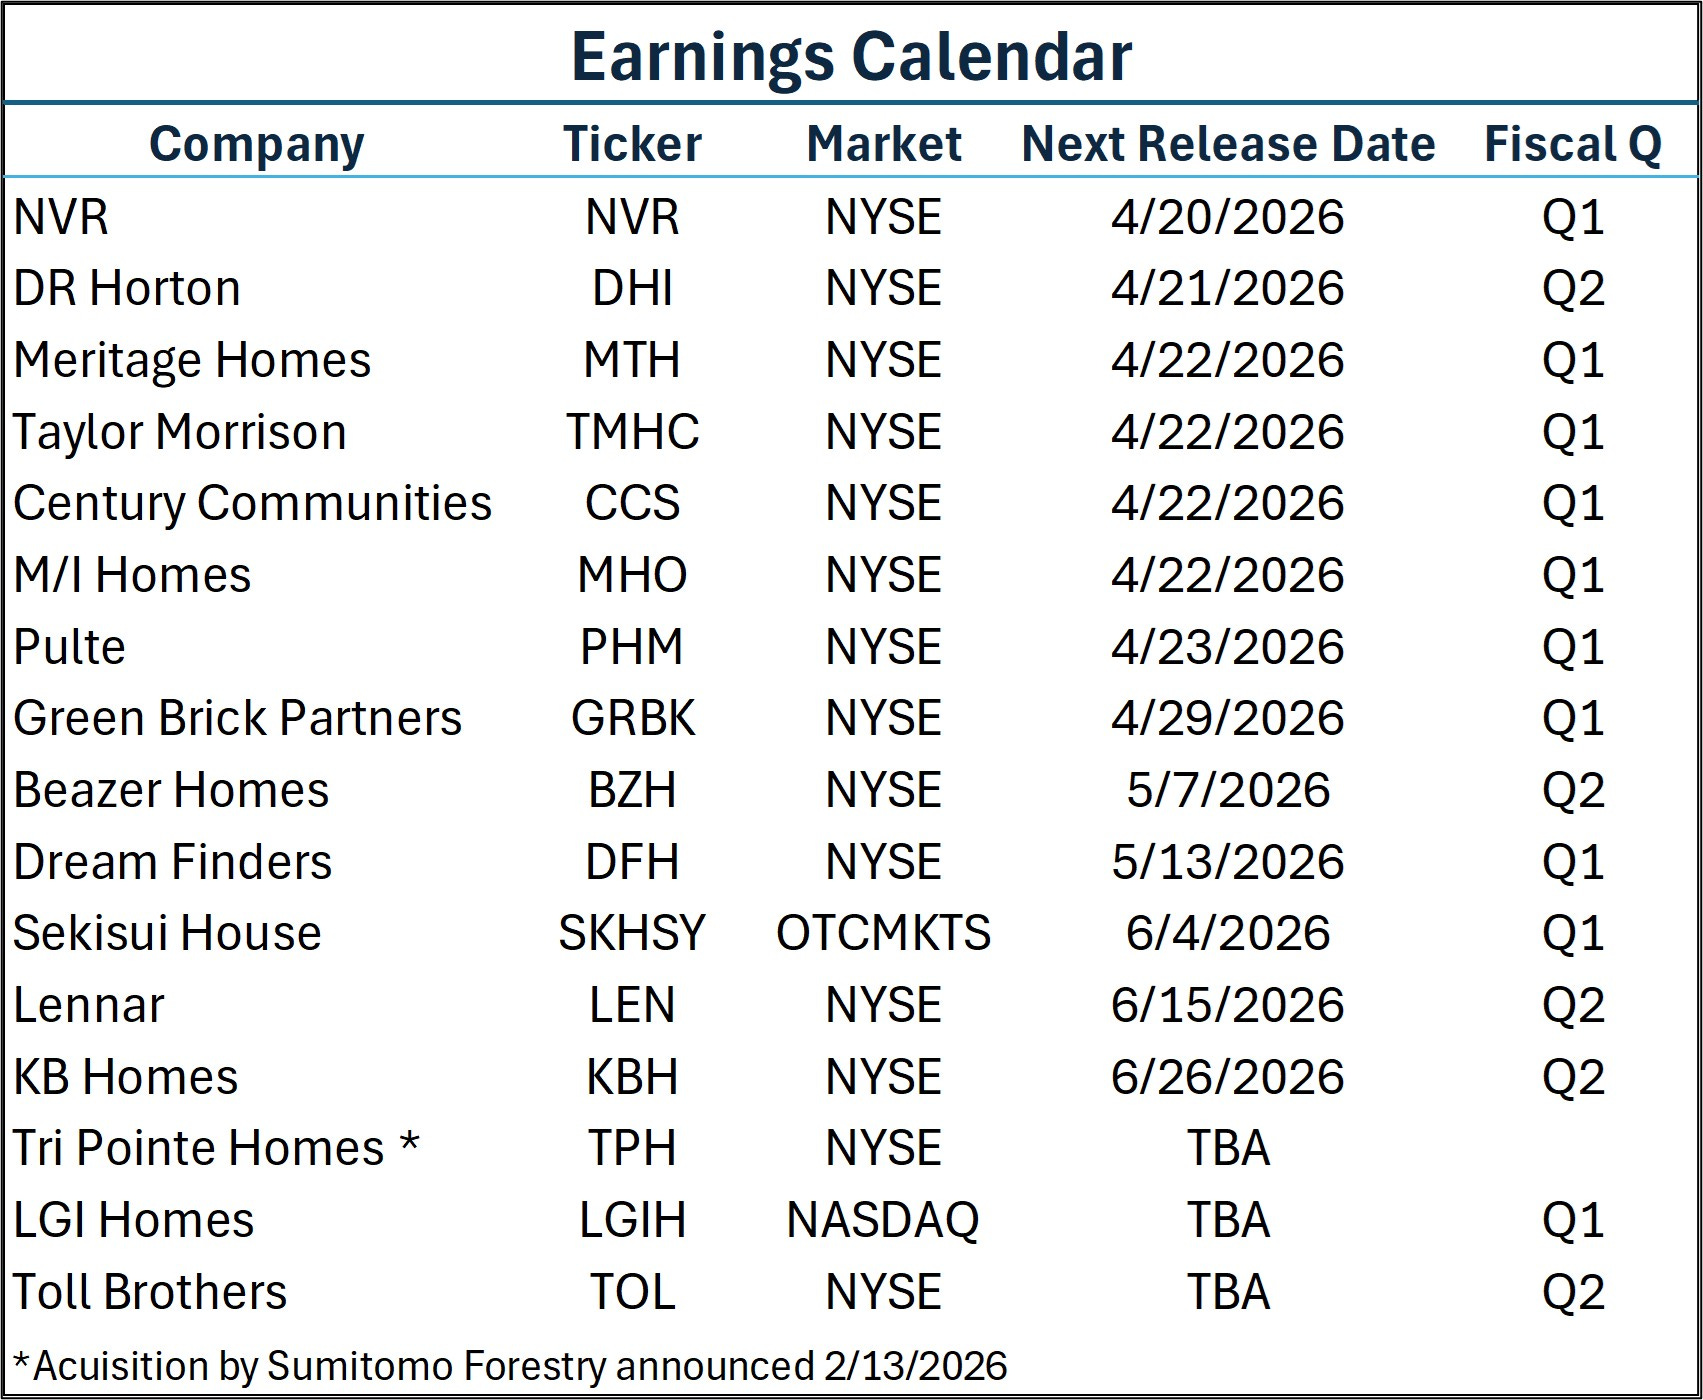
Publicly Traded Builders
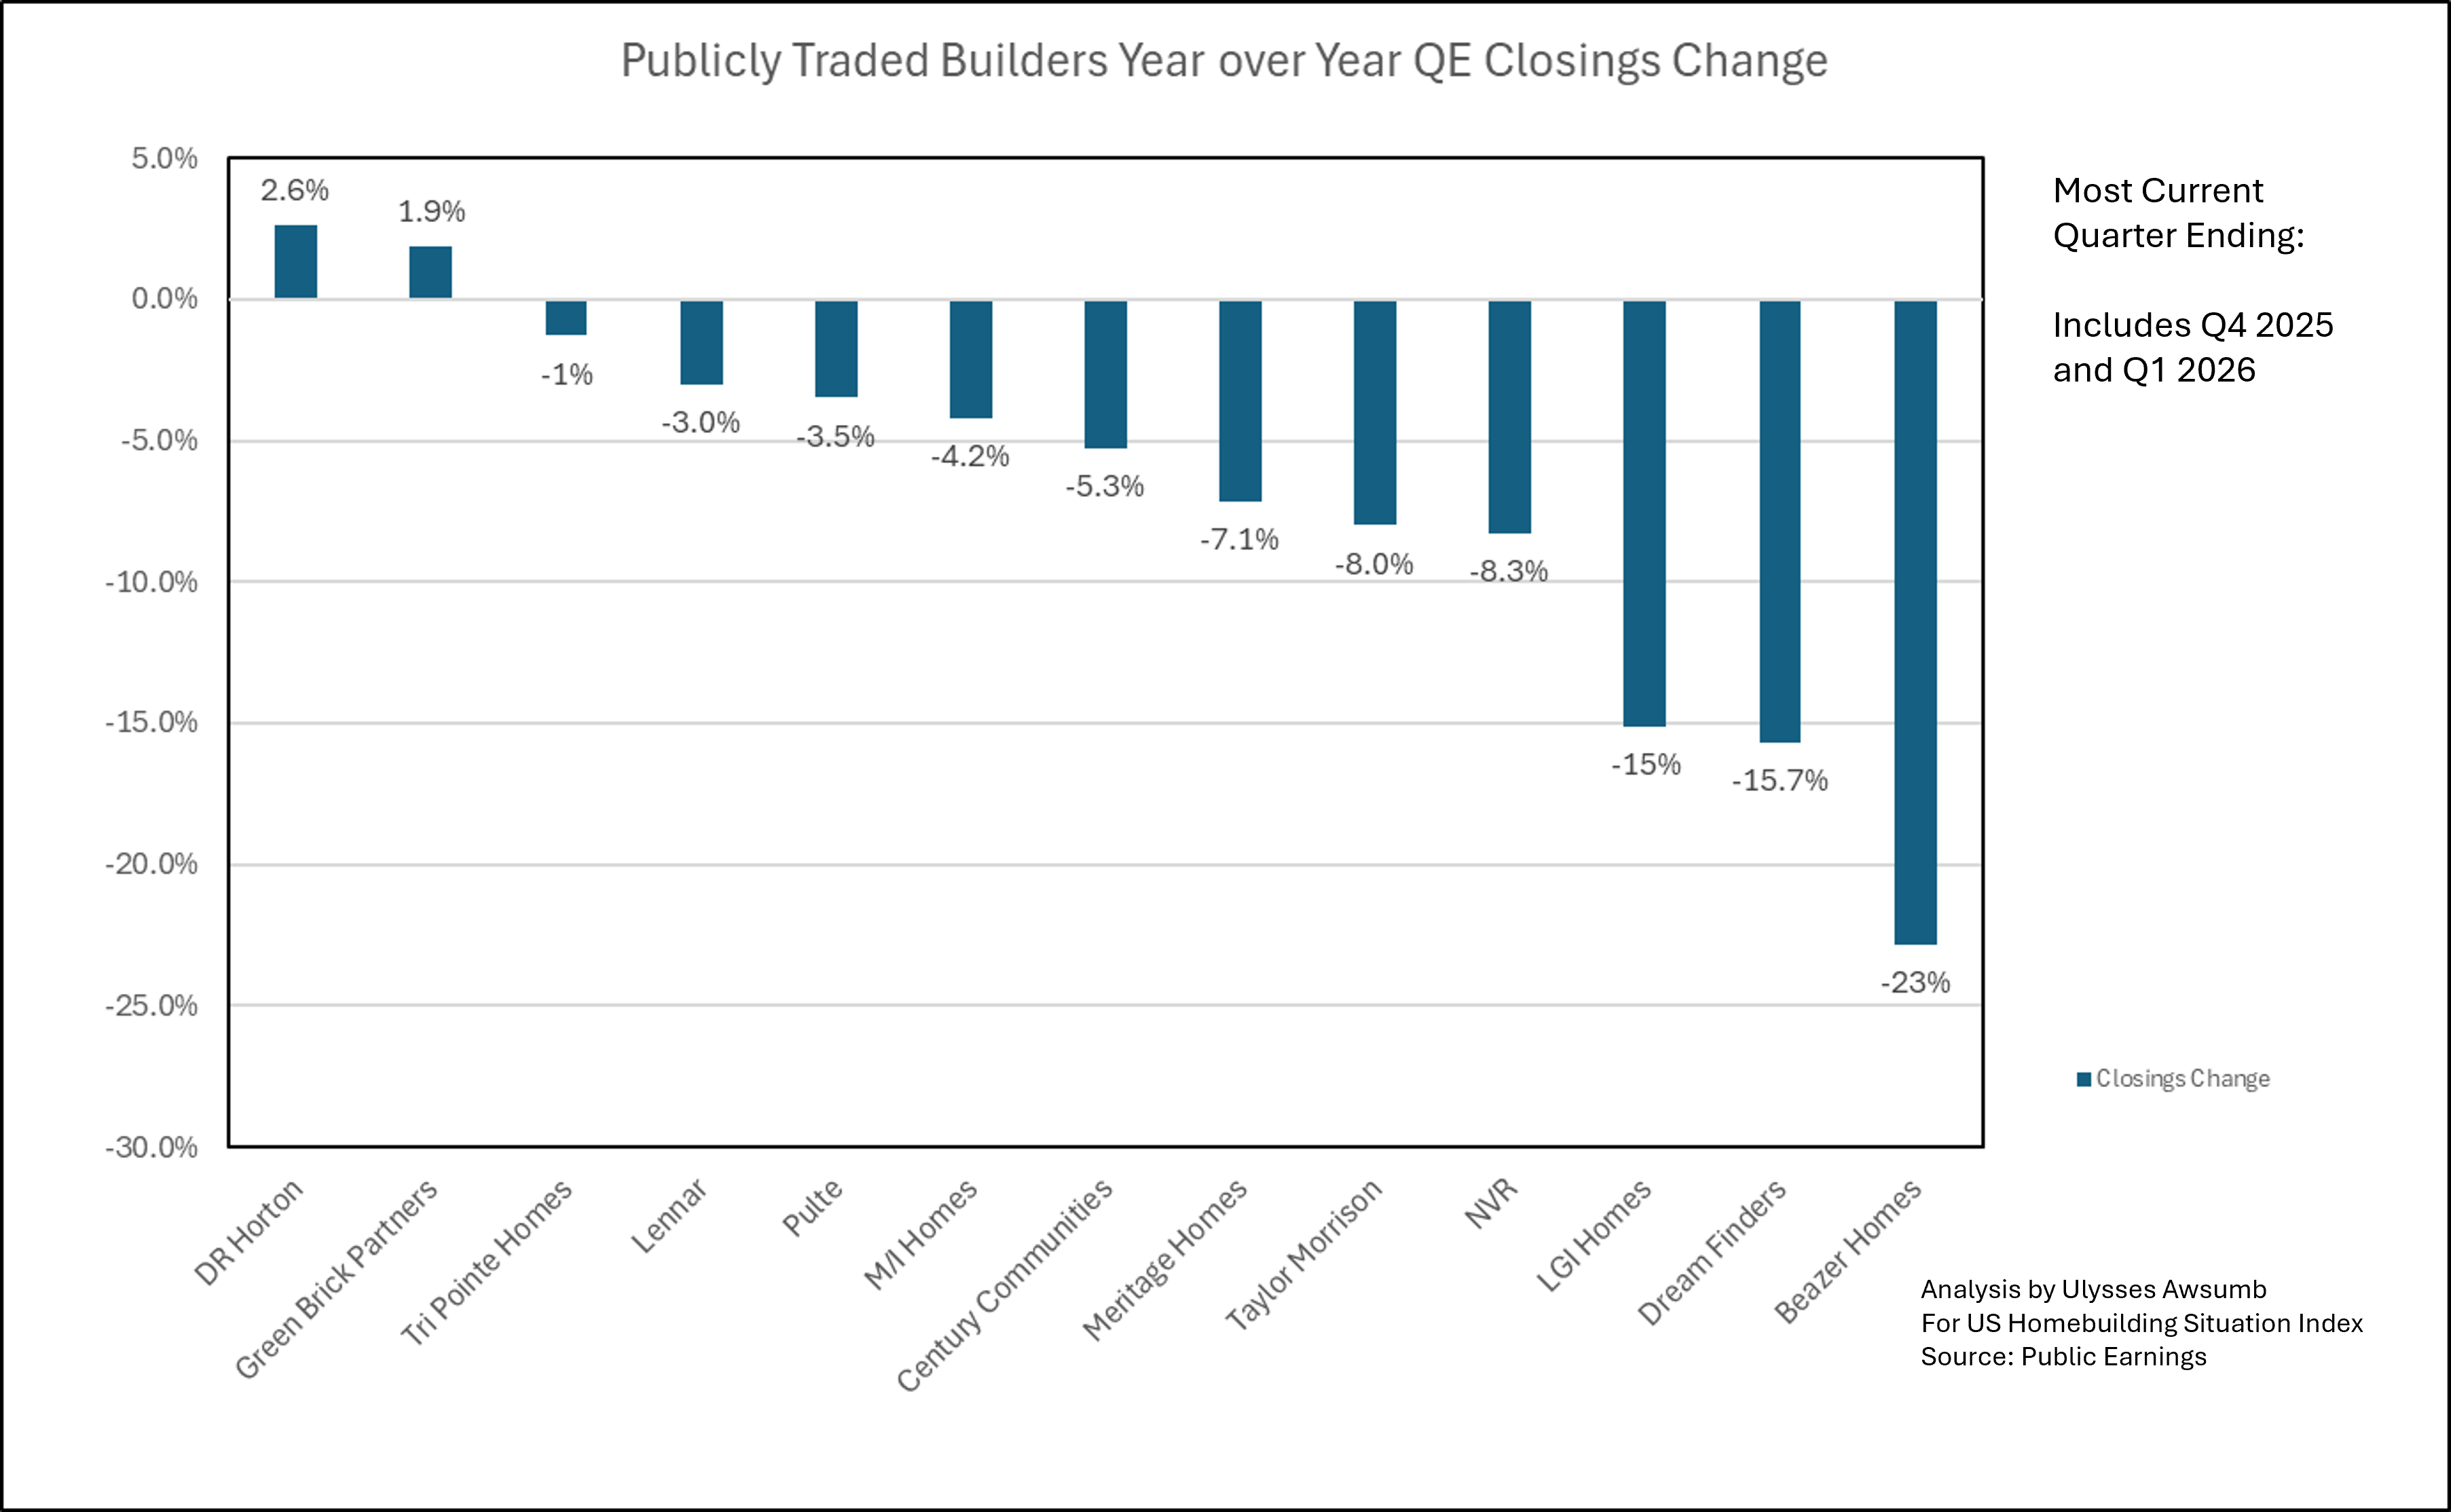
Through the end of Q4 2025 and into Q1 2026 (both fiscal and calendar) builders continue to face difficult conditions to move product. Of the 13 builders measured for this segment, only 2 saw an increase in volume of home sales. Those being DR Horton and Green Brick Partners. Beazer Homes reported another loss, quarterly and saw the largest decline at -23% in home closings, while Tri Pointe had the smallest decline of -1%. The average decline was -6.9% year over year.
Fig. 9
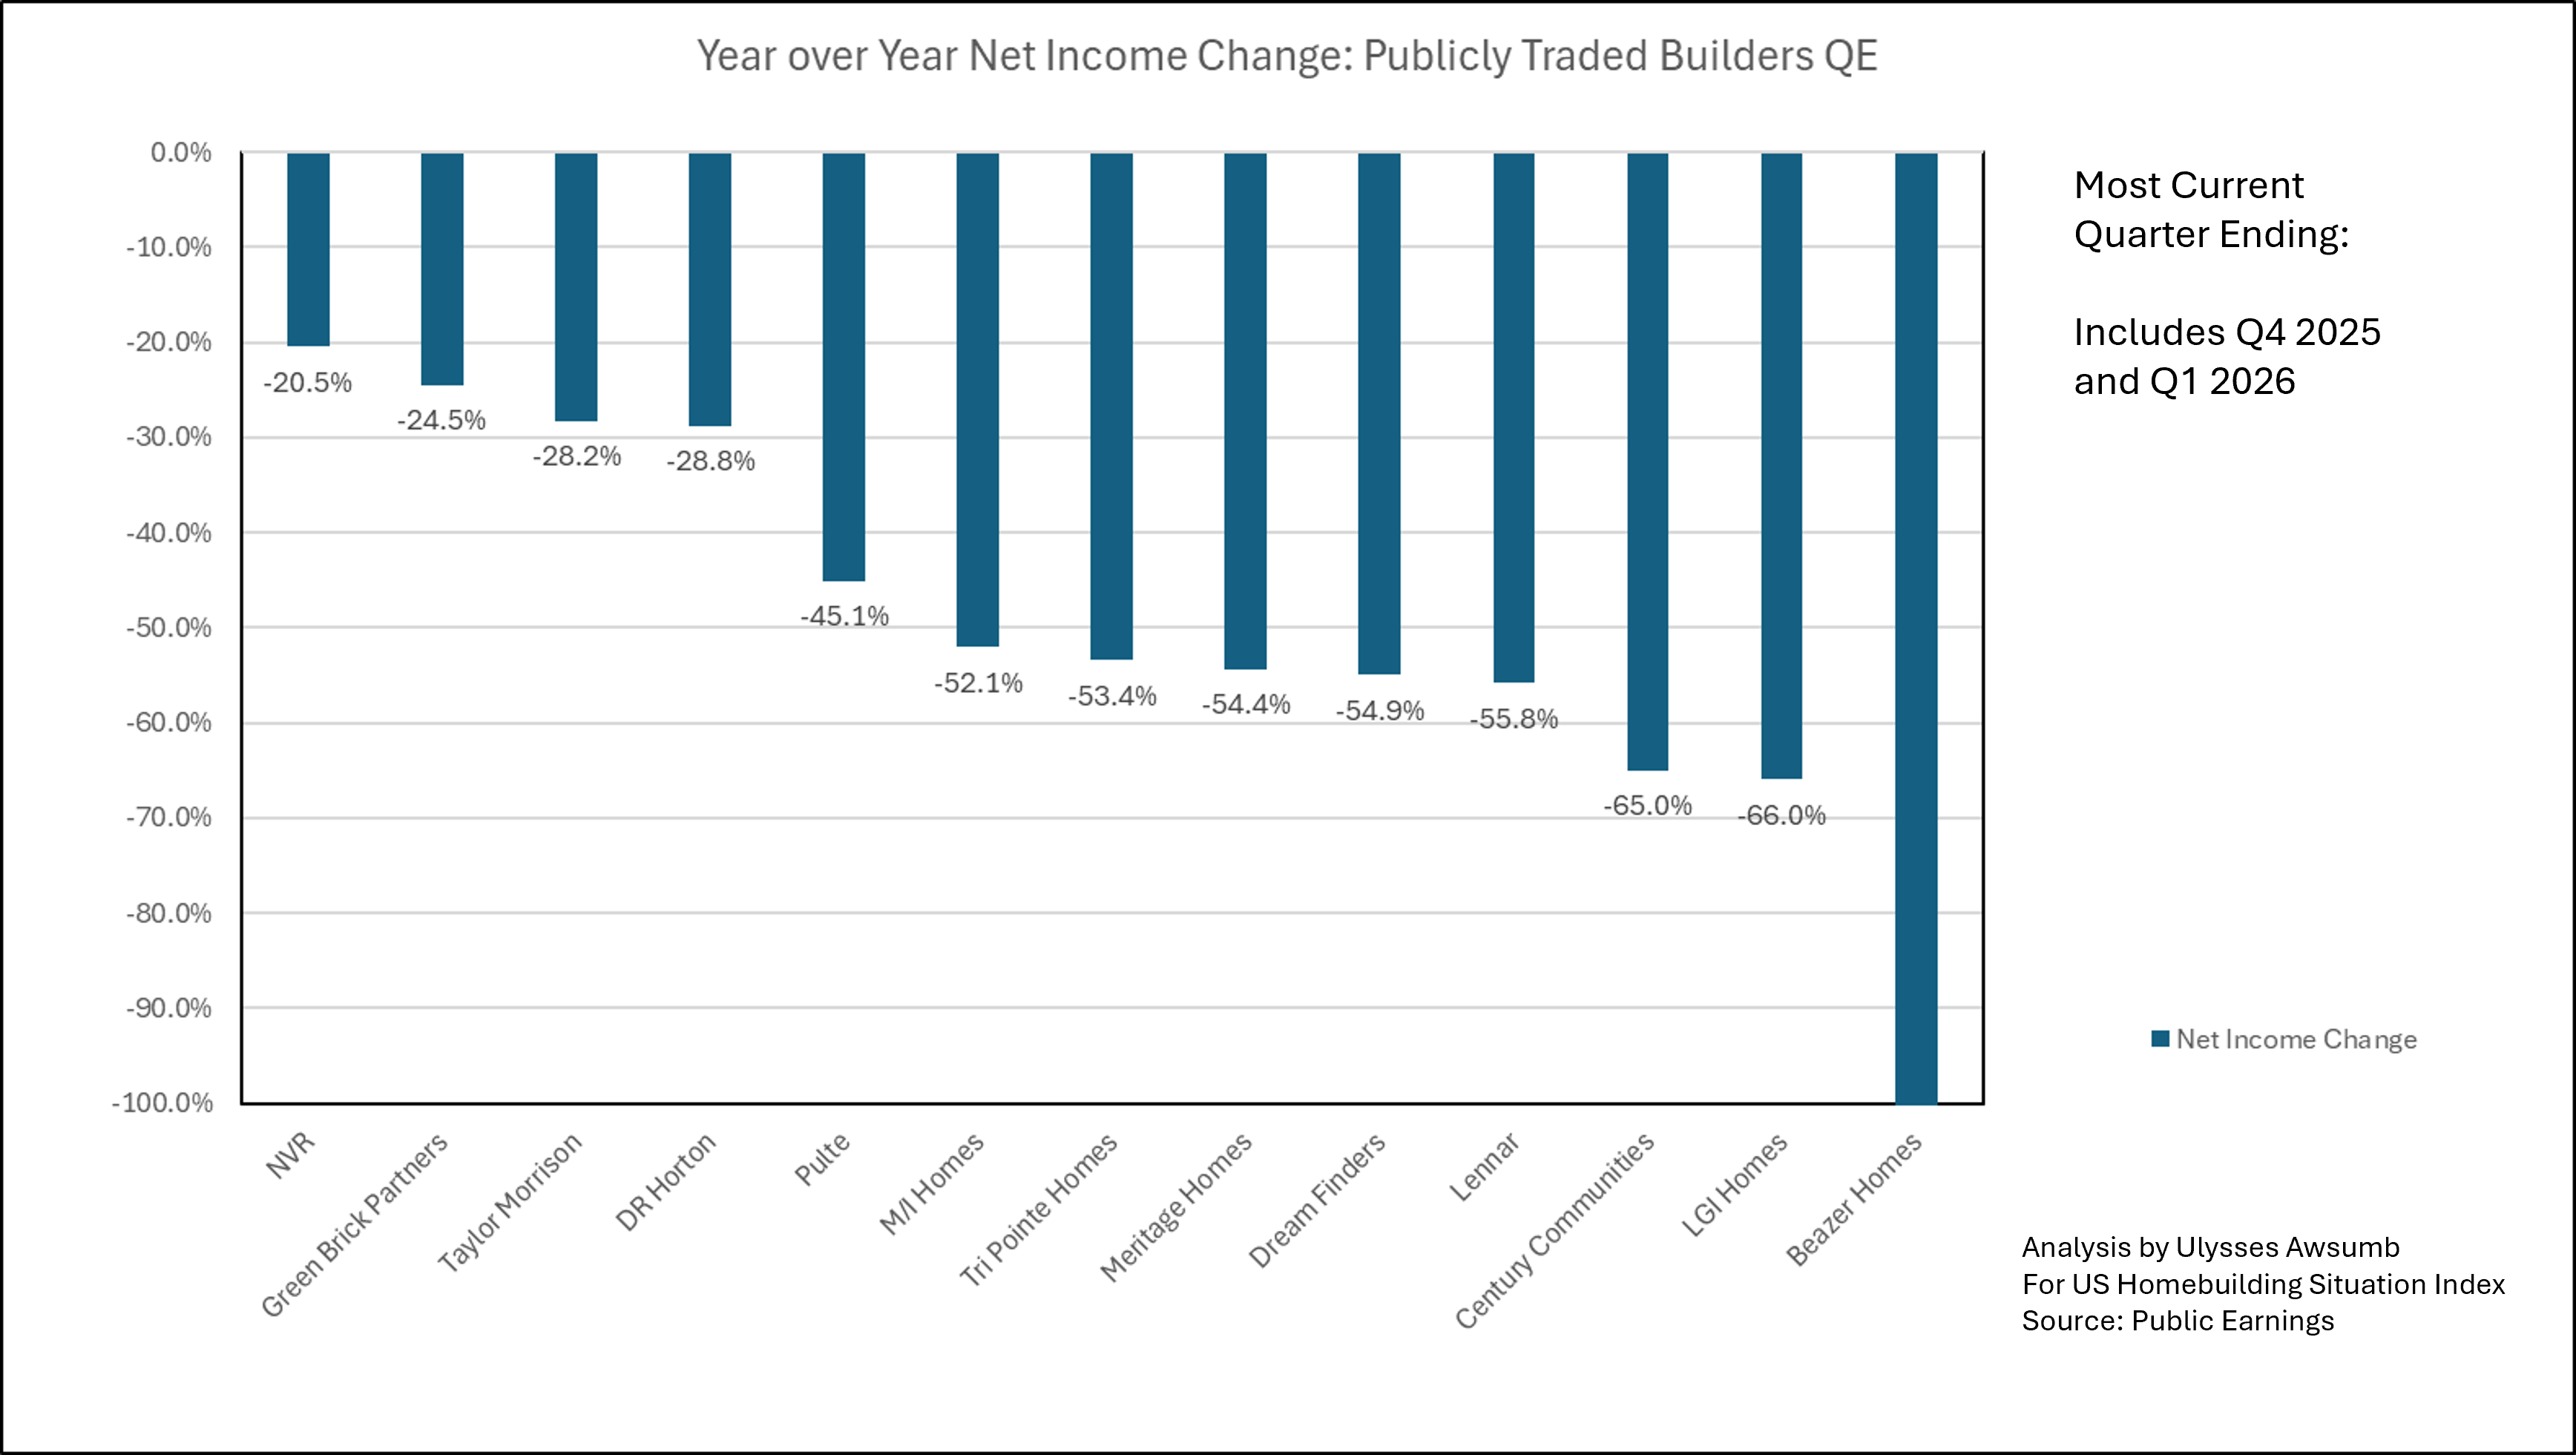
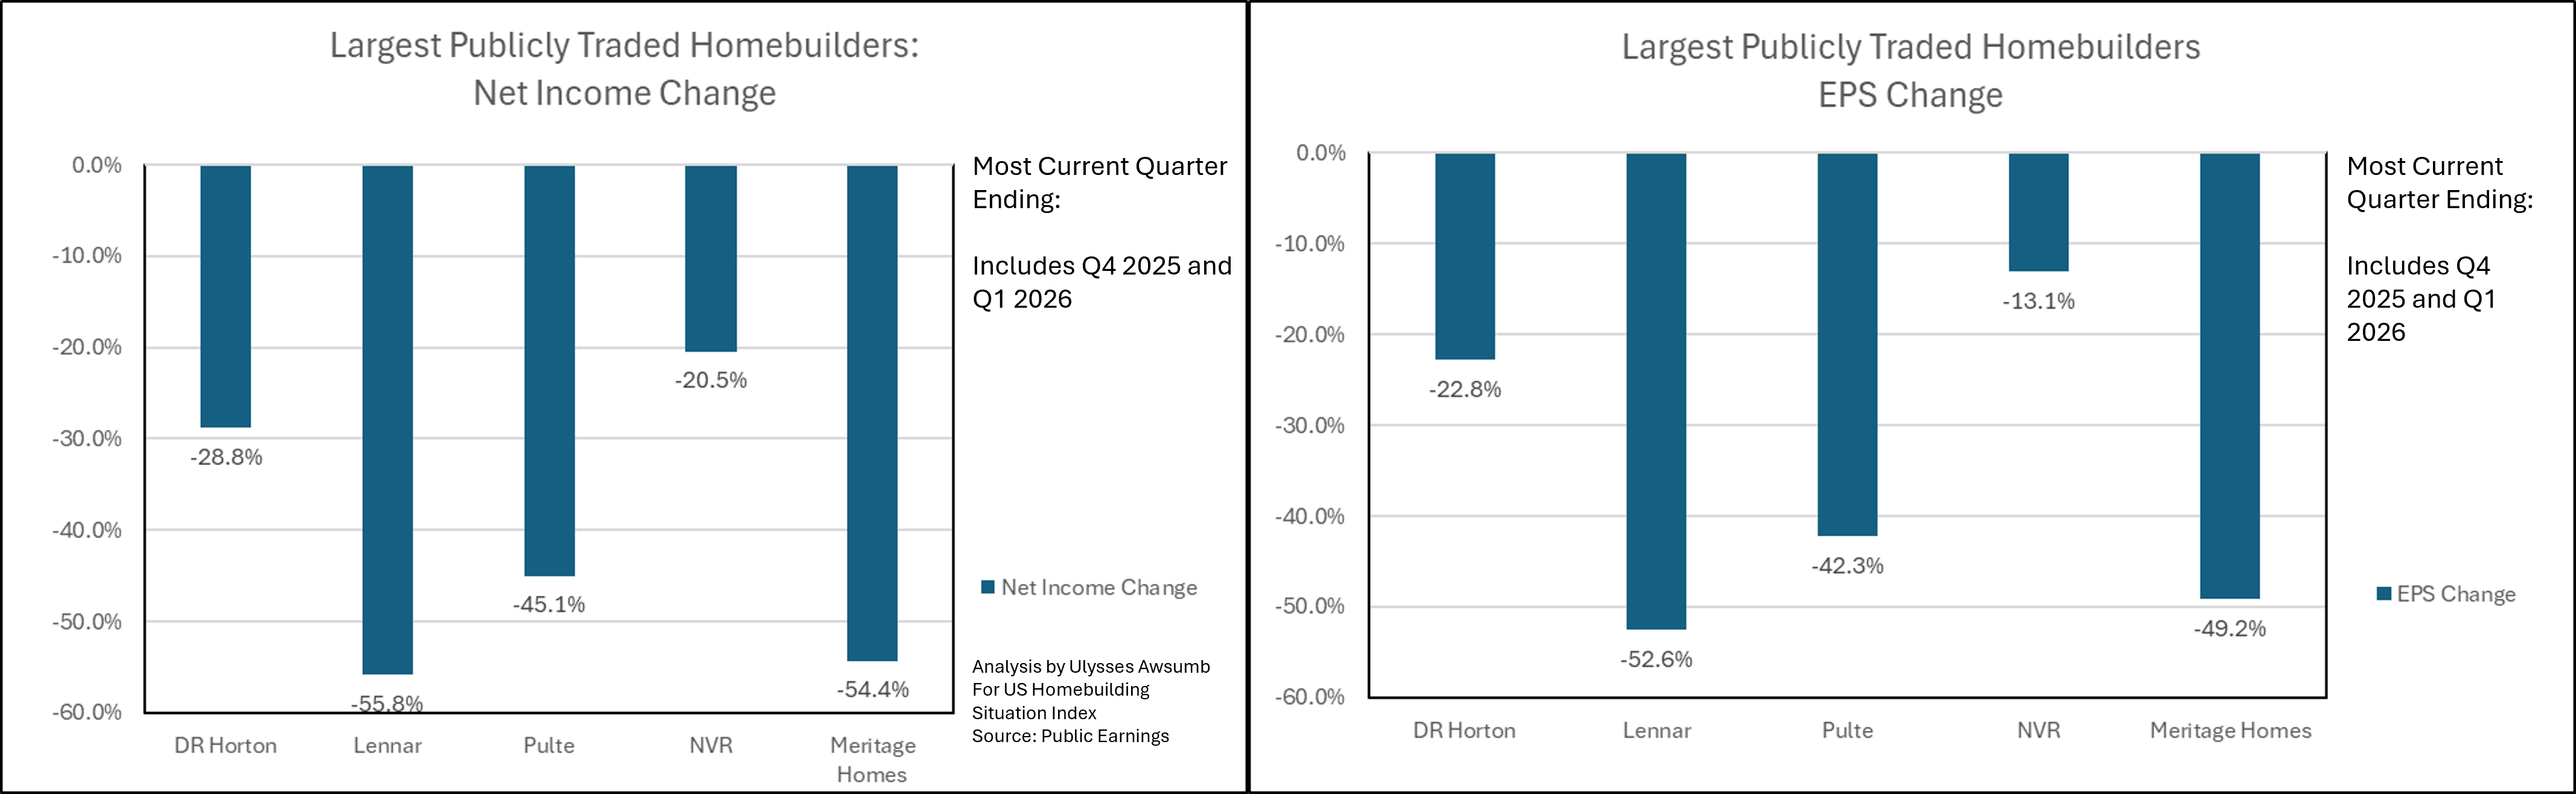
As Figure 10 will show, none of those 13 escaped declines in net income. Removing Beazer from the pool (due to actual loss) the average decline in net earnings came in at -45% year over year. 61% (8/13) of Builders studied saw declines greater than -50%
Fig. 10
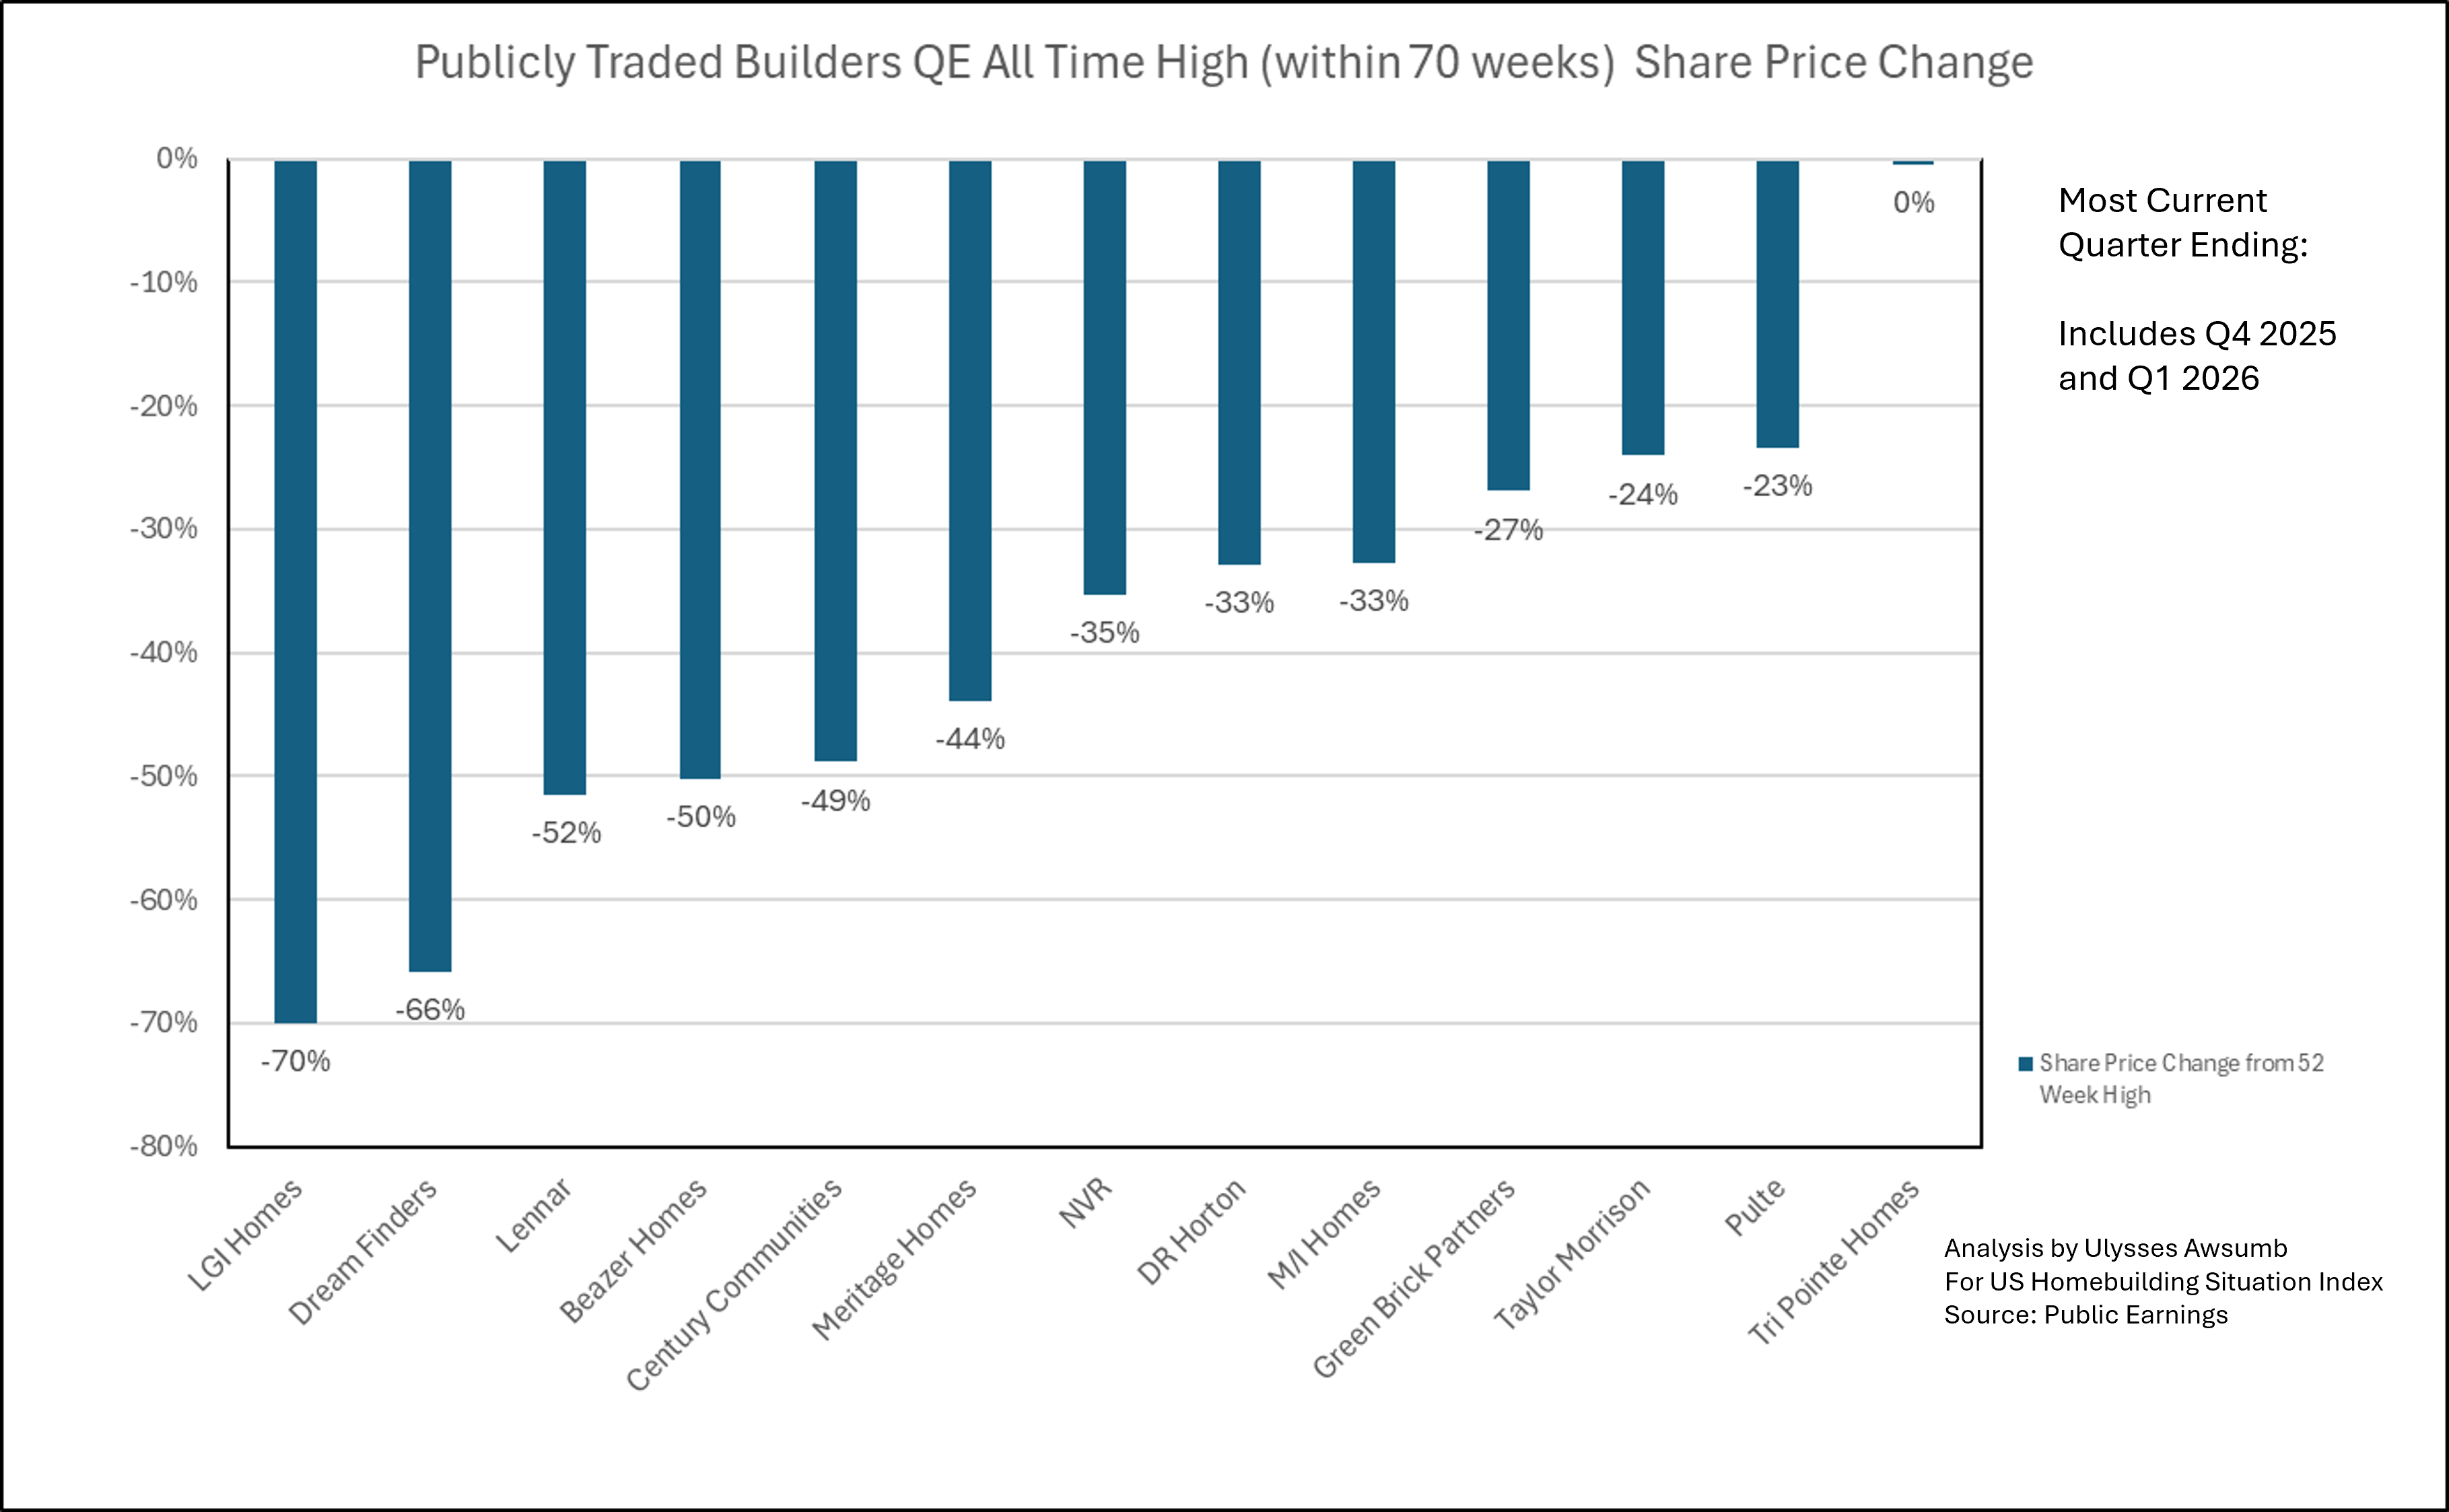
Going back to Mid 2024 highs, the average share price decline is -39%.
Fig. 11
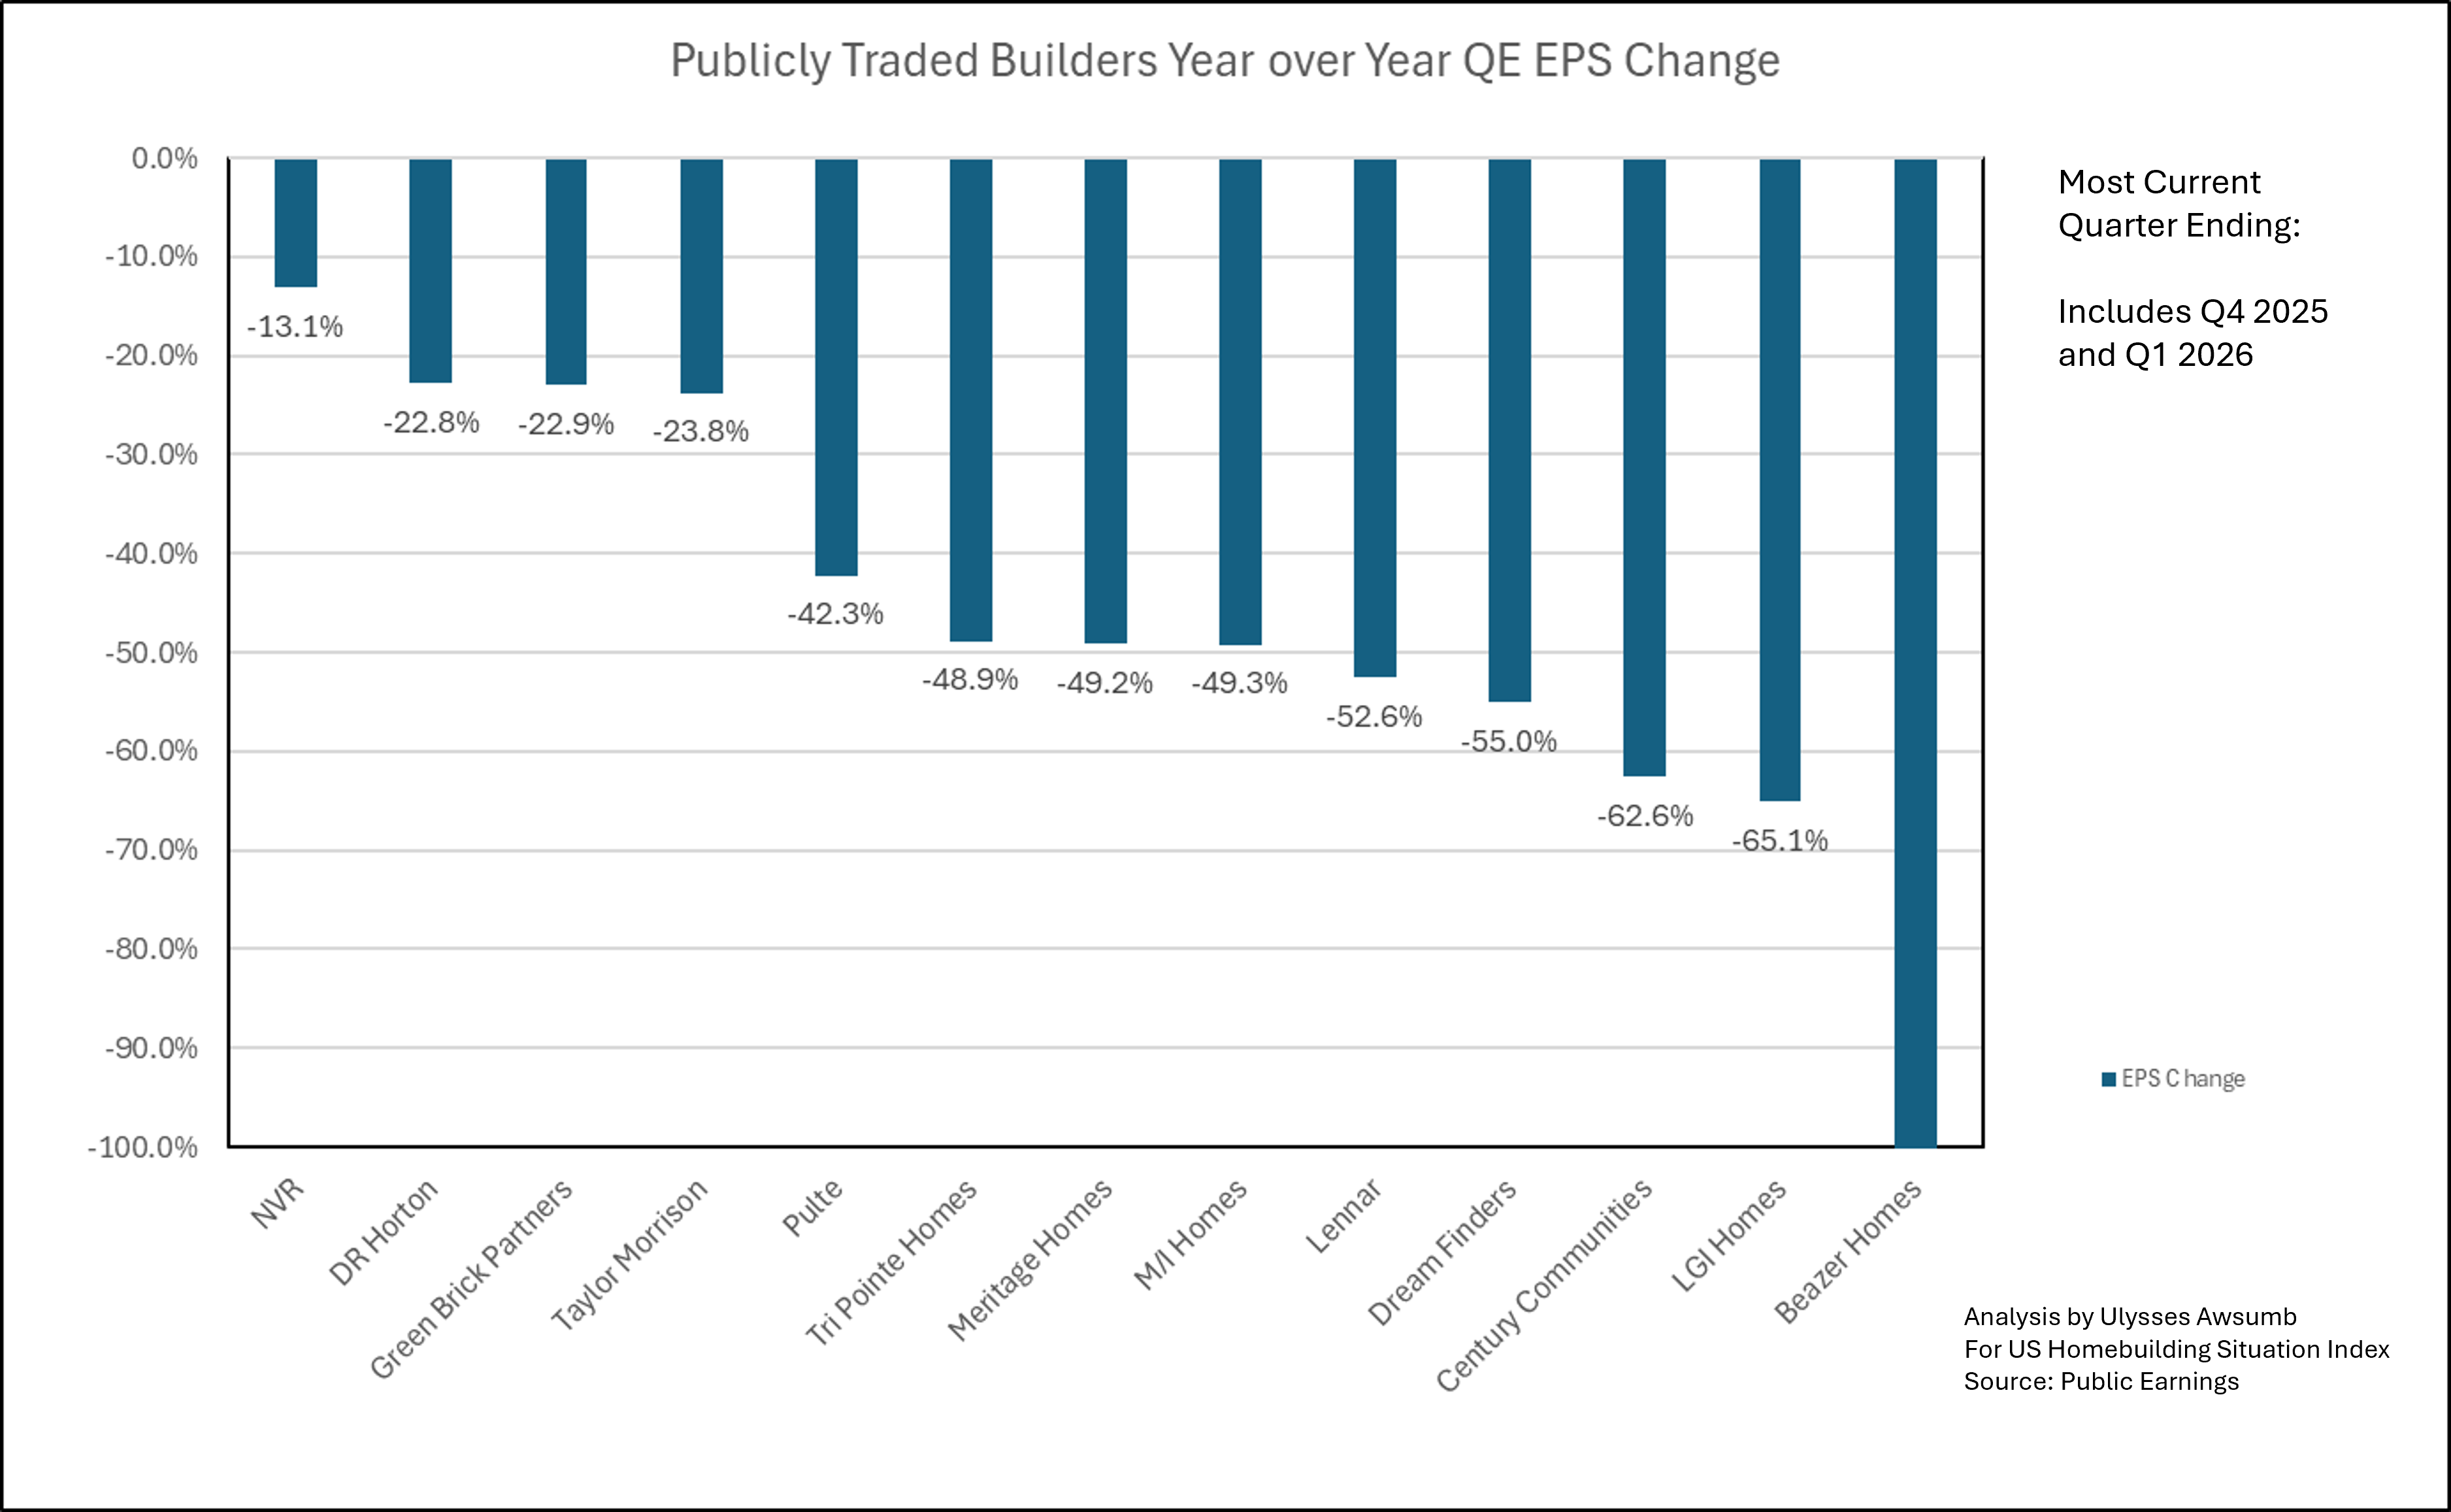
Compared with an average -42% decline in Earnings Per Share (when excluding Beazer Homes) year over year.
Fig. 12
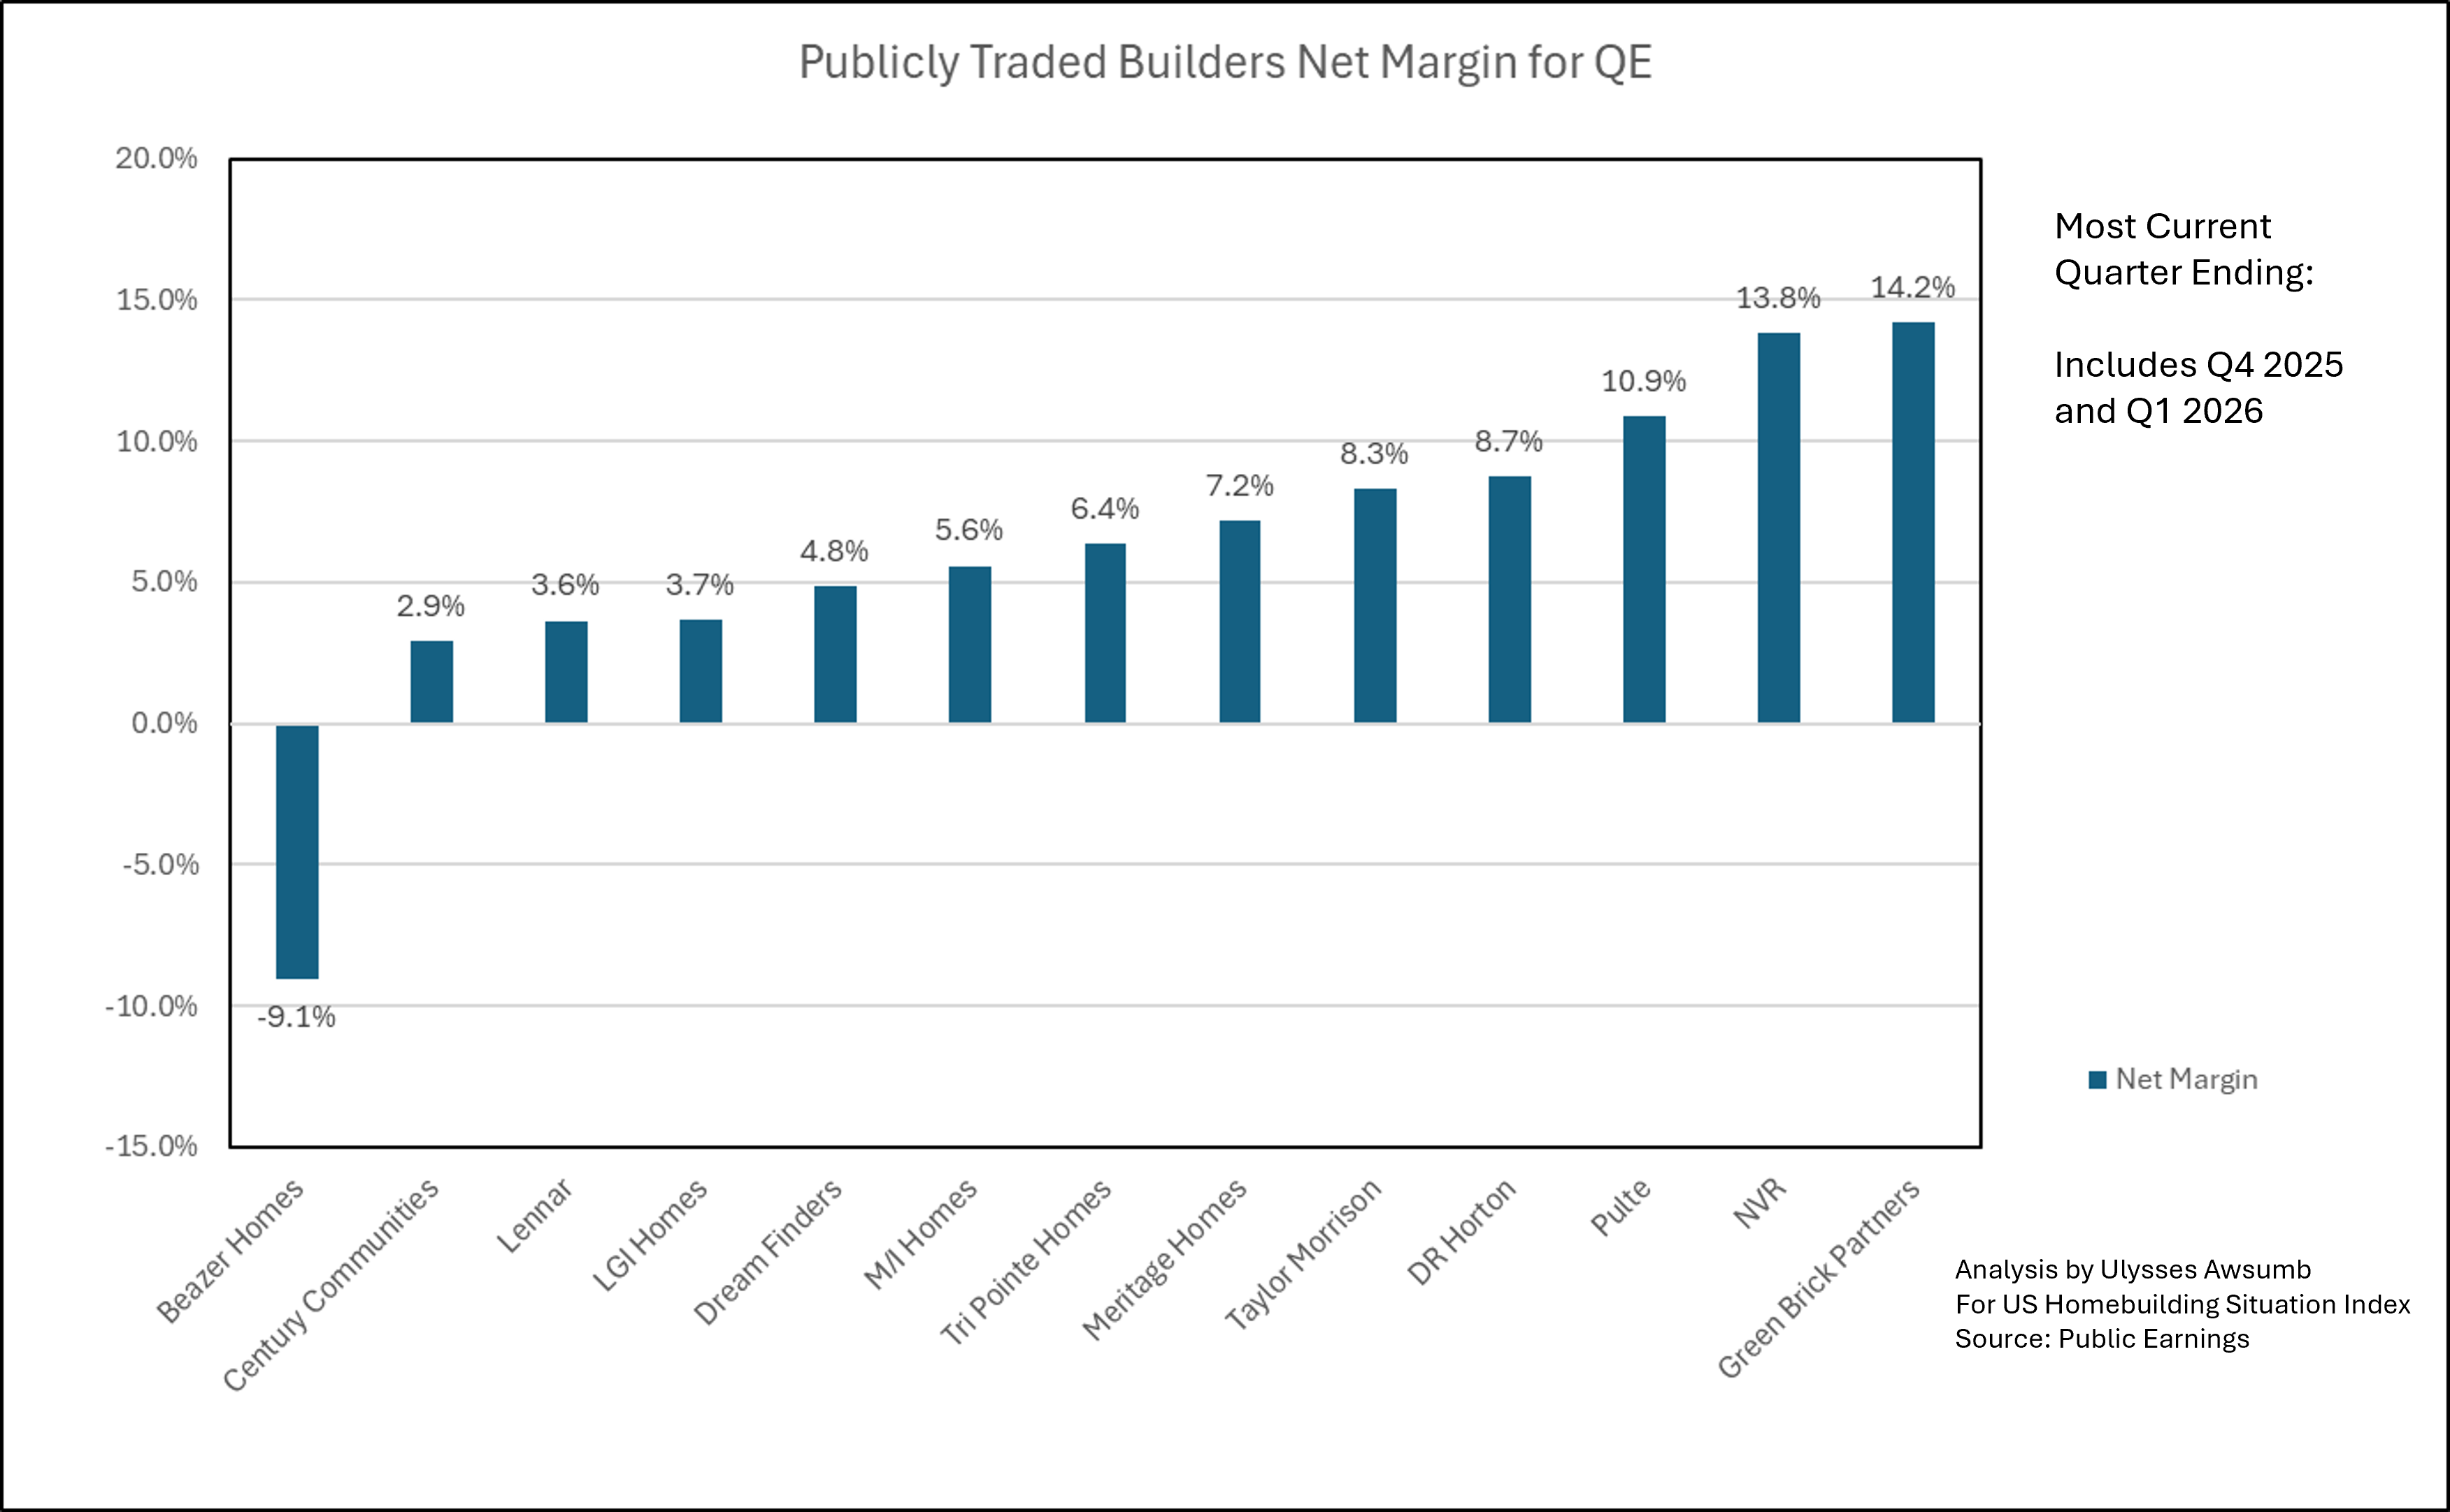
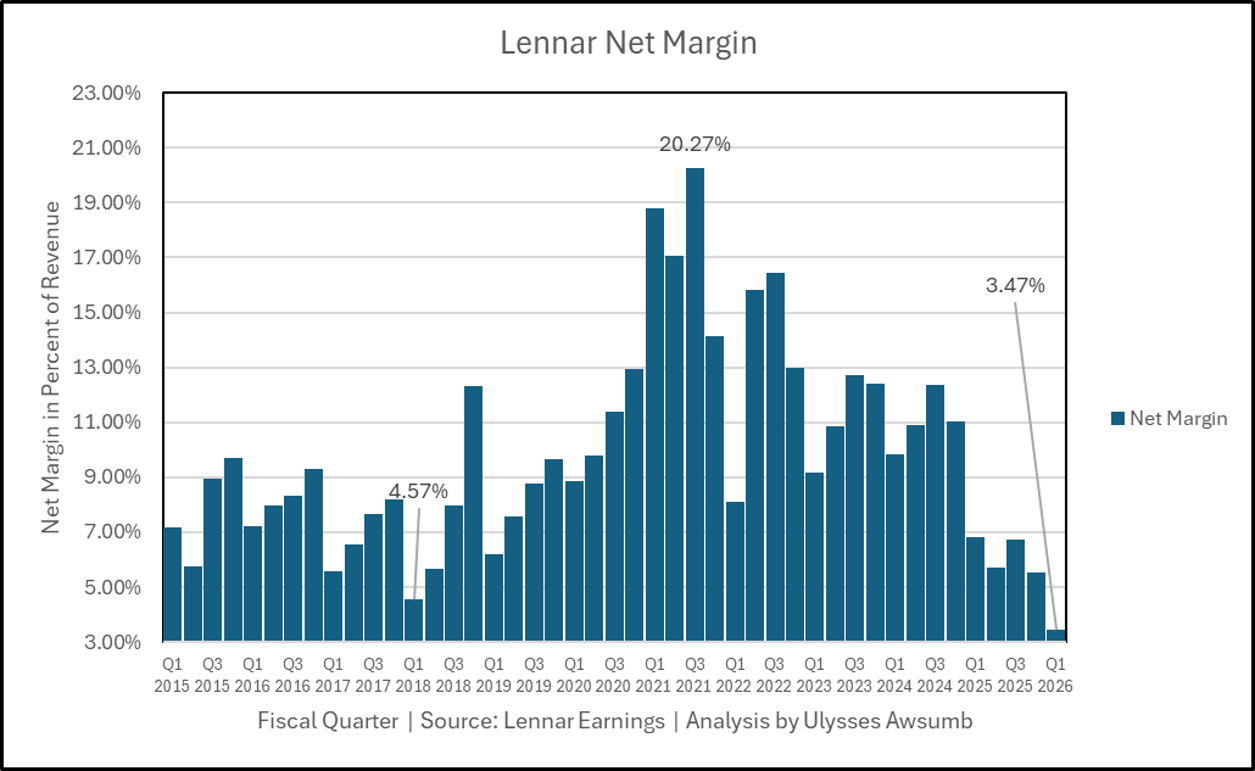
Net Margins have continued to decline as well. 5 of the same 13 builders have net margins < 5% while 10 have net margins below 10%. Lennar for Q1 2026 reported it’s lowest net margin in 11 years.
Fig. 13
Figures 14-16 will show the largest of these builders year over year change metrics. There should be no surprise if we see another -5-10% share price reduction for big builders by May.
Fig. 14
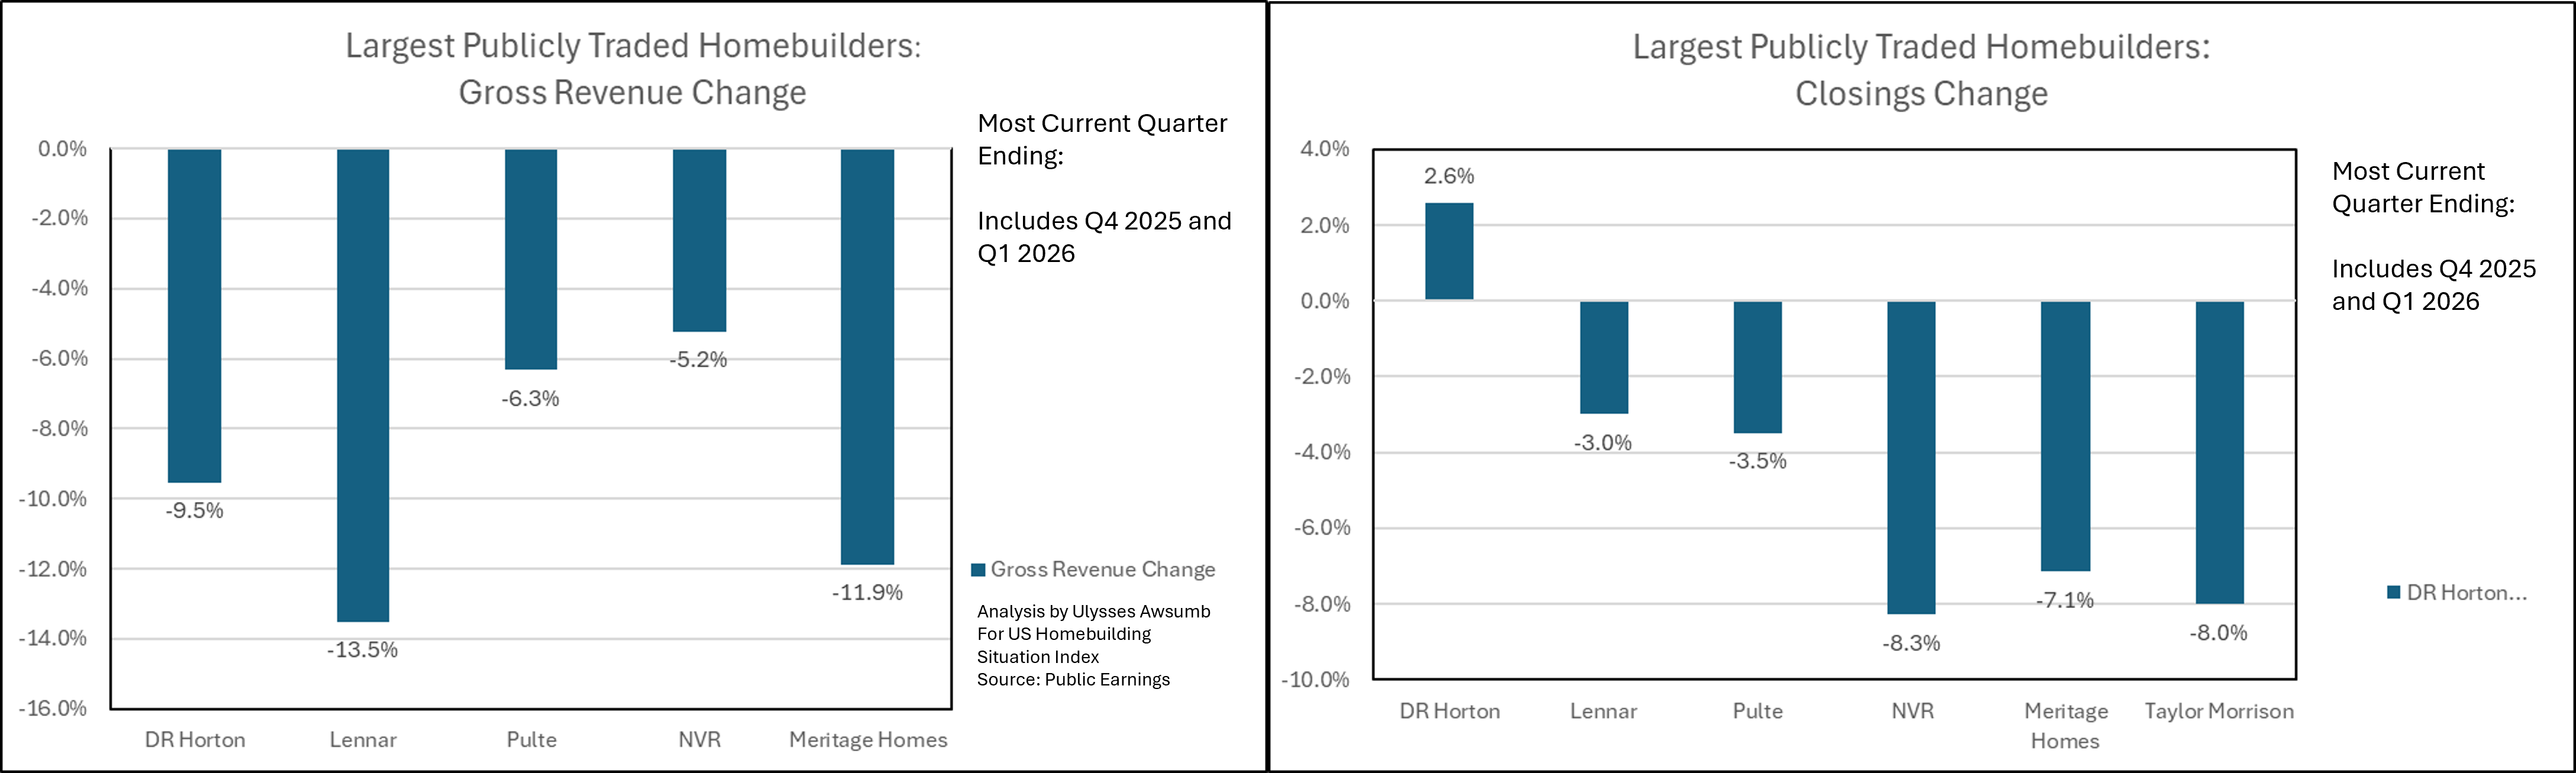
Fig. 15
Fig. 16
Lennar Earnings
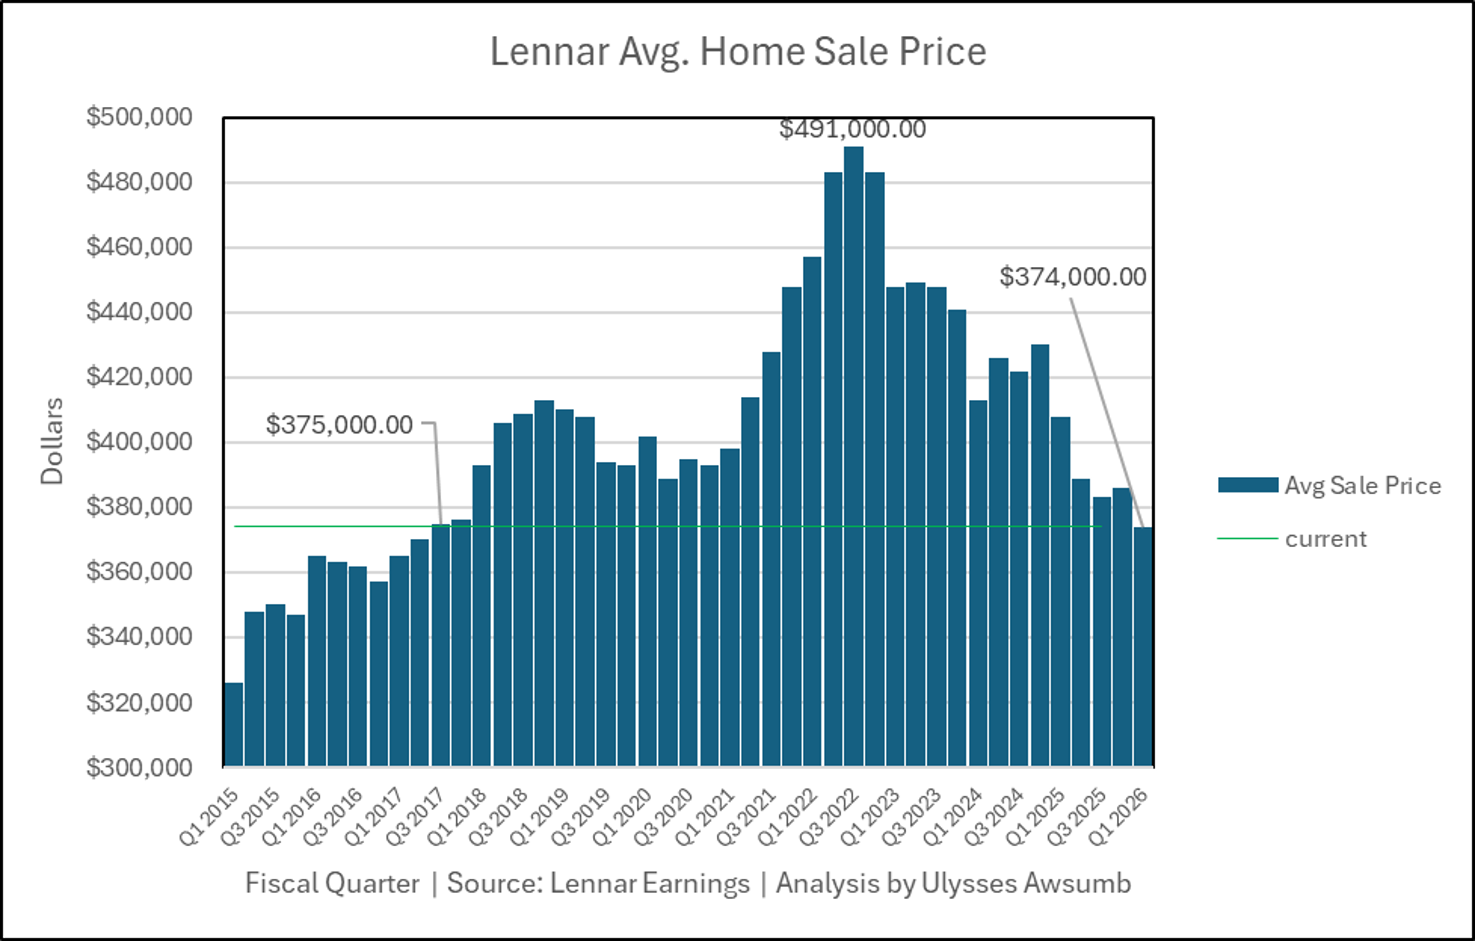
Lennar’s Fiscal Q1 2026 average sales price came in at $374,000. $16,000 below it’s 2025 Annual Avg. Price point, and fully back to prices last seen in 2017. 9 years of price impairment heading into what will be another difficult spring market.
Fig. 17
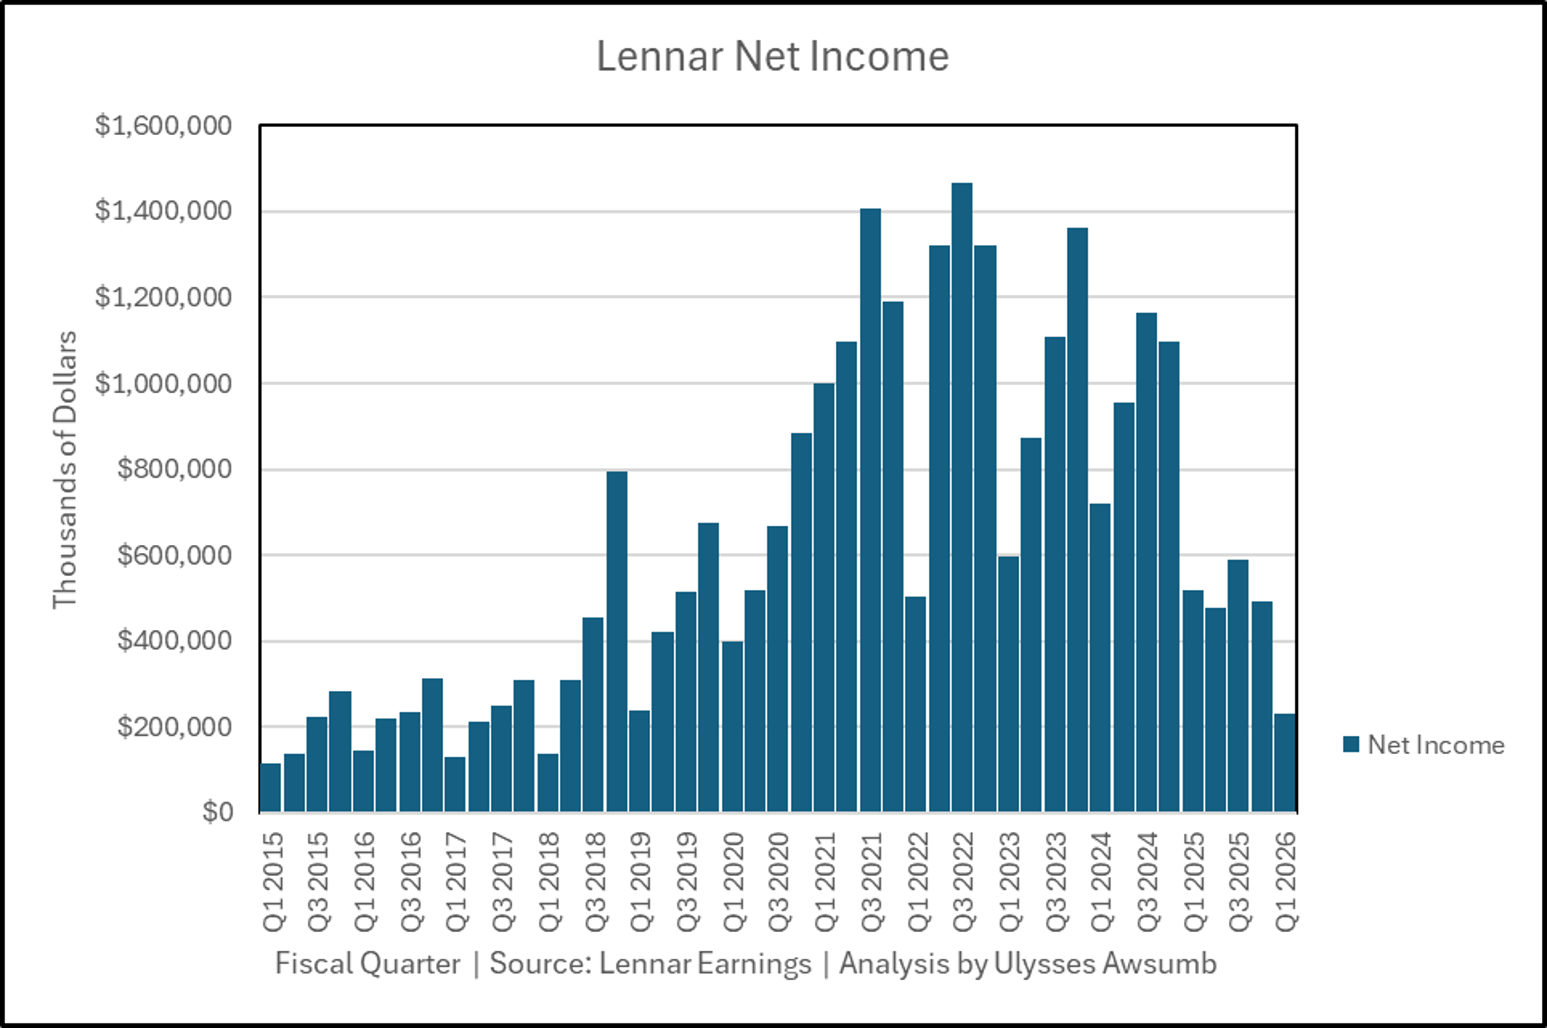
Net Income came in at the lowest since Q1 of 2019 with $225 million.
Fig. 18
Net margins were compressed to the lowest in 11 years going back to 2015.
Fig. 19
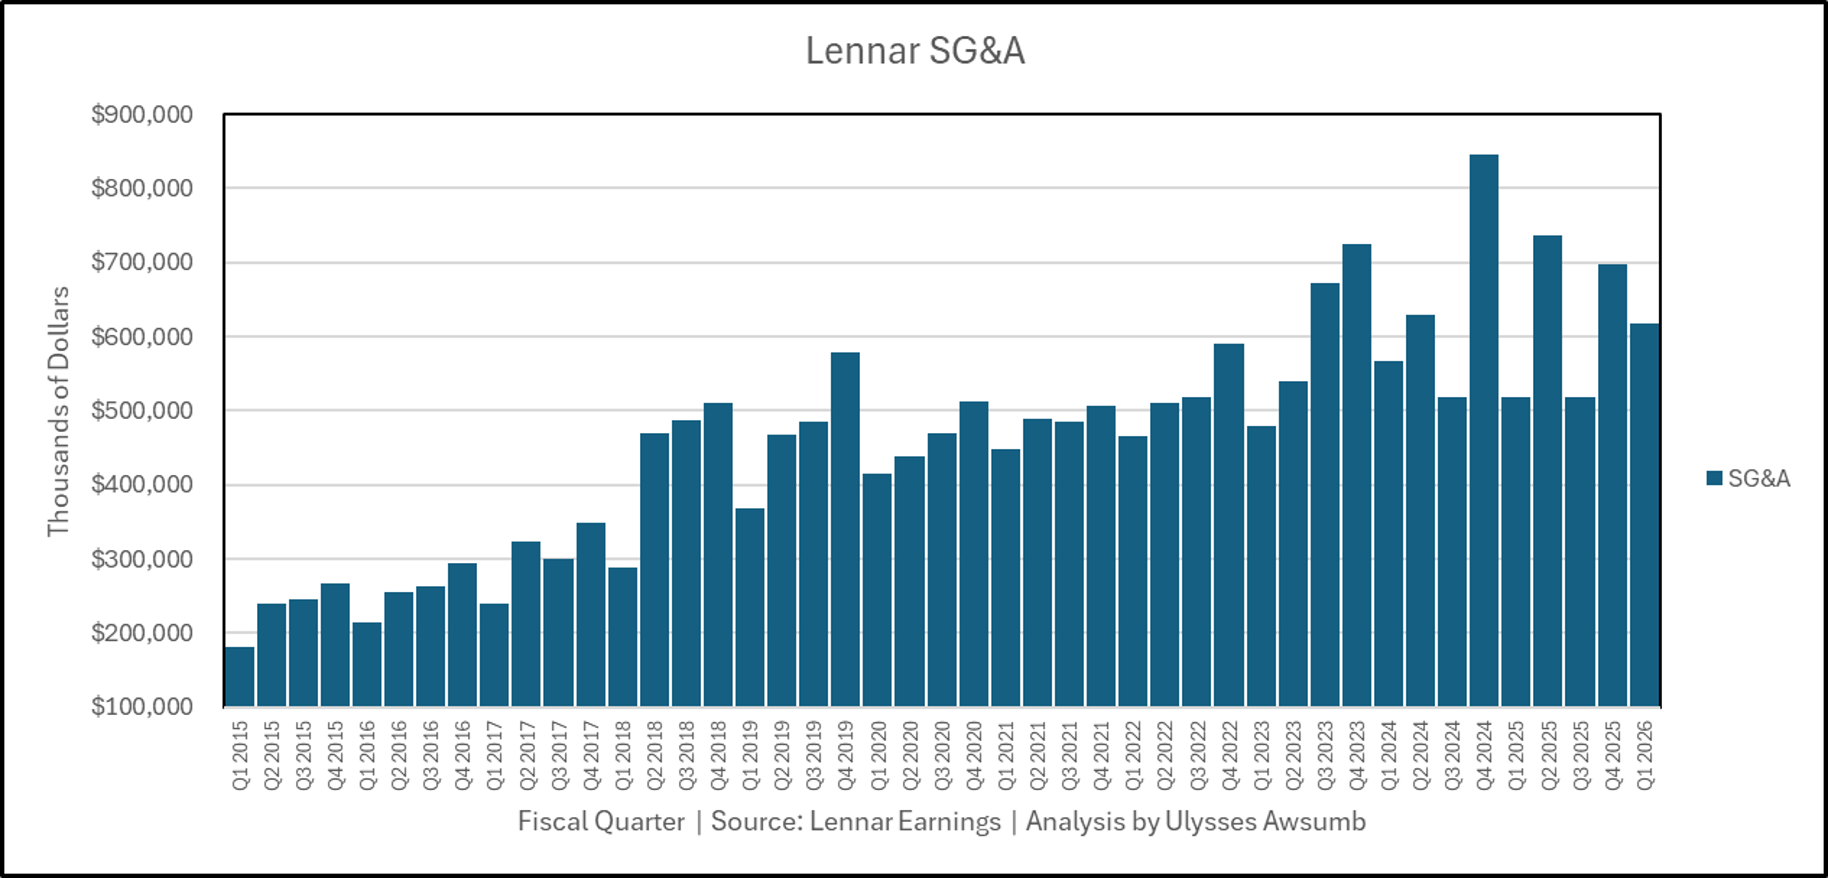
SG&A costs (selling, general and administrative) were nearly 3 times net earnings, clocking over $600 million. Most of this has come as incentive and buydown spending.
Fig. 20
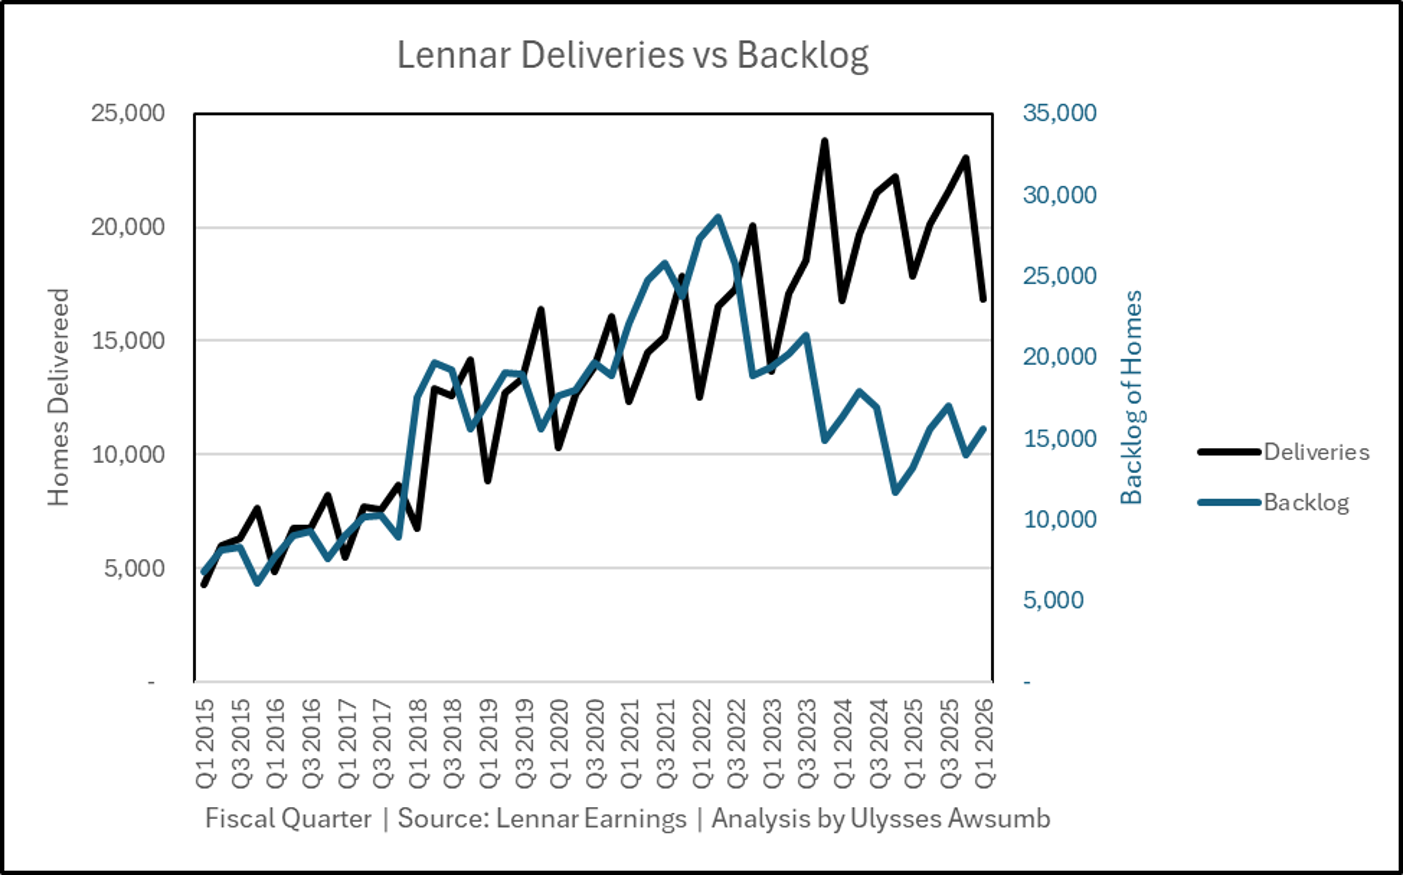
While those expenses have helped keep closings relatively apace, the bottom line is trending the opposite direction. Figures 21-23 will show trend lines in spending, income (both gross and net) as well as delivery vs backlog changes.
Fig.21
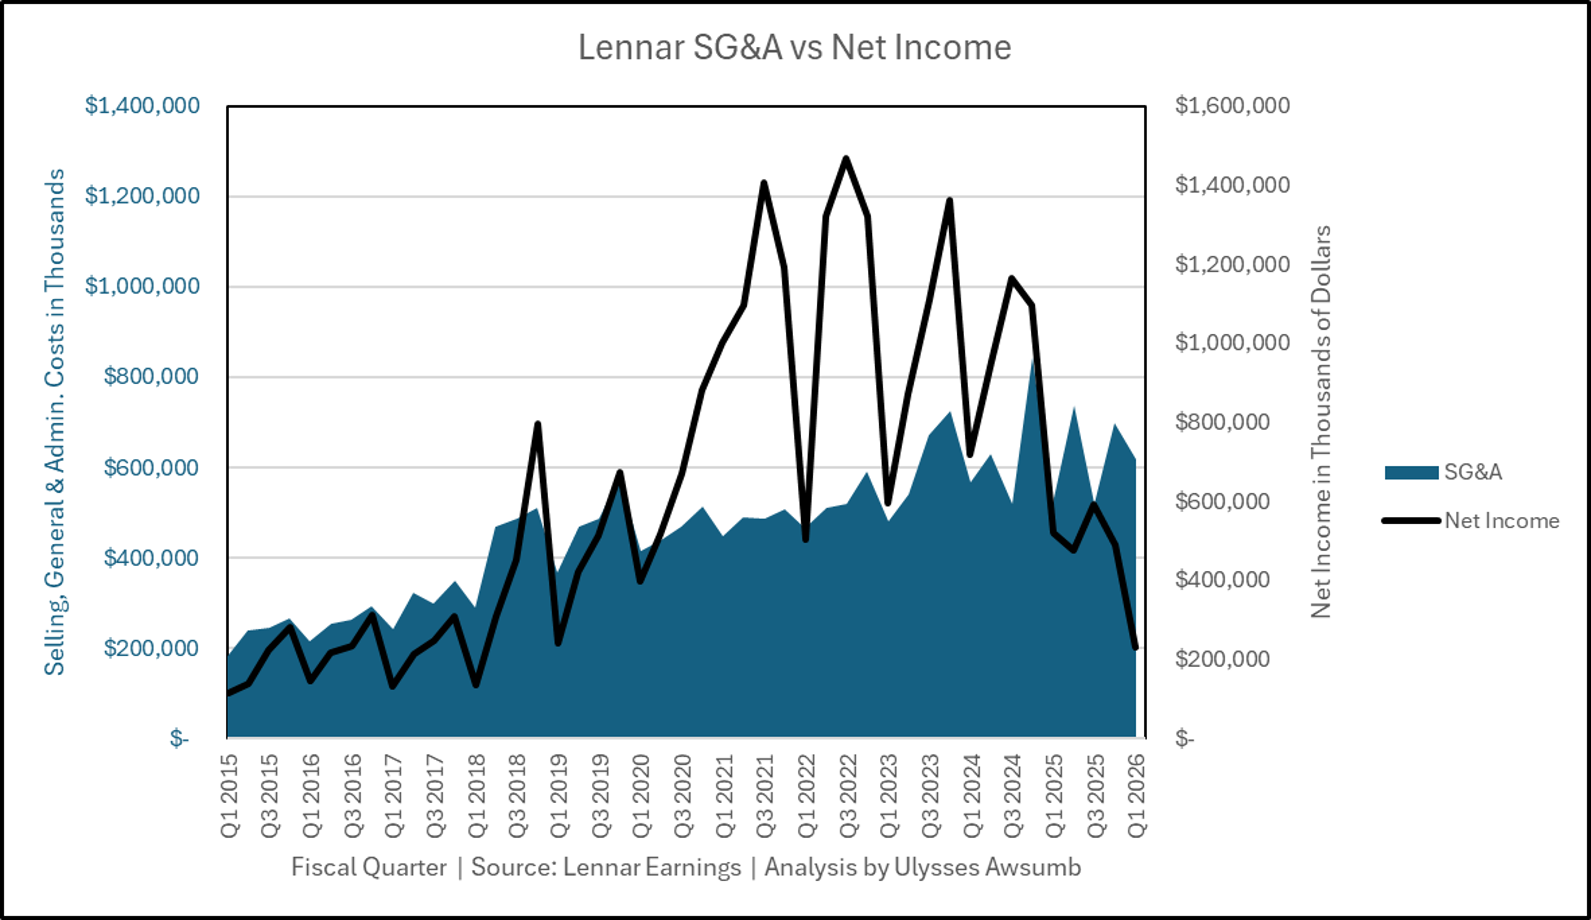
Fig. 22
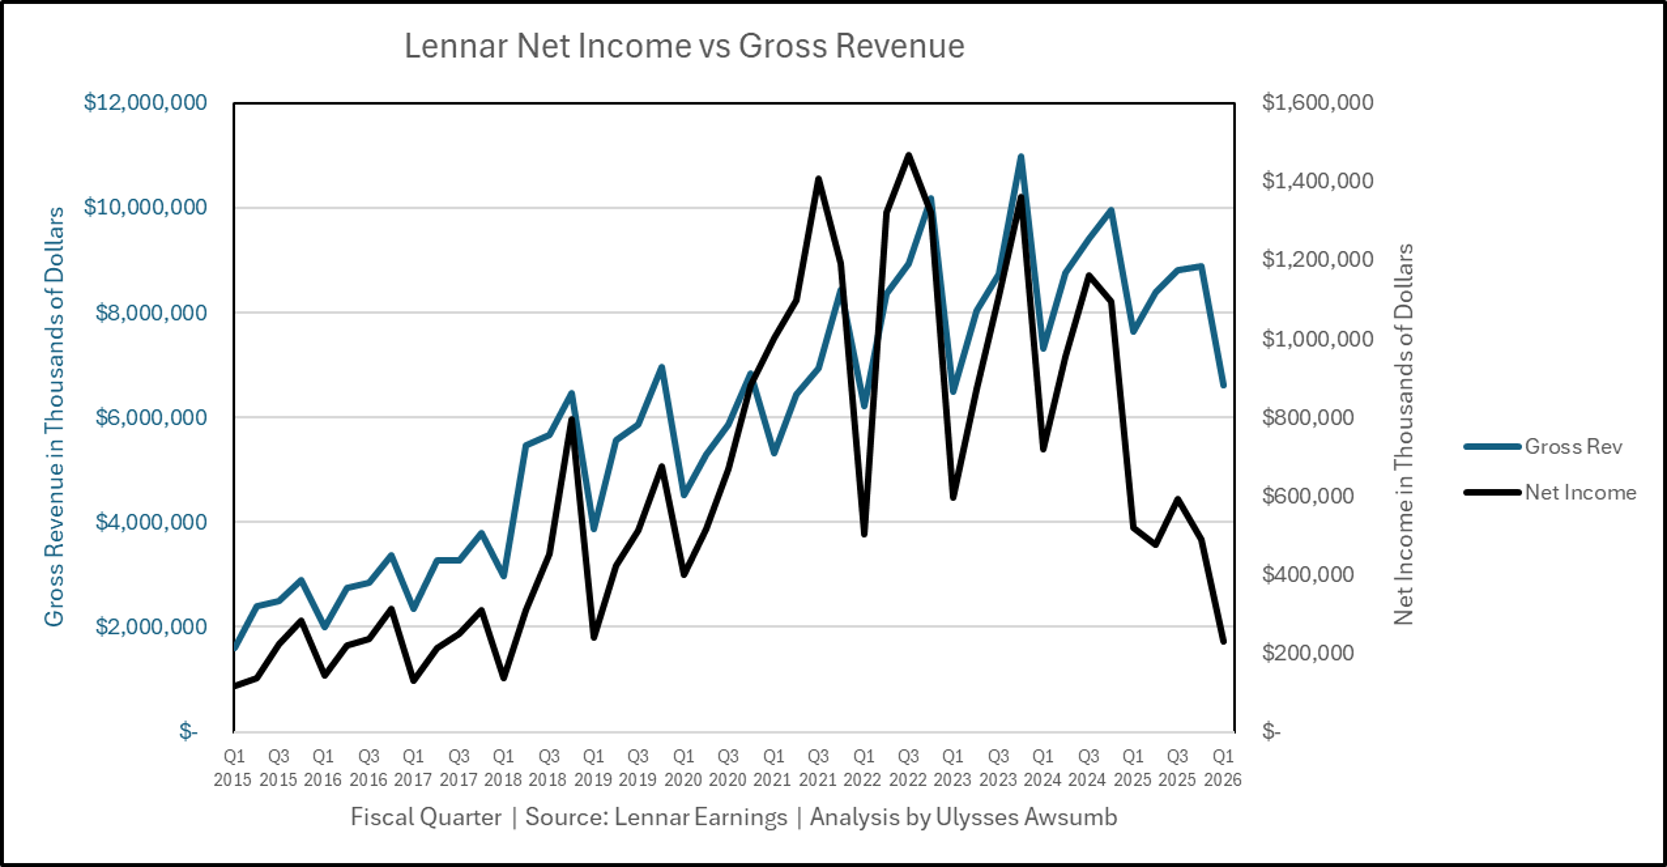
Fig. 23
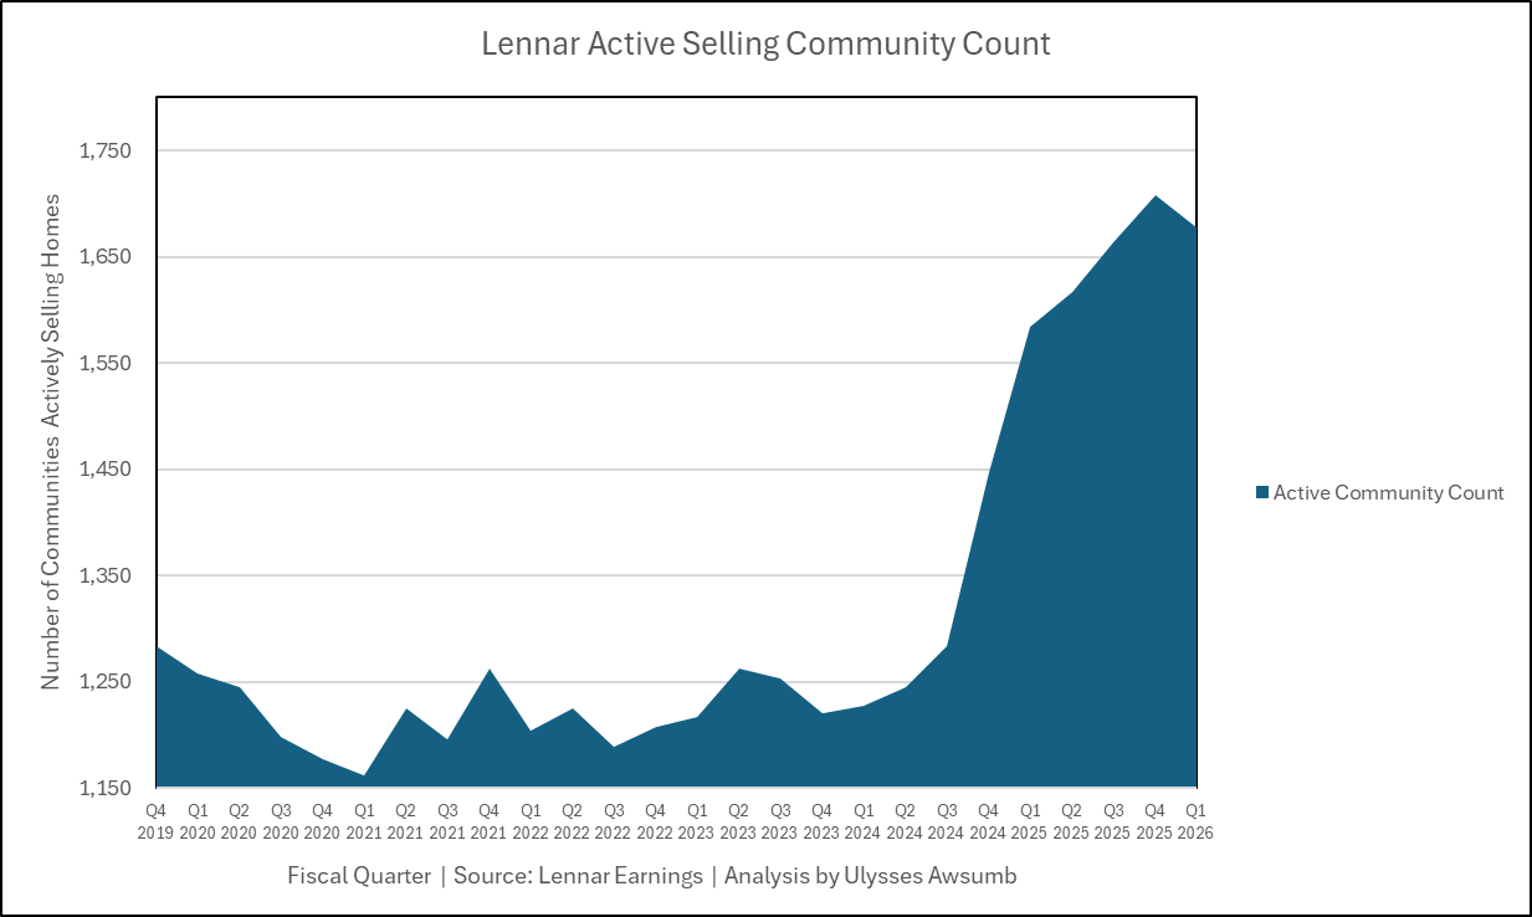
Active Community Count for Lennar remains near all time highs. 2024 saw huge increase in community opens, while 2025 added to those via the Feb. 2025 closing on the acquisition of Rausch Coleman Homes (Fig. 24). The same time Lennar spun off land holdings to Millrose.
Fig. 24
Home Price Components
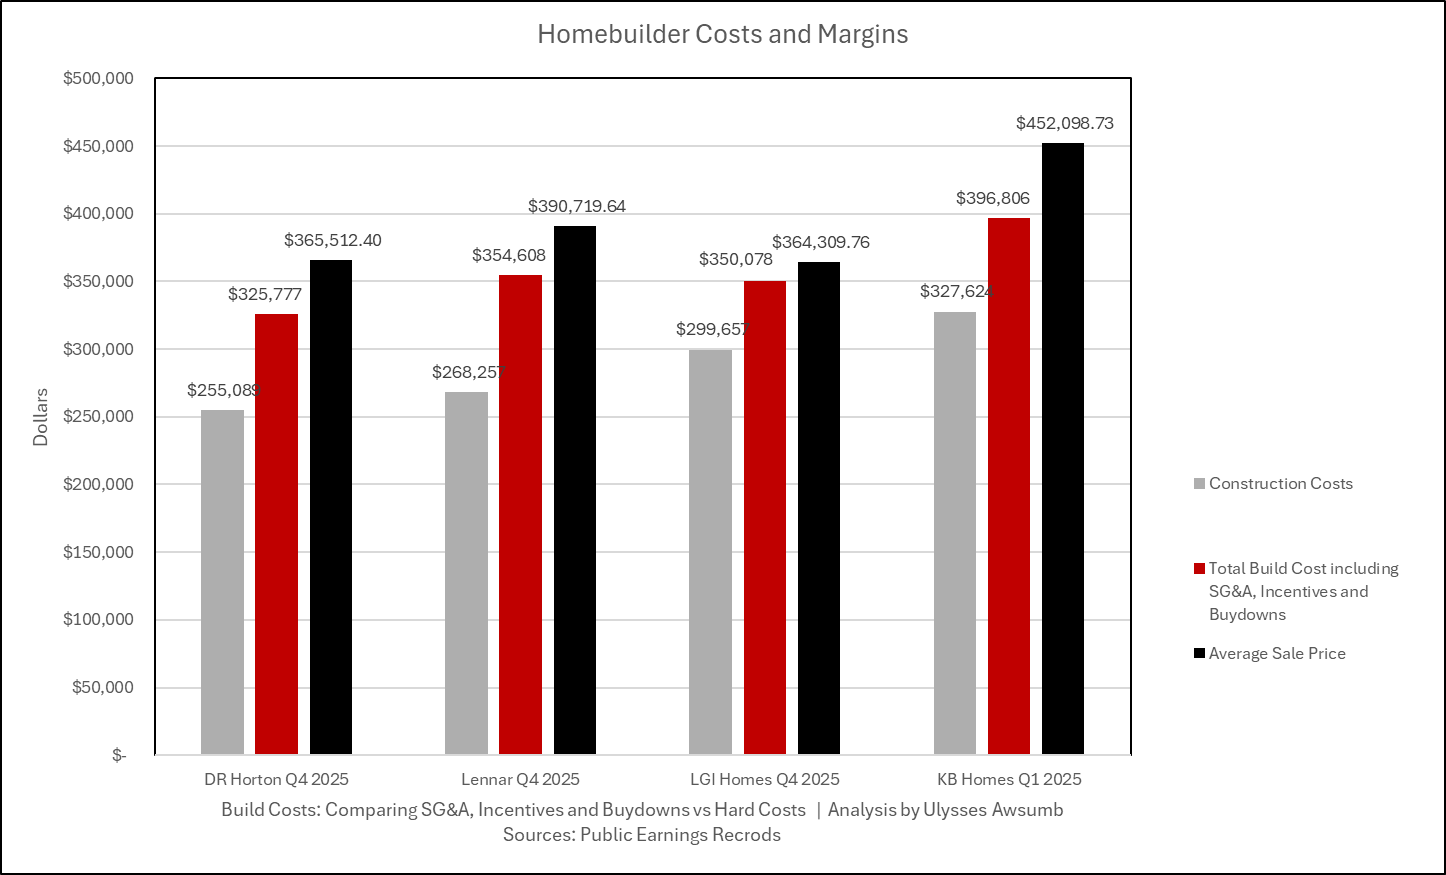
While Lennar may have lost public pricing power on the sale side of homes, they maintain the power to push what pricing components they can lower. Lennar is the 2nd largest publicly traded home builder in the United States. They represent nearly 12% of home sales market share by volume of sales as of 2025. Figure 25 compares the costs of building, such as land and construction costs vs additional incentives and sales price of 3 other builders (shown in order of increasing build costs). Only DR Horton (The largest publicly traded builder in the US) is building for lower construction/lot costs.
Fig. 25
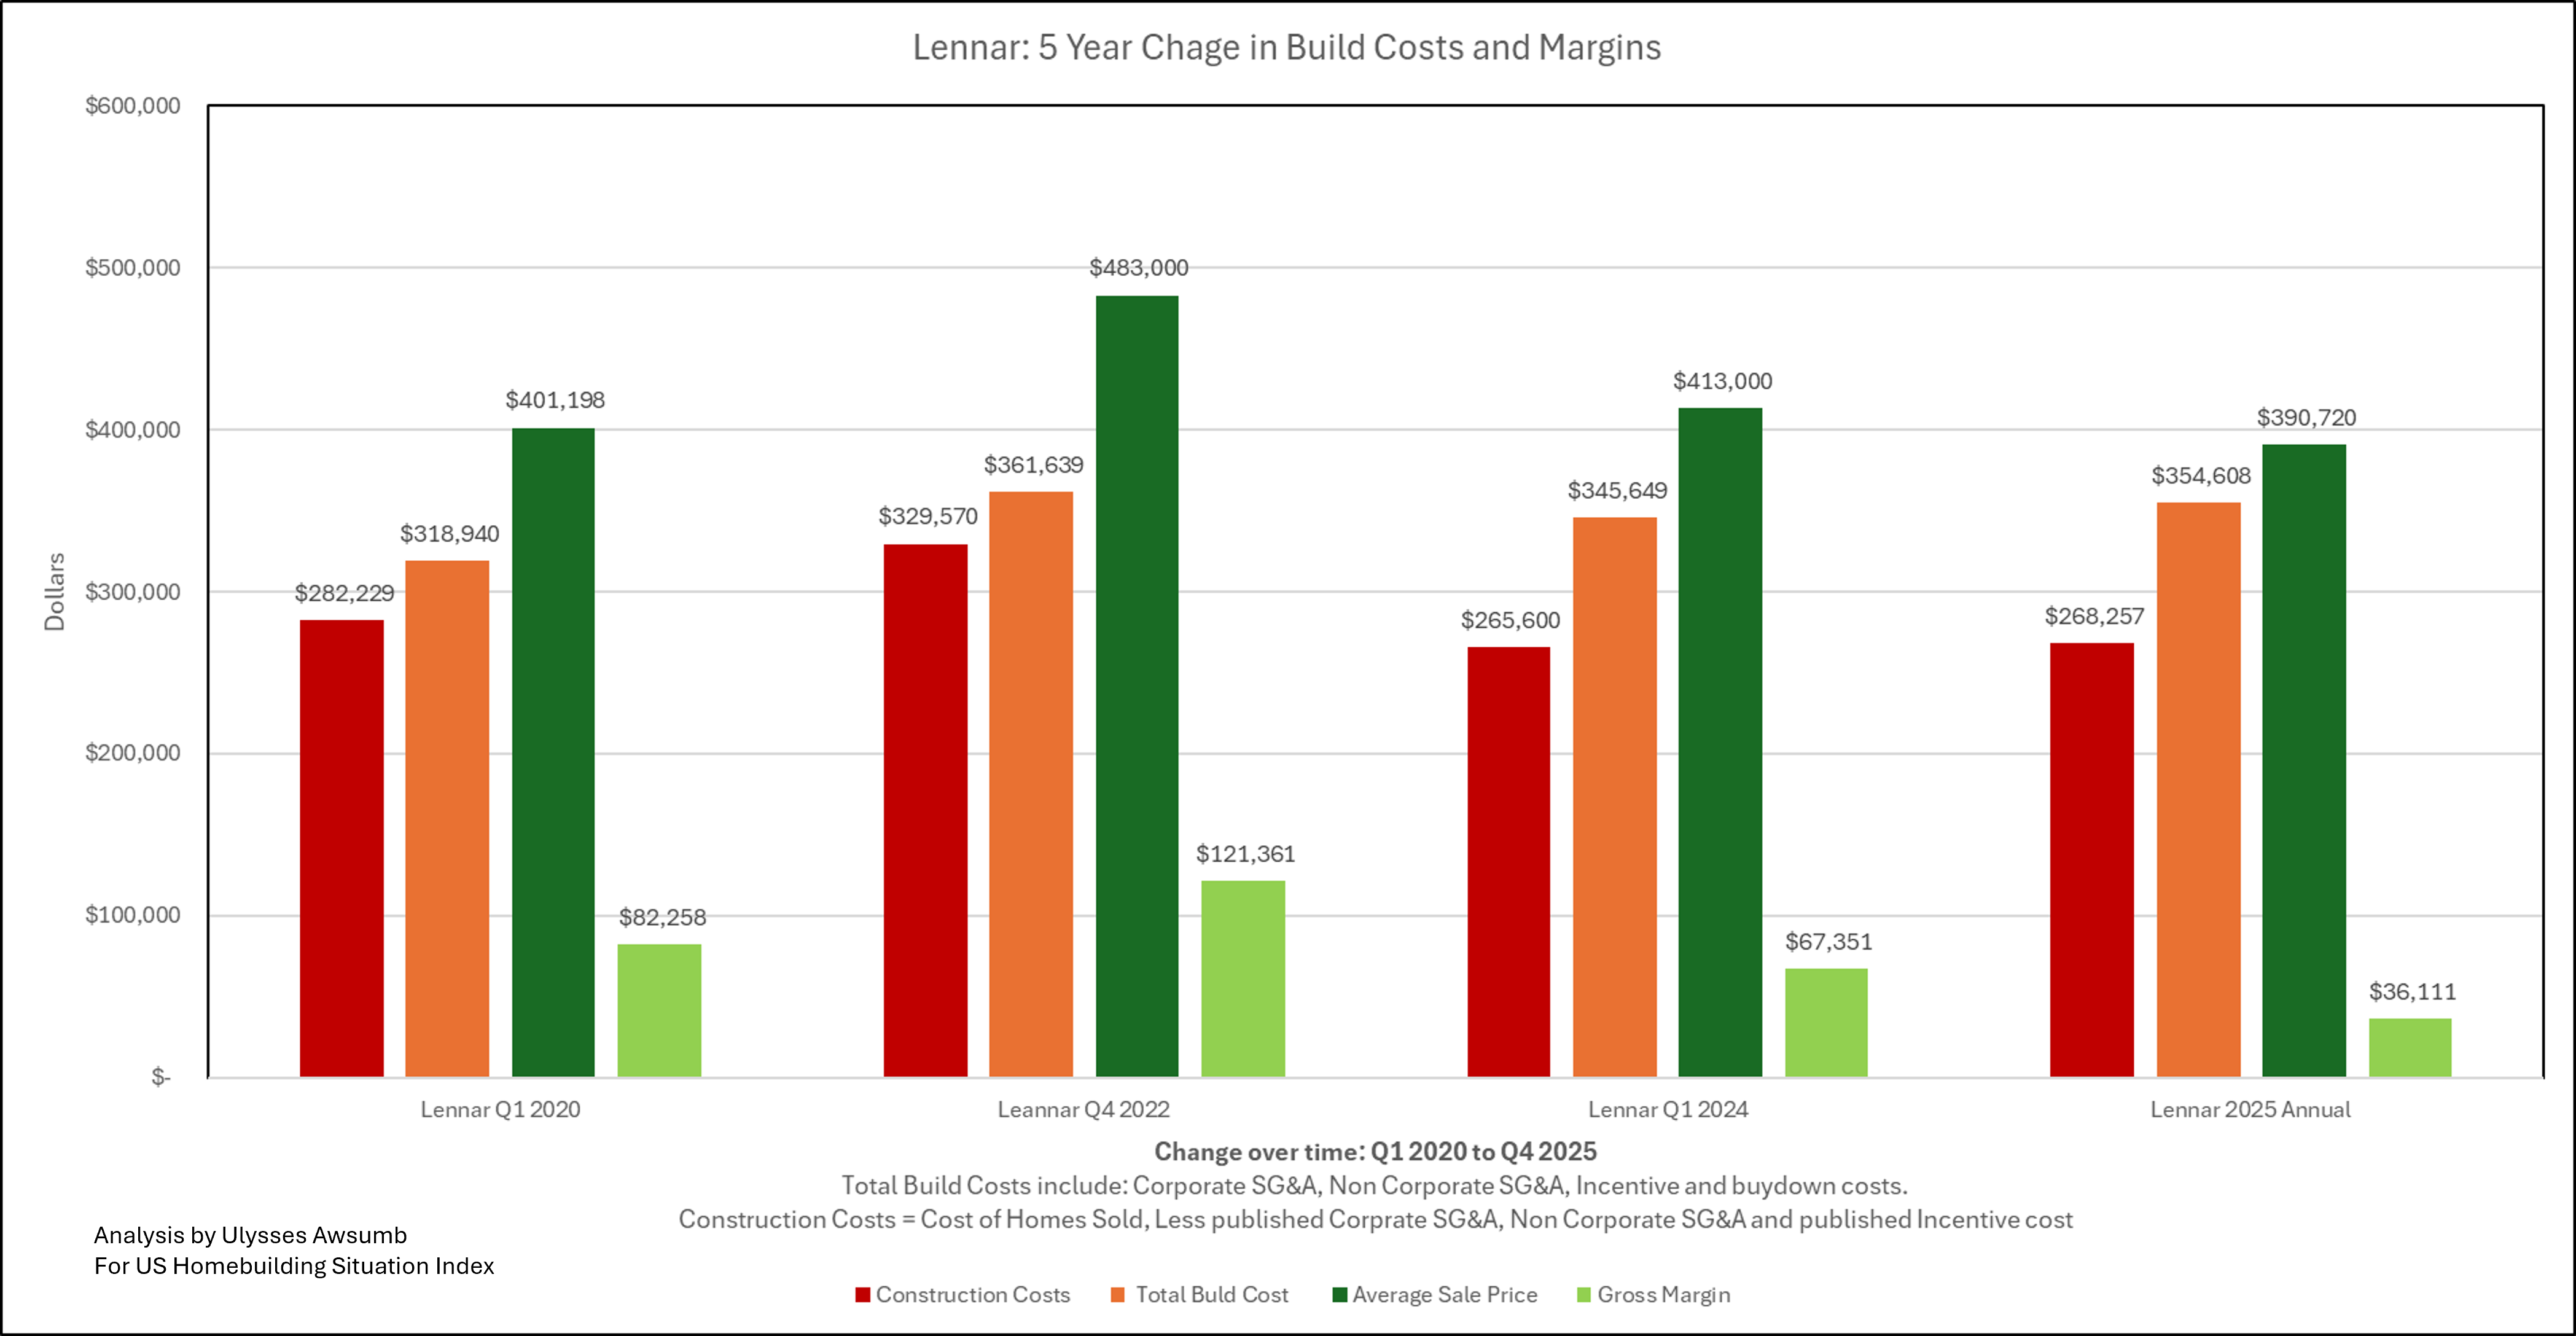
To further highlight Lennar’s ability to push pricing downward on hard costs, despite its record high $62,700 per home incentive spending, Figure 26 will show a sample of costs over 5 years. Since 2022, build costs have been pushed down by -18%. These costs savings come from a combination of:
lower cost of lumber and building products
lower cost of fuel
lower cost of trade partner pricing
That last component is effectively shifting some margin compression from Lennar to it’s smaller skilled trade partners. Too much push however can have serious impact on Lennar’s ability to deliver timely product and thereby earnings, as smaller firms cannot withstand the margin compression in the same fashion large builders can. Firms under $15m in revenue have vastly different access to credit and capital than larger firms, and an outsized share of the trades companies building America’s homes operate well under that revenue figure.
Fig. 26
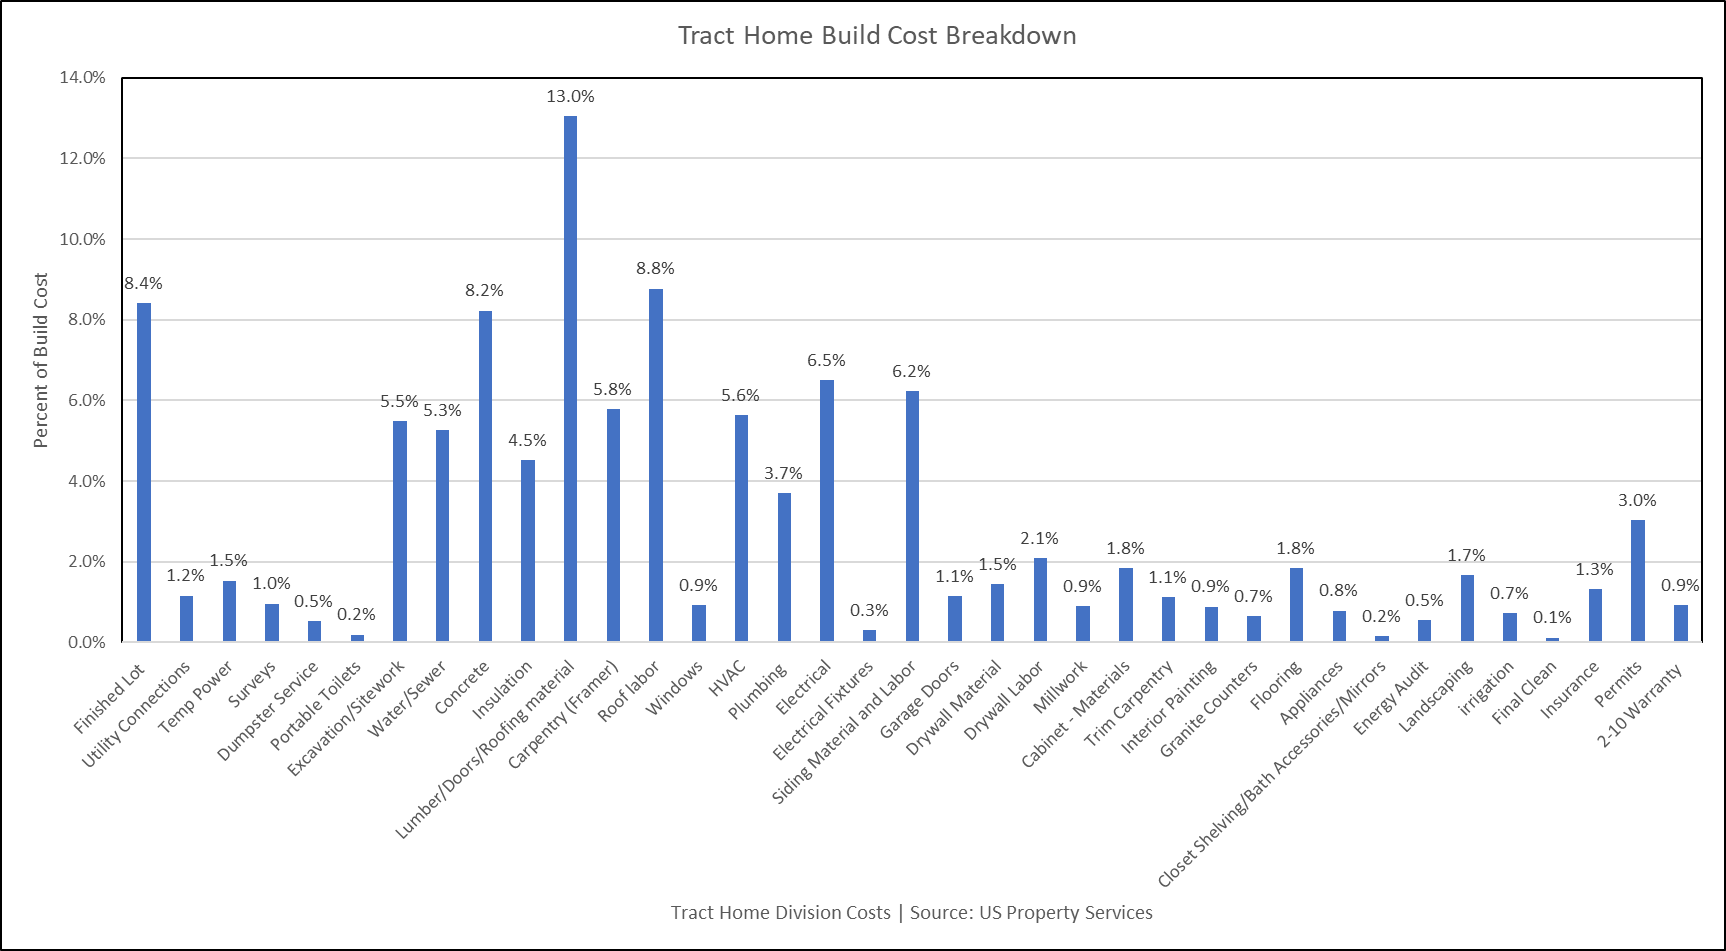
To further illustrate those build costs, we’ve pulled from internal files to show similar tract build cost components. Those are shown as dollars in figure 27*, and as percent of build cost in figure 28.
Fig. 27
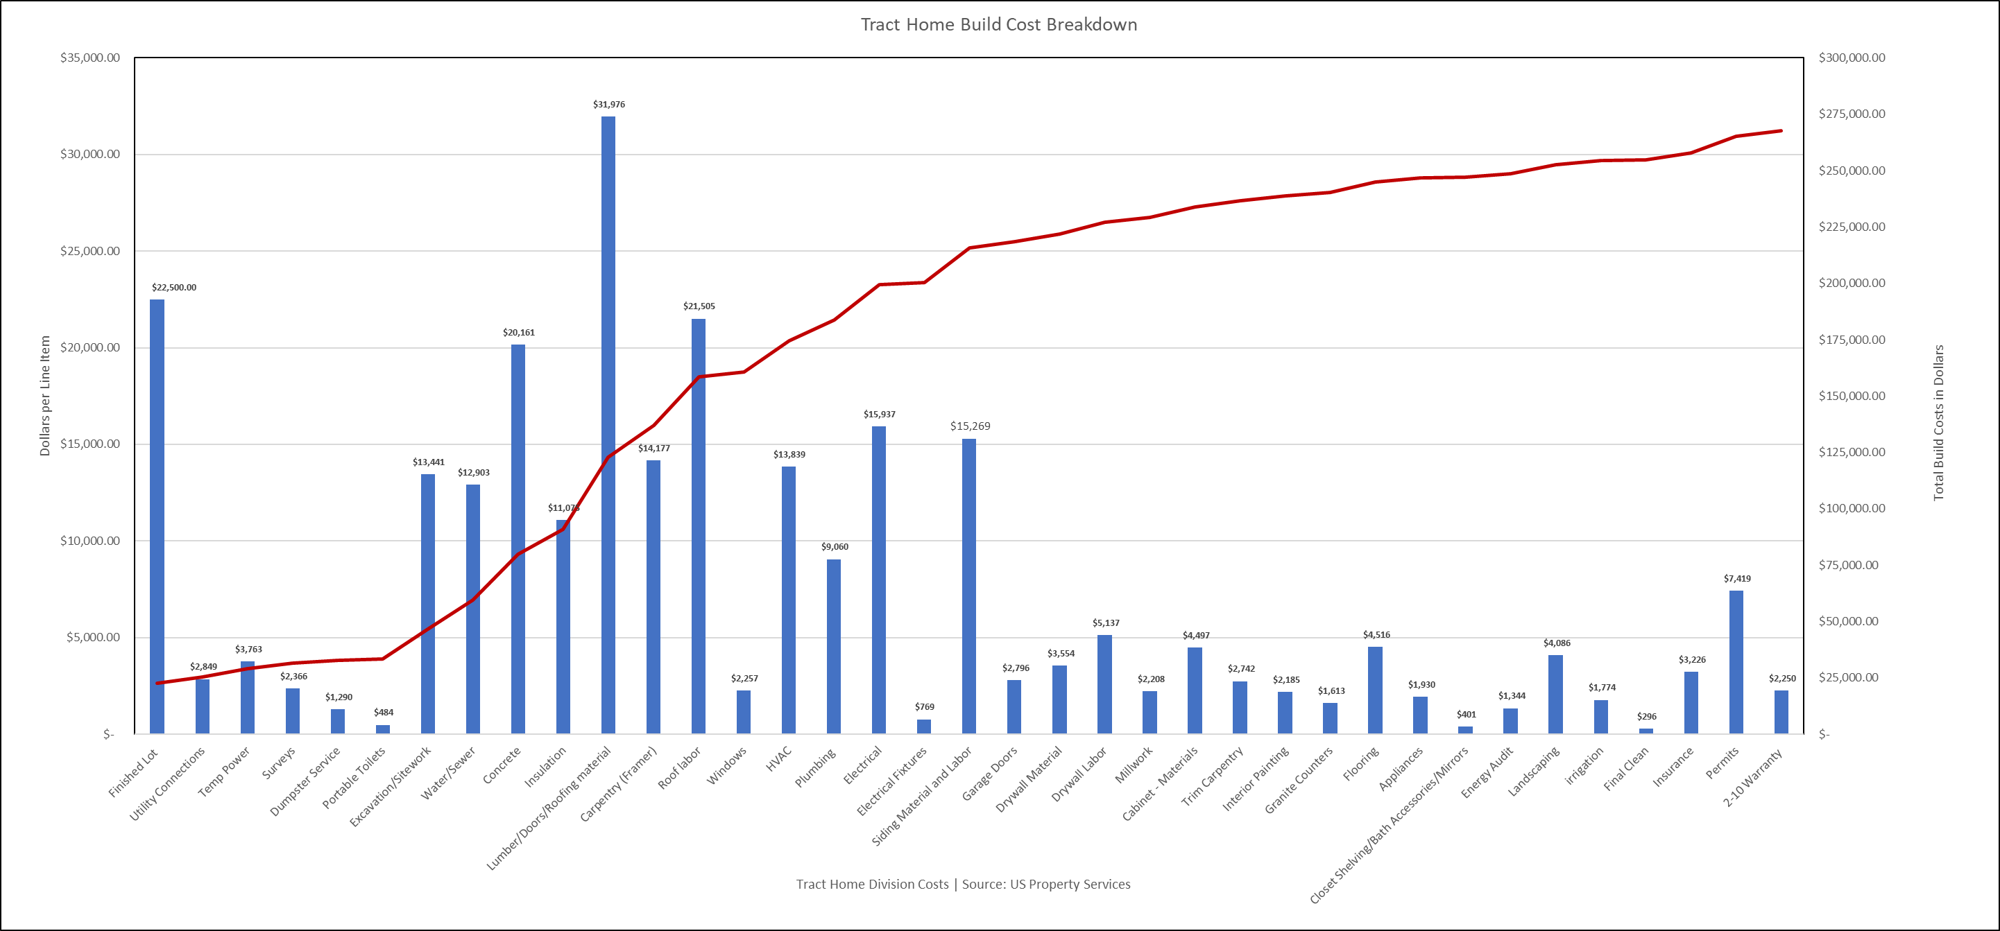
*Depending on location, concrete/foundation and excavation/site work costs can vary greatly. This is due to regional code requirements, weather and subsurface soils that create conditions ranging from “scrape and pour” (often with post tension slabs) to excavation 4’ below grade at minimum, with concrete footings and frost walls. In areas where these costs are less, they can often be replaced by higher costs of cladding including tile flooring, stucco exteriors, and tile roofs.
These figures represent the breakout of what goes into building a tract home. They include finished lot costs (after turning raw land into buildable lot in a new neighborhood), utility connections, permits, and unless noted separately, turn key trades such as MEP’s (mechanical, electrical and plumbing). Turn key suppliers provide both material and labor for projects. 2-10 Warranty represents an insurance program commonly used by builders, to insure statutory warranty requirements can be met in the event they are unable to.
Fig. 28
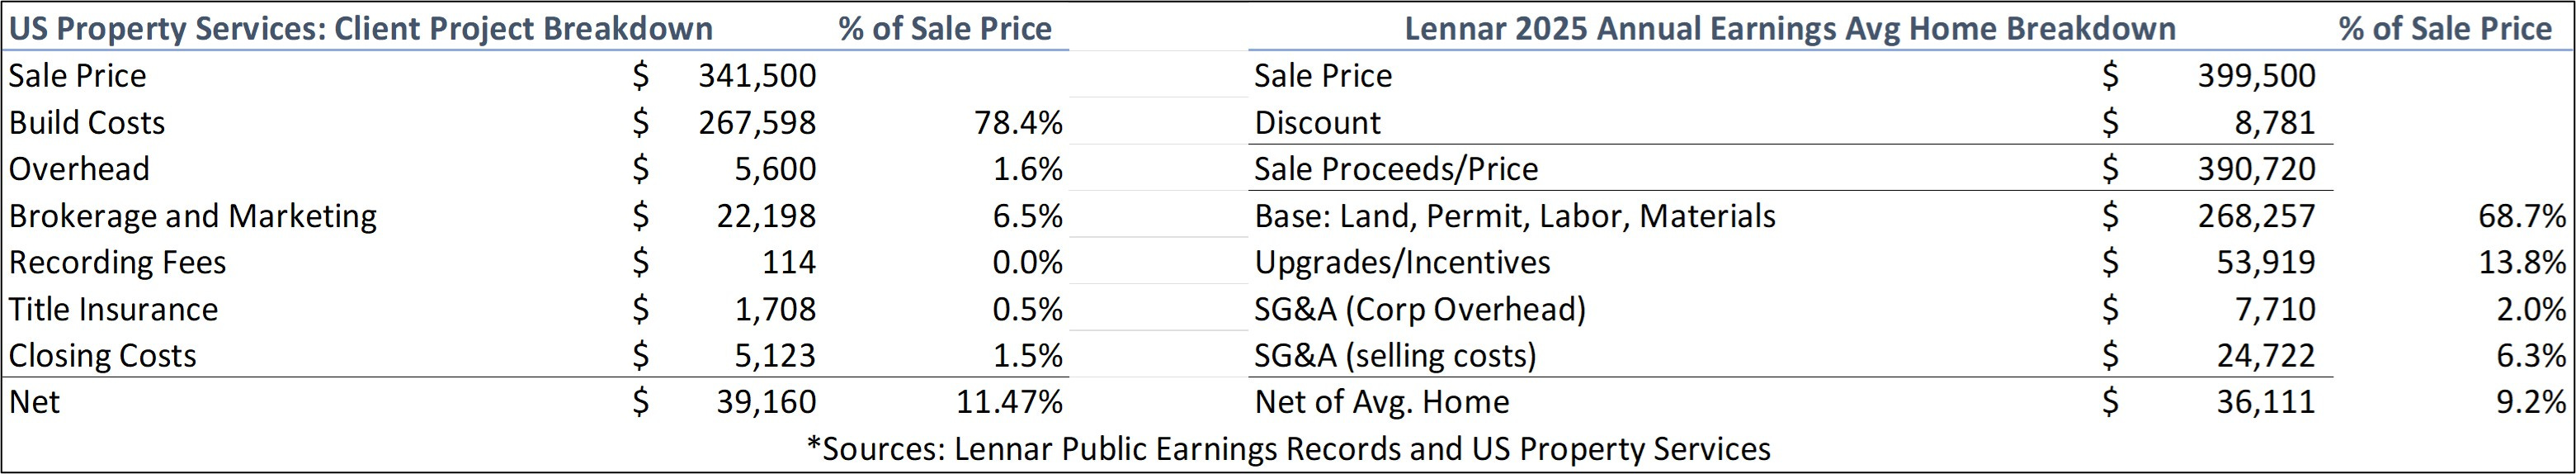
Using these nearly identical build cost components to Lennar, we can break down and compare projects, both in reported earnings format vs what you’d look at developing said project internally in figure 29.
On the right of Figure 29, we pulled from Lennar’s 10-K, to analyze what that $62,700 in incentives looks like compared to our internal client project file.
Lennar separates their SG&A into two categories: Corporate and Non Corporate. Corporate represents costs such as their construction manager, accounts receivable/payable salaries, office portion allotment etc. Whereas non corporate accounts for commissions, special marketing, and for some builders: buy downs.
Though in the case of Lennar those can also be represented in the separate “incentive” category. This comparison clearly shows the impact of those additional cost, while trying to maintain pricing, delivering a lower margin than the project on the left which sold for nearly $50,000 less.
Fig. 29
While the internal project represents a nearly $50,000 price savings, on a monthly cost basis supposing:
Lennar buys down rates to 4.1% vs 6.1%, using 80% LTV ($273,200 vs 312,576 financed) the $390,720 purchase, principal and interest only payment would save $145 per month for the buyer vs buying at $341,500 at 6.10%. Suffice it to say, the market is challenged.
Fig. 30 shows regional incentives offered by Lennar in specific communities.
Fig. 30

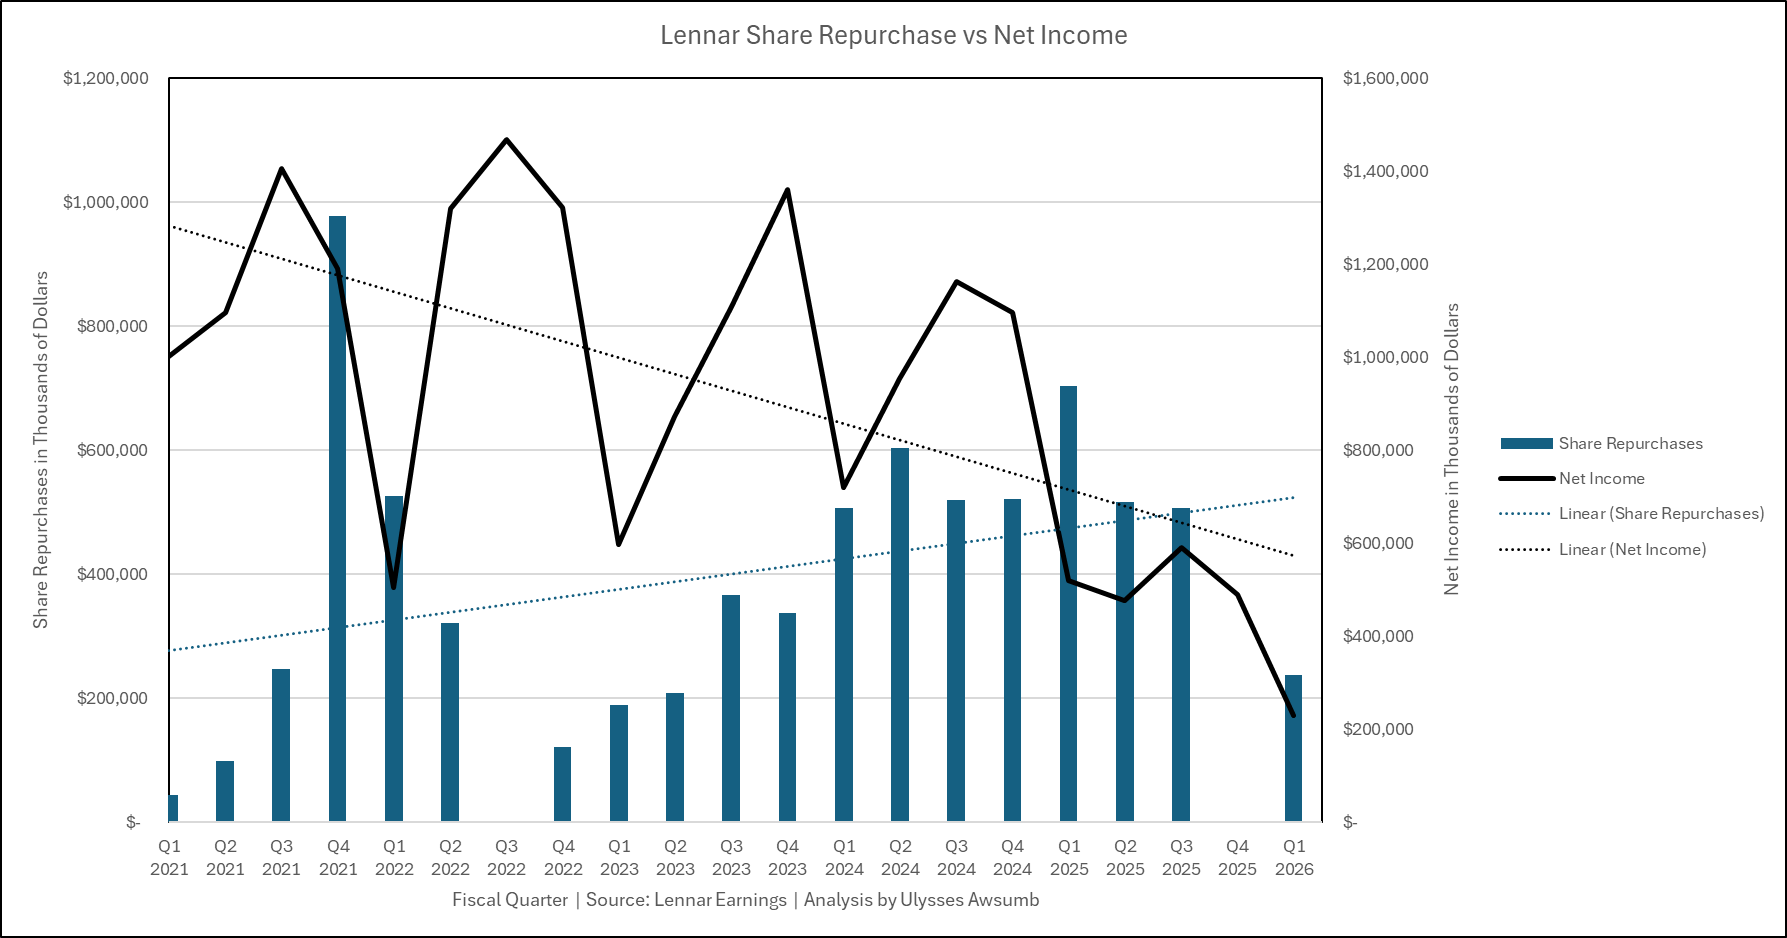
That additional spending isn’t the only thing delivering diminishing returns though, as share repurchases are doing less in the way of returning more net earnings, as shown in figure 31.
Fig. 31
Crude Oil, Diesel and Regulations
With the current environment of escalating prices of diesel, which is used to transport all manner of construction materials, and on job site build equipment, we took a look at the last 40 years of diesel prices overlaid onto new home sales. Higher diesel prices correlate to lower new home sales volume, both as the price per gallon rises and more so as it spikes. This is illustrated in figure 32, with orange dotted horizontal bars showing sales rate changes as diesel is elevated. It becomes even more smoothed when crude prices are overlaid on the US Homebuilding Situation Index as shown in figure 33. Both figures show Jan sales conditions as published vs up to April oil/diesel prices.
Of significance, a large portion of builder communities exist in new ring/outer ring/further out locations to city centers. This helps reduce costs, however extends commute times for perspective buyers. While gas and diesel prices escalate, this may further weigh on “consumer” sentiment taking into account increased monthly gas expenses for commute vs any savings from buy downs (and from higher rates than Q4 25/Q1 26) or incentives.
Fig. 32
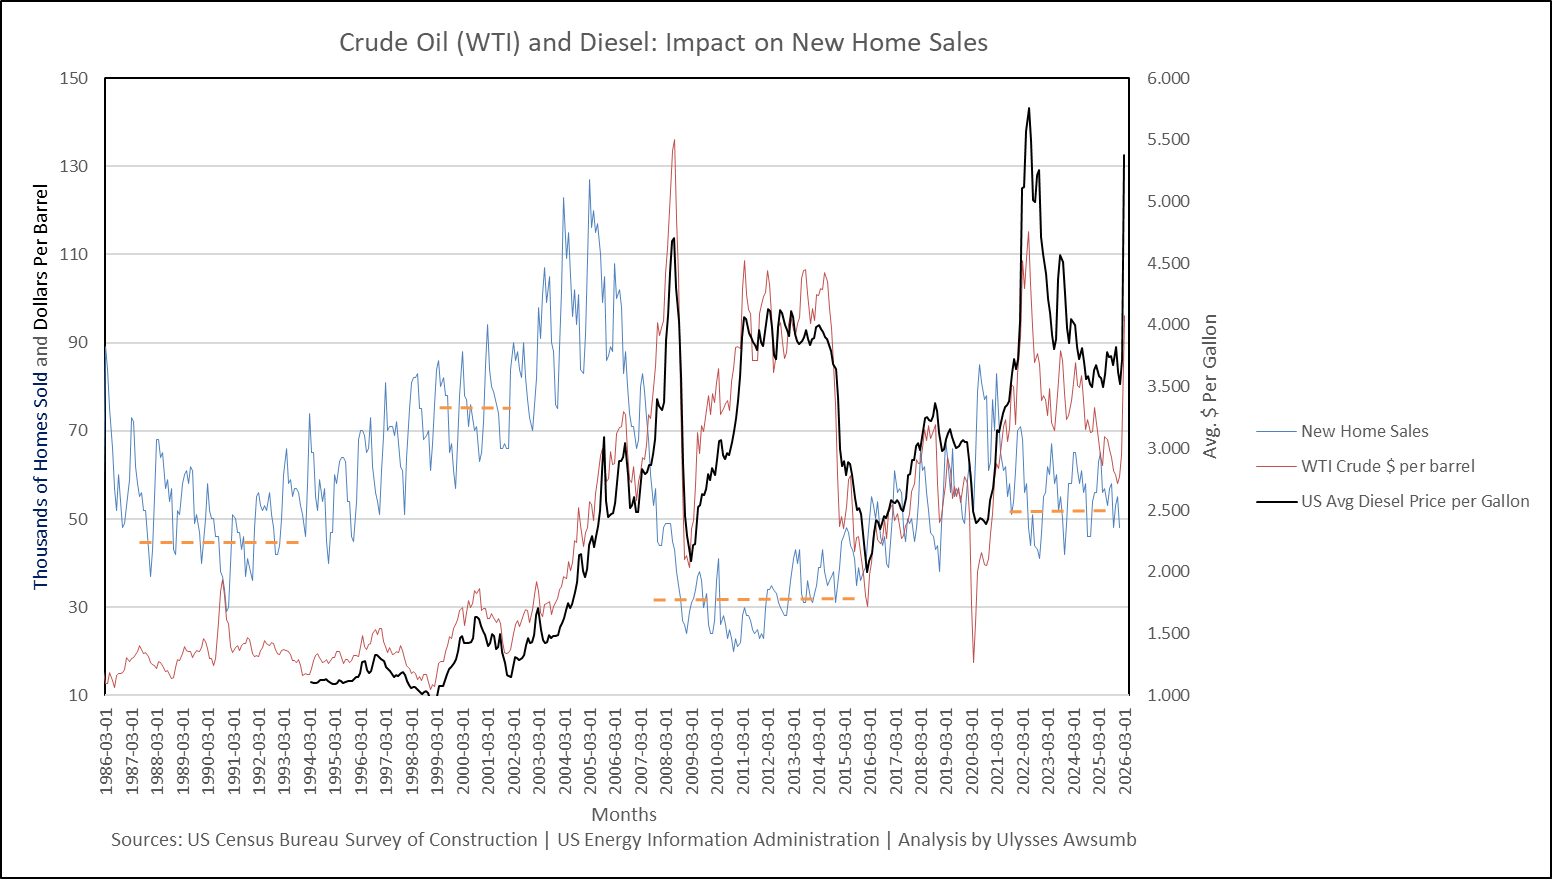
Fig. 33
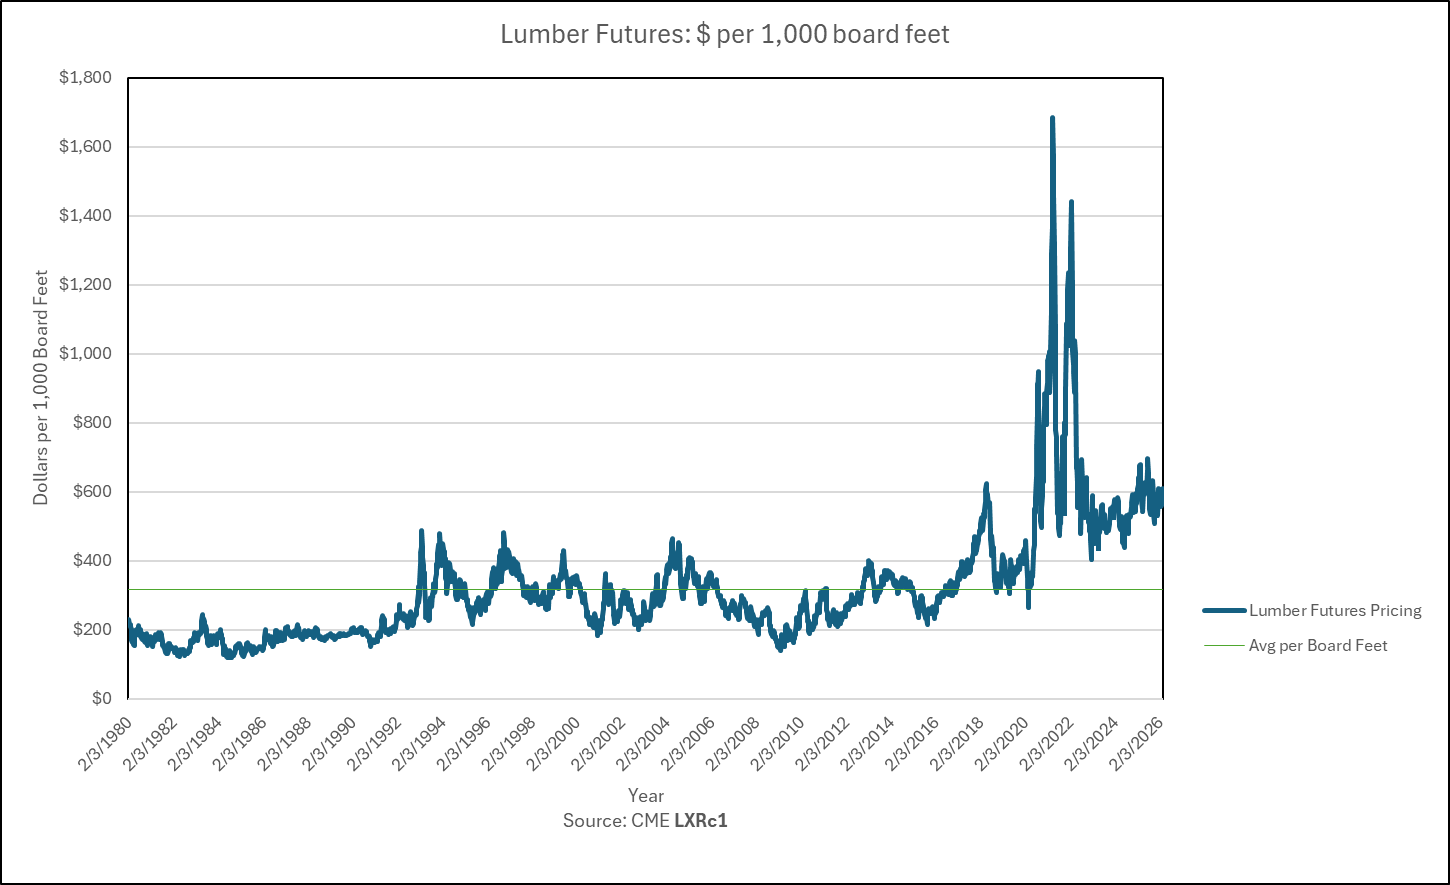
While diesel is creating a headwind for builder’s spring season, lumber prices are still 88% higher than their 46 year average price of $316 per 1,000 board ft. vs last Thursday’s closing price of $596 per 1,000 board ft.
Softer spring demand may help lower lumber costs for the remainder of the year beyond Q2.
Fig. 34
Options for industry participants
Builders can and will be looking to change up product selections and supplier bases for savings in build costs wherever possible. Less upgrades and more closing cost/price reductions may be more attractive to spring buyers.
Trade Partner Contractors can evaluate necessary overhead, supply chains, and operational efficiencies to reduce costs while maintaining margins. For those in the right positions, turn key solutions can present new revenue and better overall margins. For others still, shifting from turn key to labor on;y can also present potentially preferable returns.
Suppliers can continue to look for volume pricing discounts where possible, alternate materials, and altered payment terms.
Brokers can look for increased commission splits from new build communities if the home fits their client’s needs. Many builders are currently offering broker luncheons, community tours and larger commission splits as a means to gain new buyers. They can also potentially help their client’s navigate negotiable pricing in the right new build communities as well as closing cost assistance.
US Property Services is a contracting and consulting firm, specializing in construction management, cost estimating, construction risk mitigation and research. For information on this publication, specialized research or a consultation, you can contact us at:
info@uspropertyservices.com
The method and research for the index can be found here.
The next Situation Index will be published in May 2026 after the US Census Bureau Survey of Construction is released. Until then: