

Friday EFFing Memo
Keep Calm and Chive On

The Digital Report
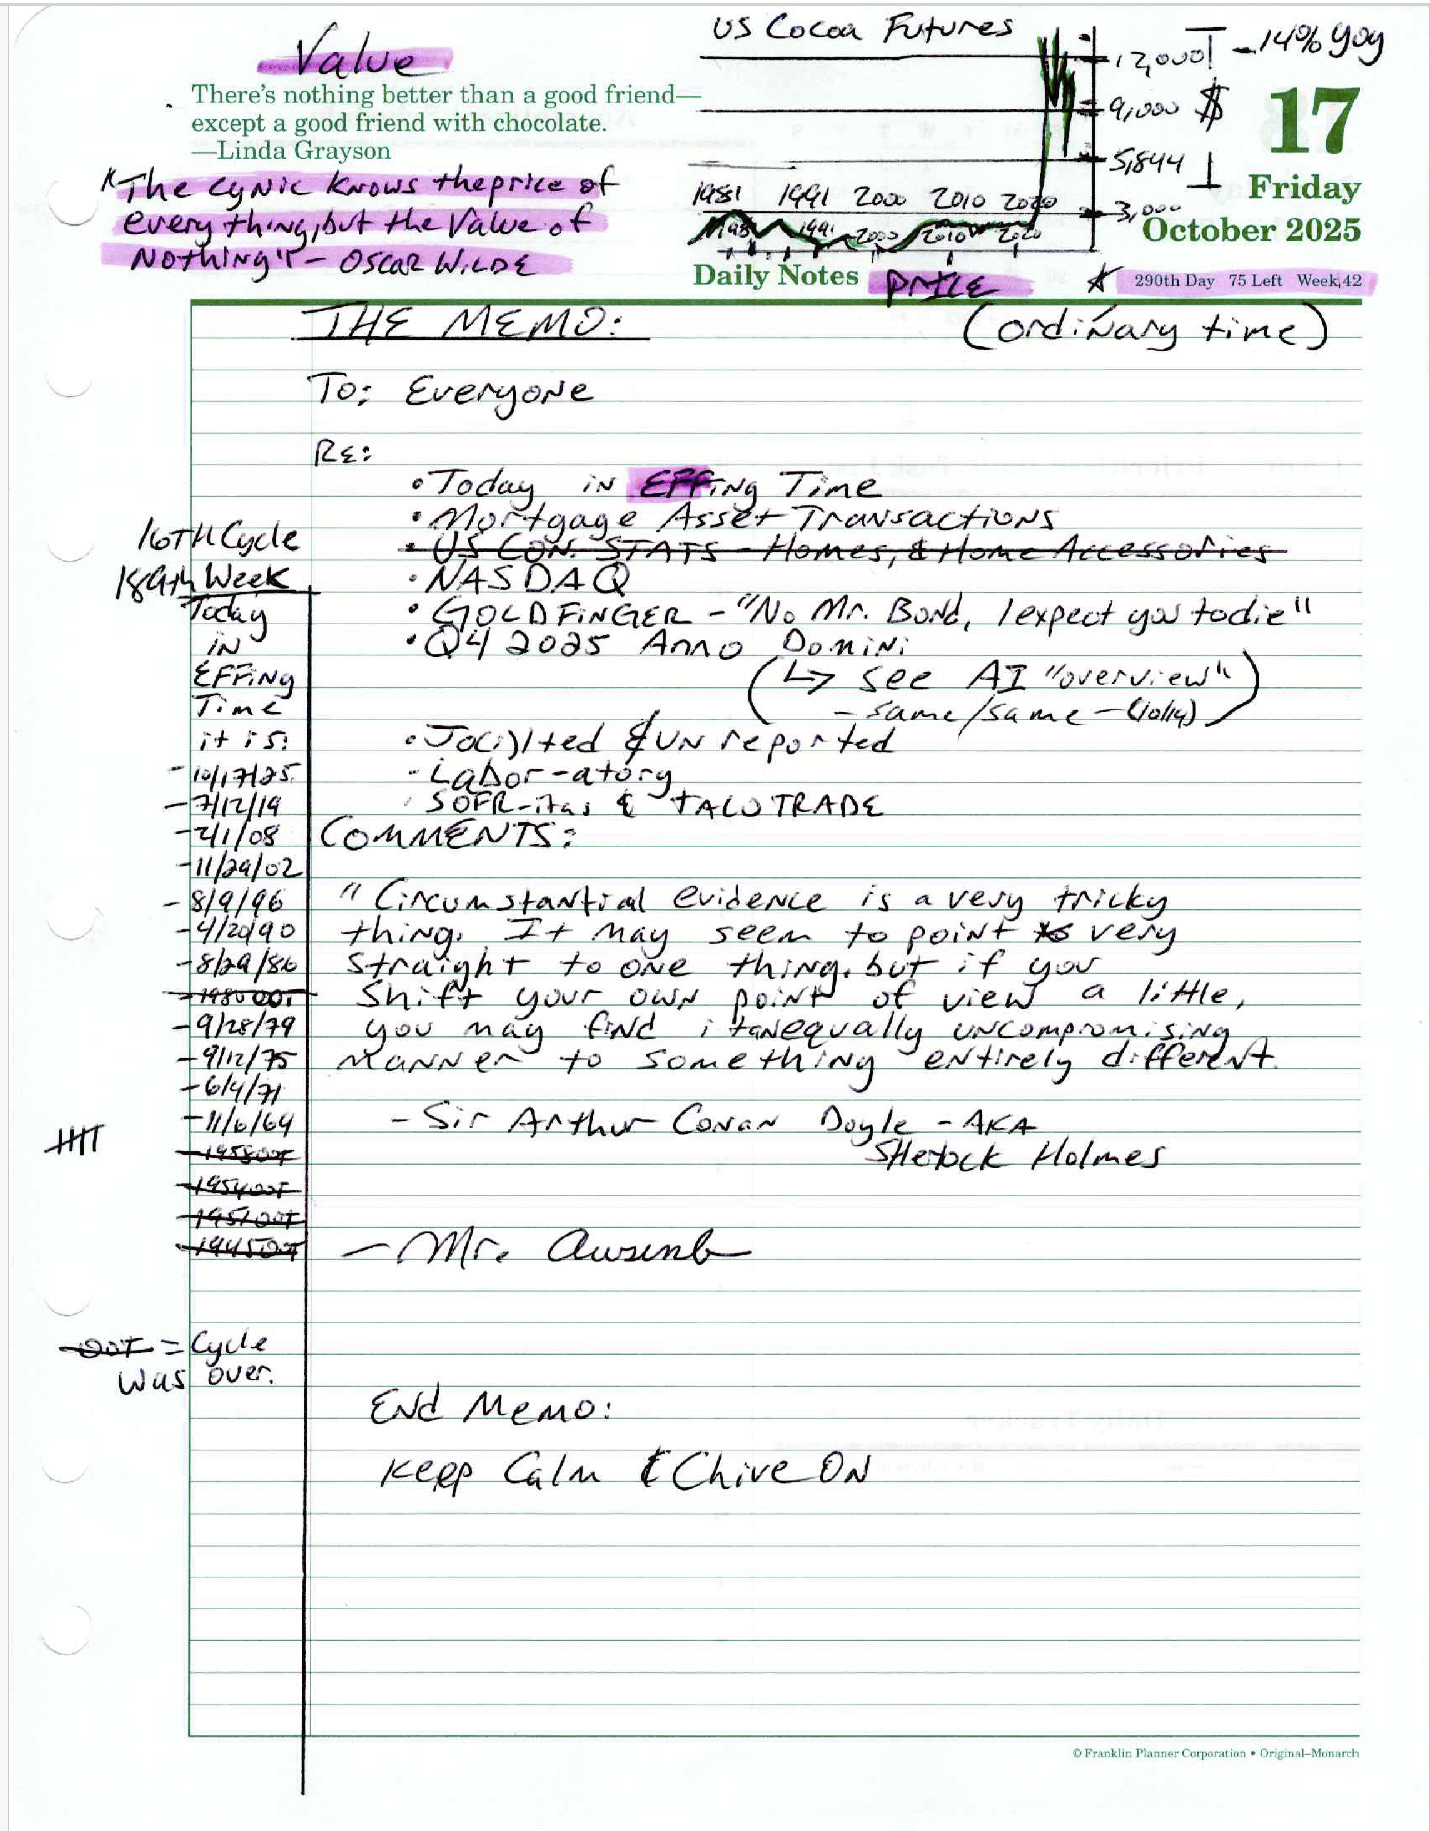
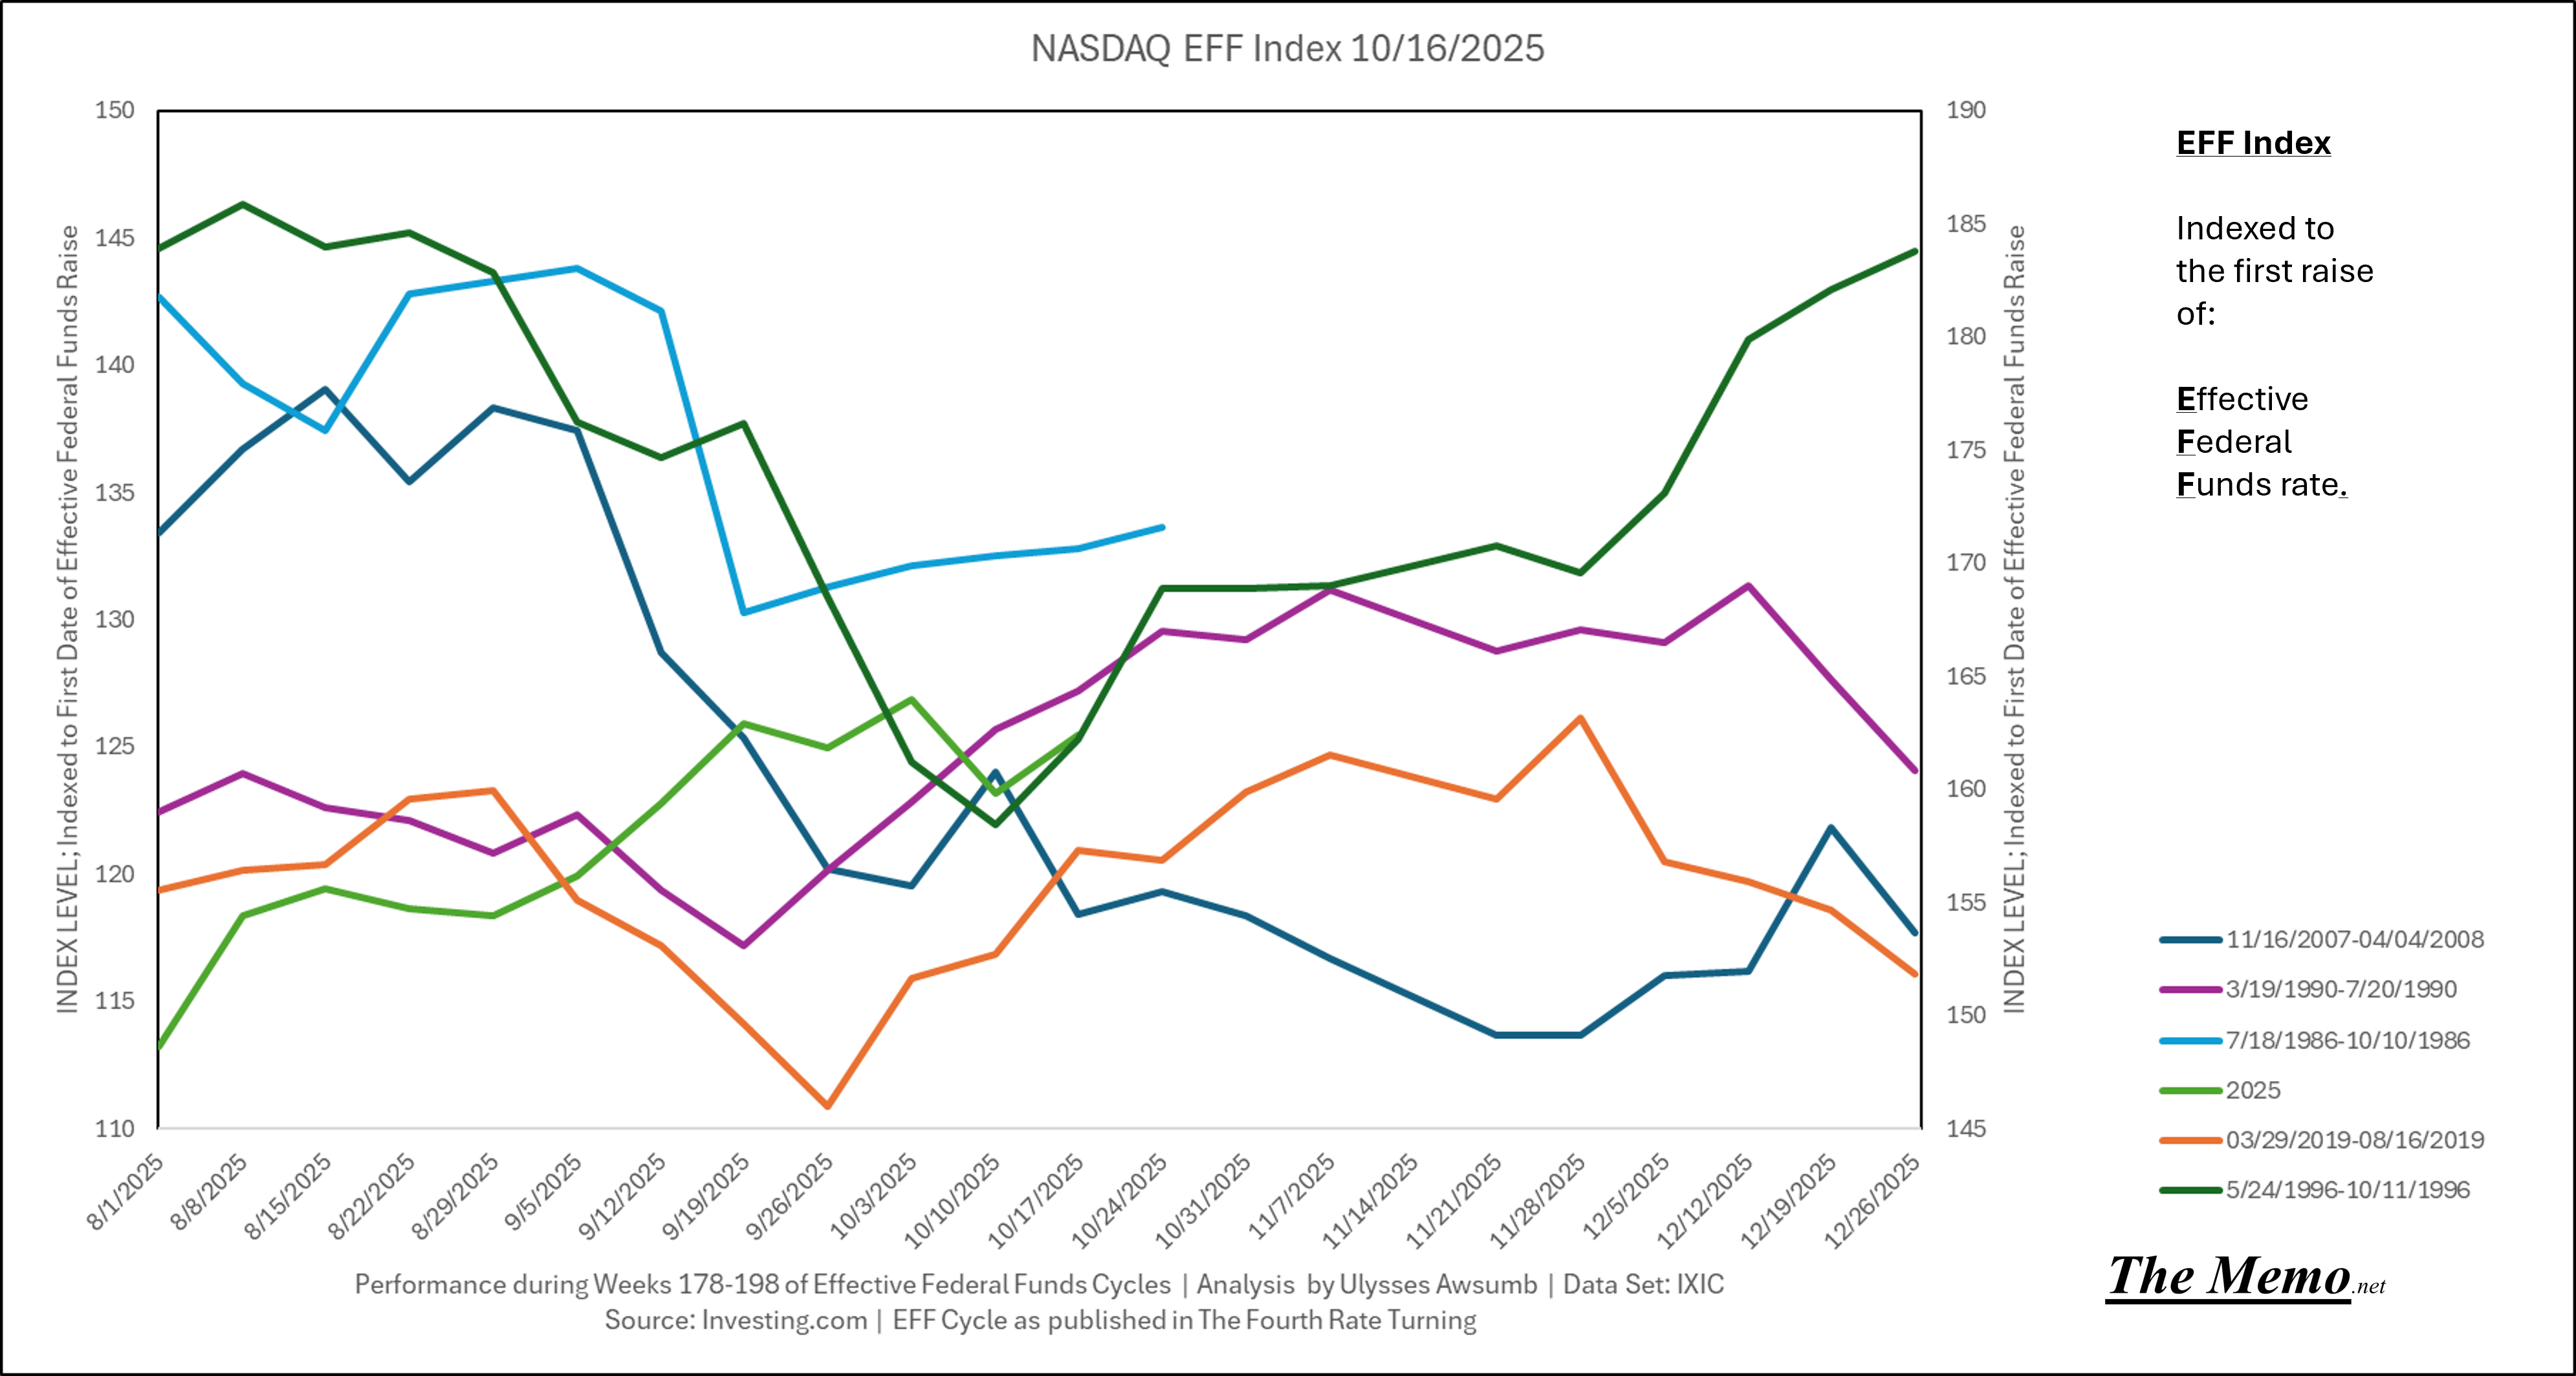
NASDAQ
It’s been 4 weeks of up down up down, all within a few percentage points of ATH, despite ending last Friday down 3.5%”.
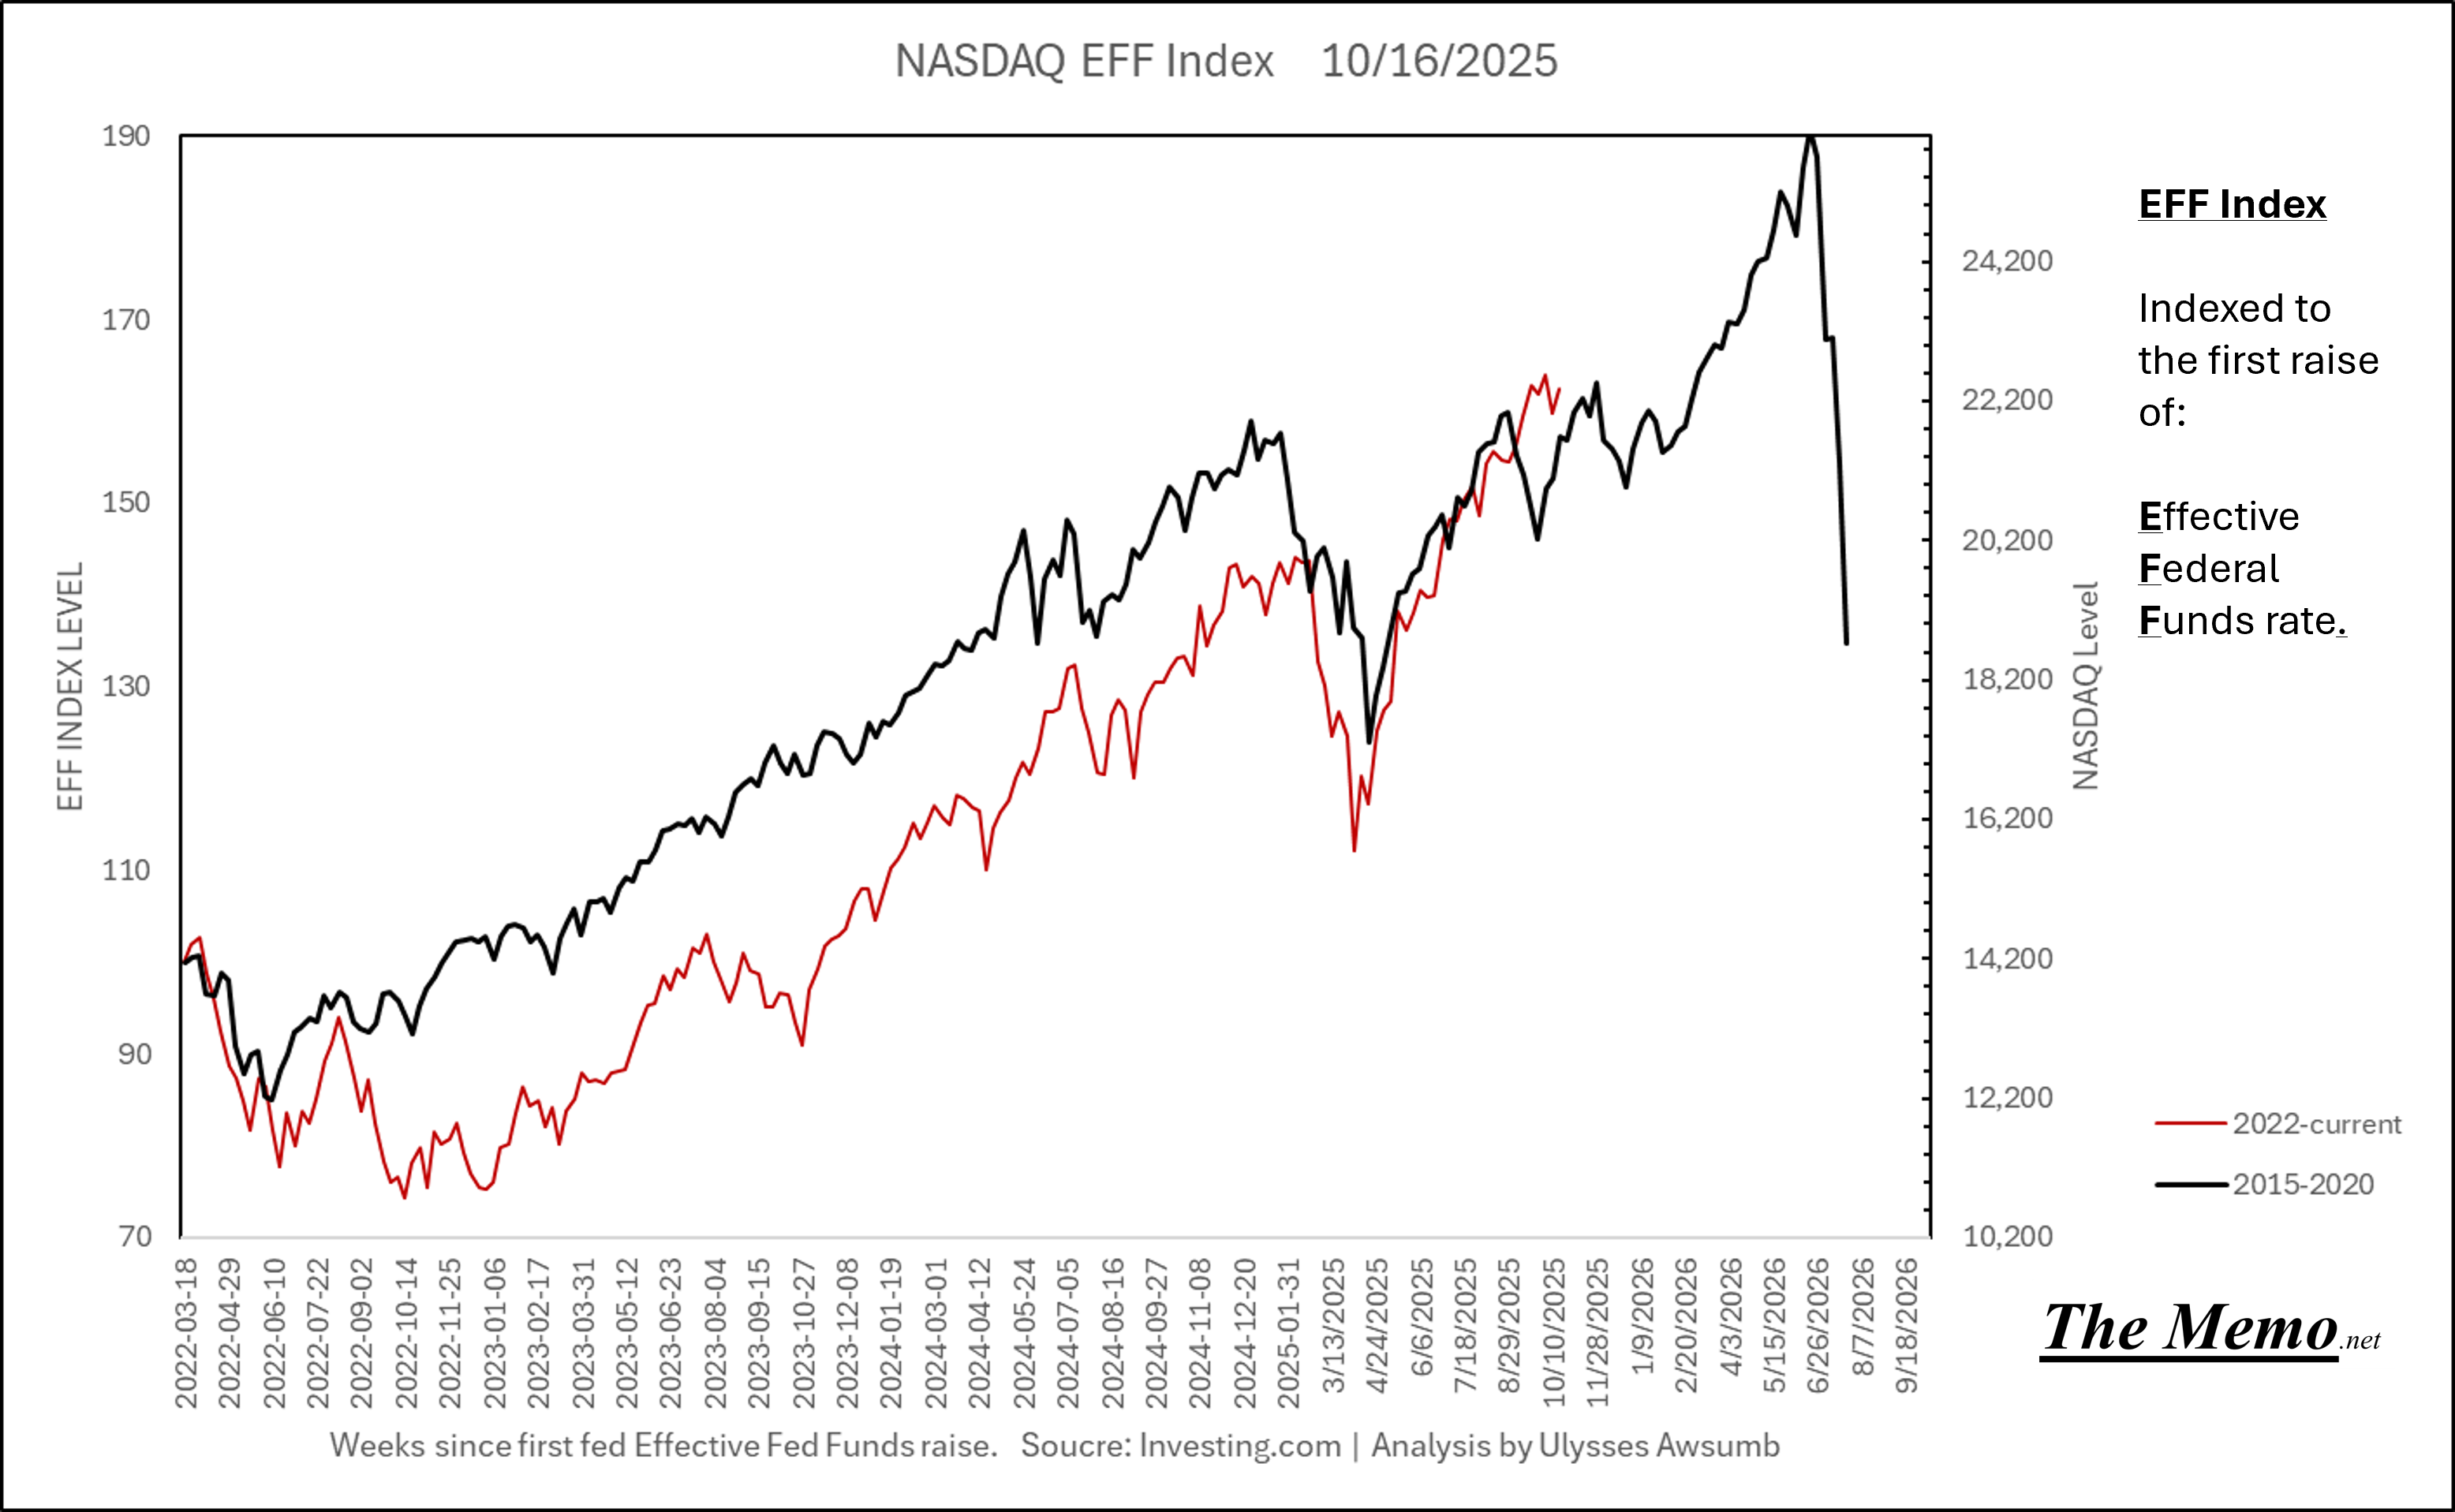
I haven’t ruled this out entirely.
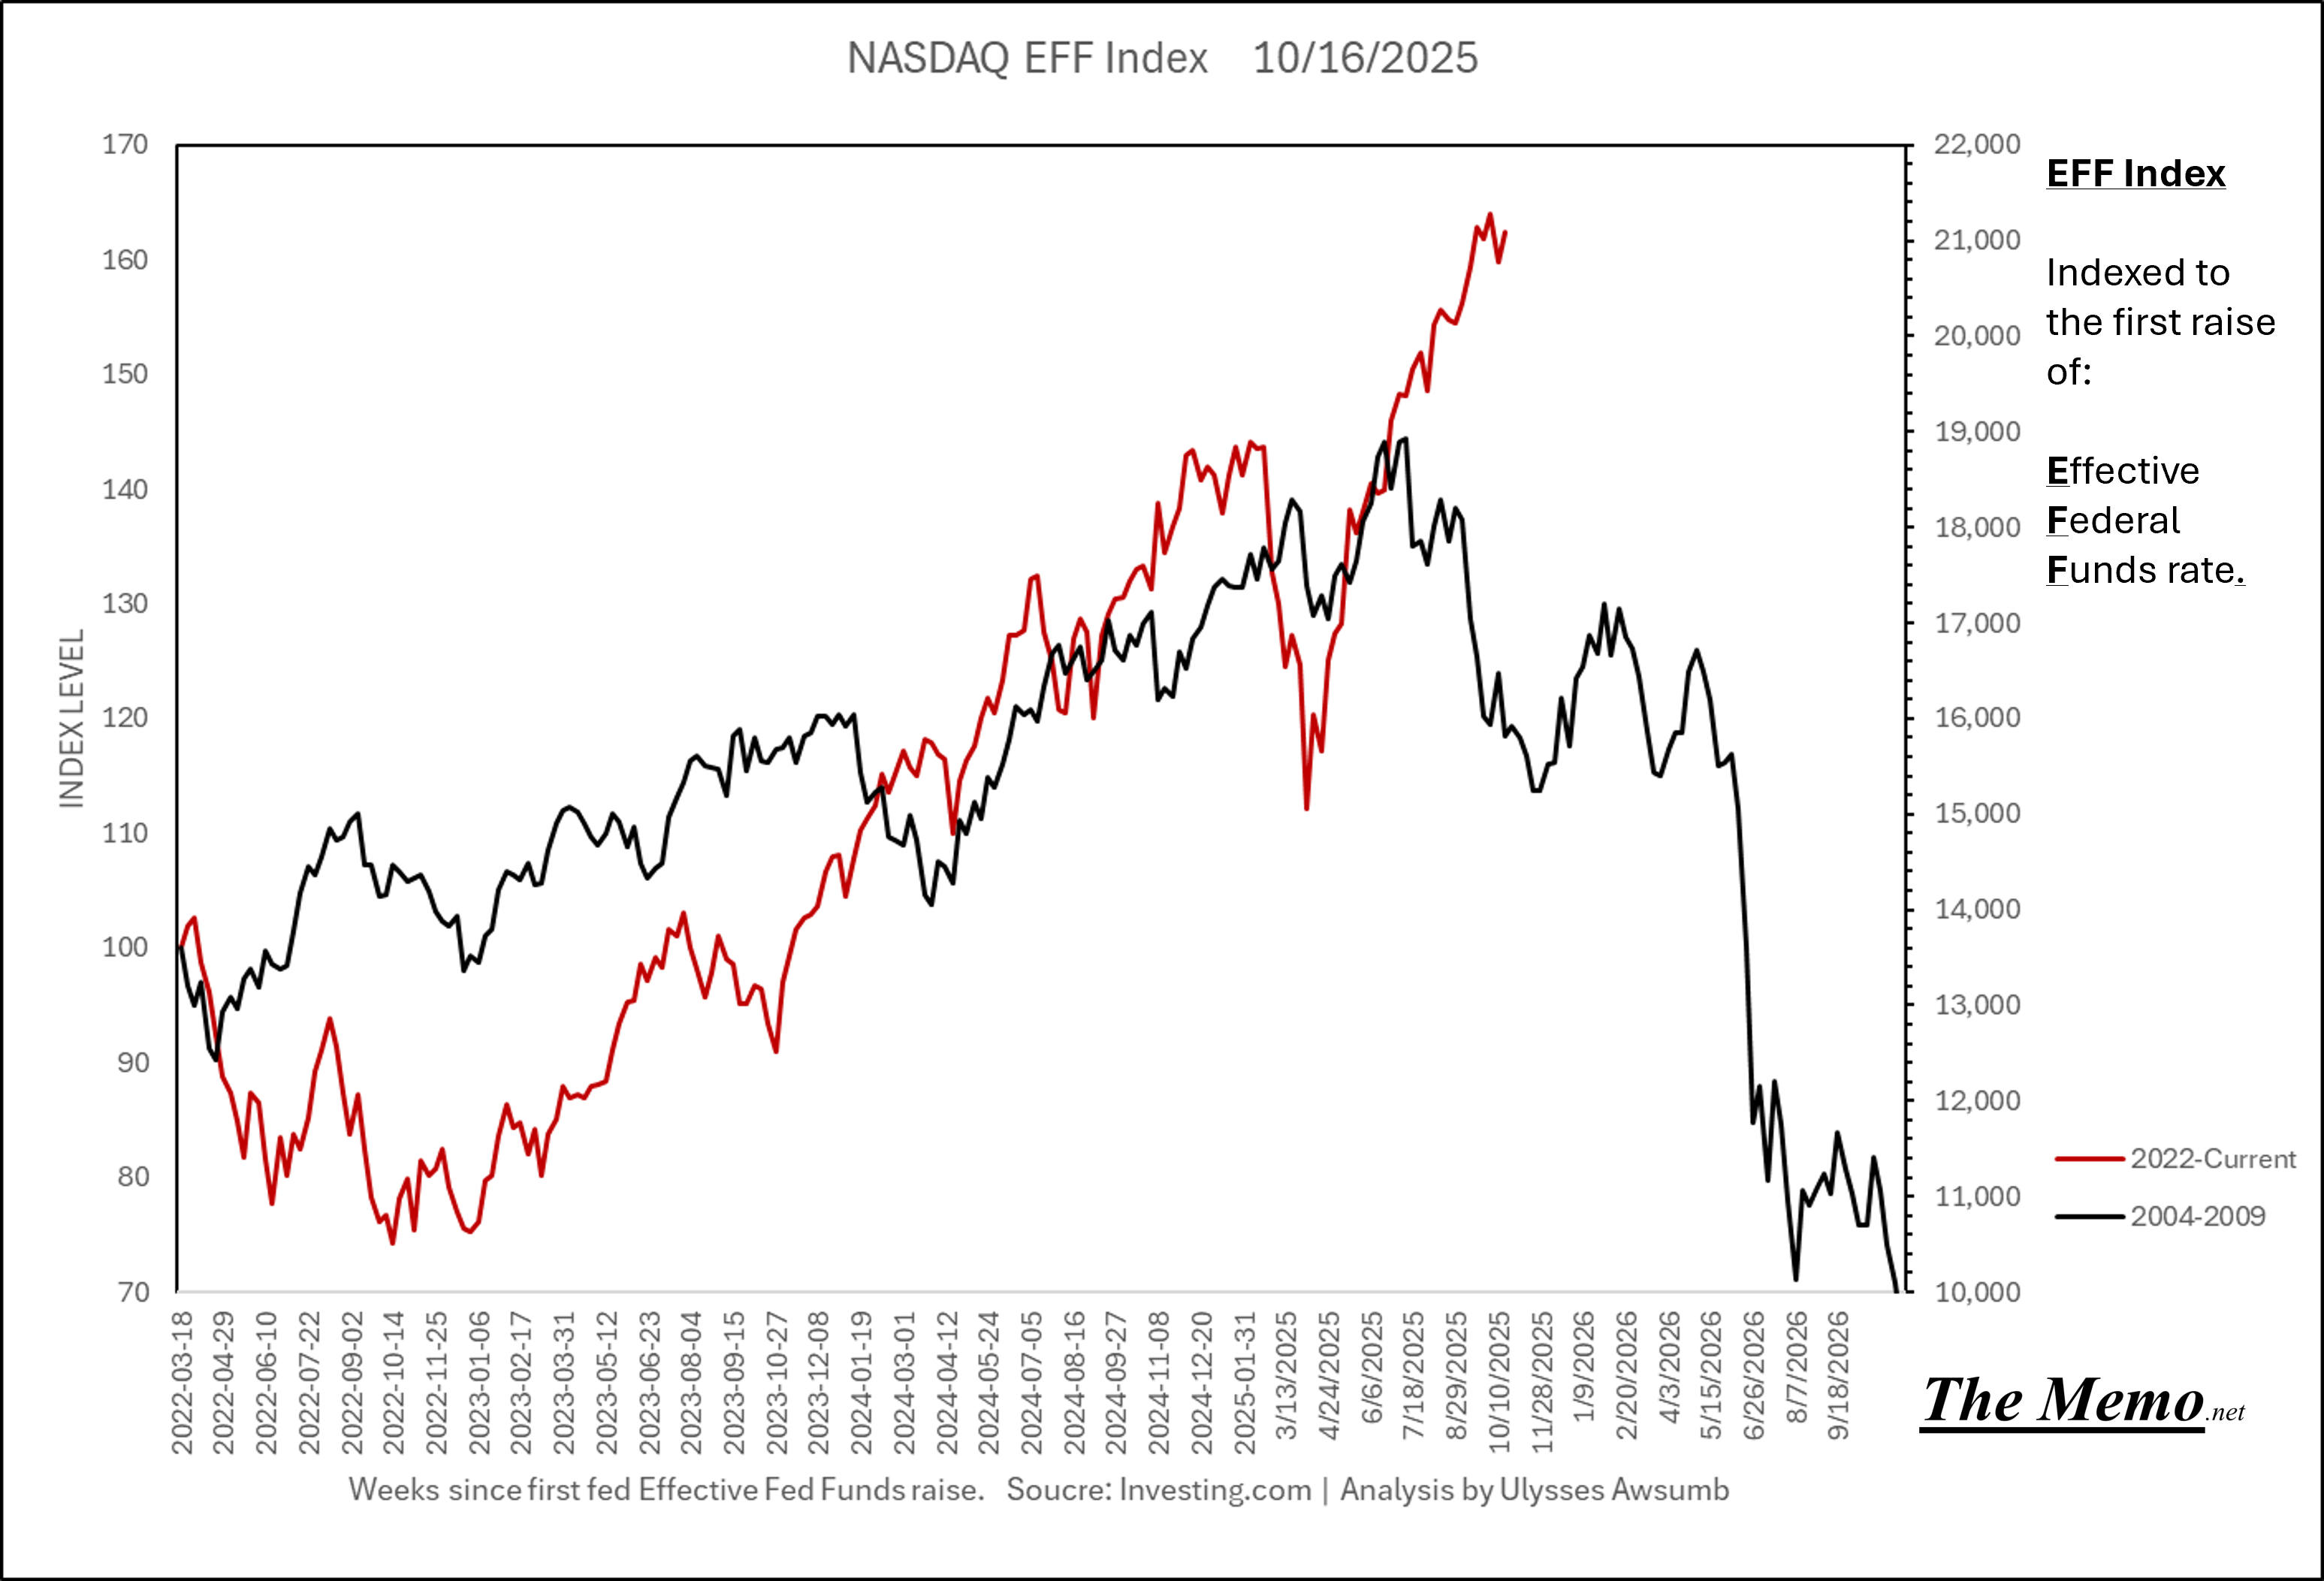
Pattern behavior matching both cycles, albeit at slightly early and late on the timeline.
With 5 cycles having ended, the comparisons can be whittled down to the previous 10 remaining timeline behaviors.
Which brings me to recent discussions of “SOFR spiking” amongst analyst and televisioneers.
SOFR-itas
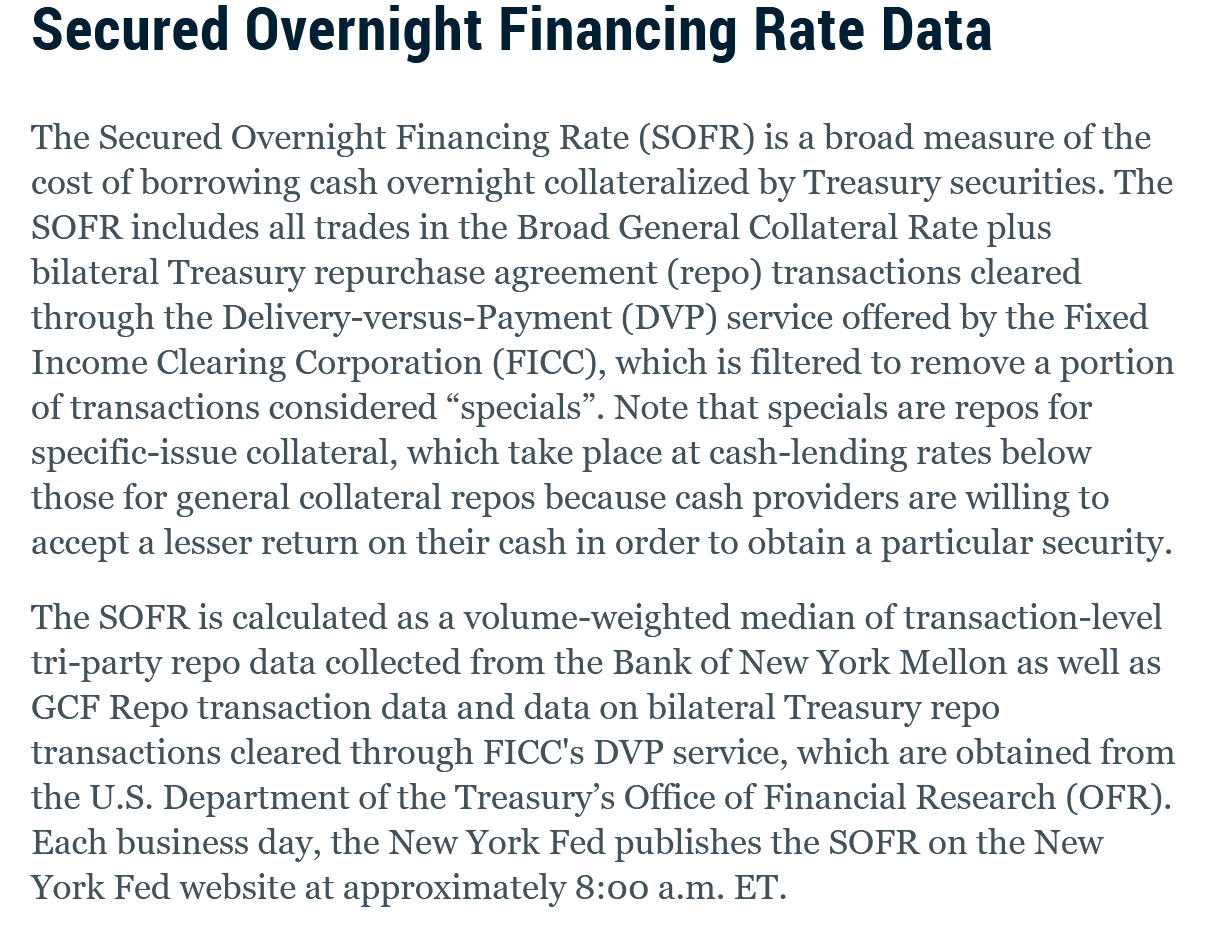
When viewed on it’s Index level, SOFR “backstops” the rise in “excess” funds being used in overnight reverse repurchase agreements. Or: banks and cash holders “lending” cash overnight to the Federal Reserve.
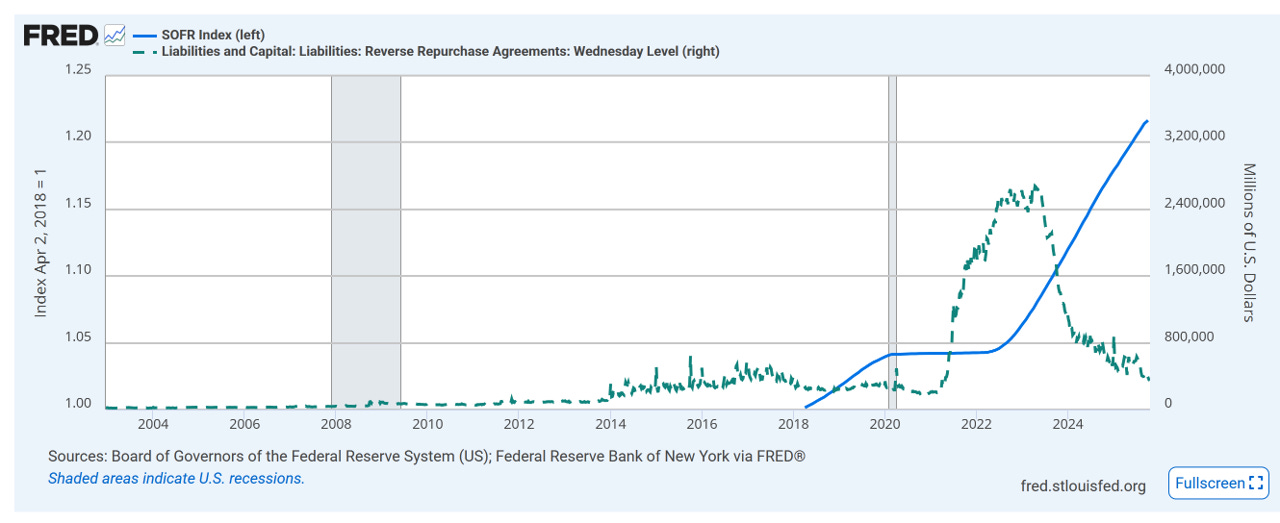
But when you index both to the start of the 2020 Recession, you get the next chart, which is the same data, clearly showing SOFR as the level of desired level of cash, or target, of excess cash/liquidity.
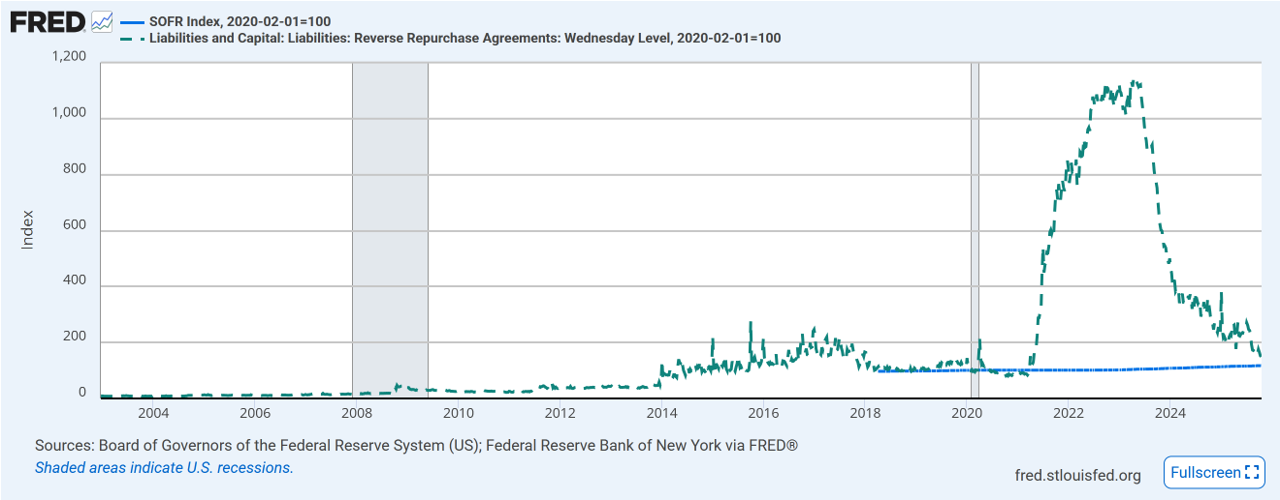
And reverse repo value is approaching the SOFR indexed level of the start of the 2020 recession, when indexed to the same. Now SOFR is based on the value of the “collateral” pledged, namely US treasuries. So the higher the treasury rate, the higher SOFR.
This is important, because SOFR replaced the London Interbank Offered Rate or LIBOR, for two reasons:
There was ample shenanigans (alleged fraud and misuse of funds) using LIBOR and:
As a way to force large banks, dealers and parties that partake in such transactions, to pay evermore interest for needing short term/overnight transactions as such, and would require evermore “collateral”.
Which is a long way of saying what can be simply explained as:
“Want more collateral? Buy more Government Debt”.
The Federal Reserve will provide ample “liquidity” for those with the collateral it desires for trade.
And here we are, watching yields on said debt get bid, not precisely by my initial forecast, but accurate by way of direction.
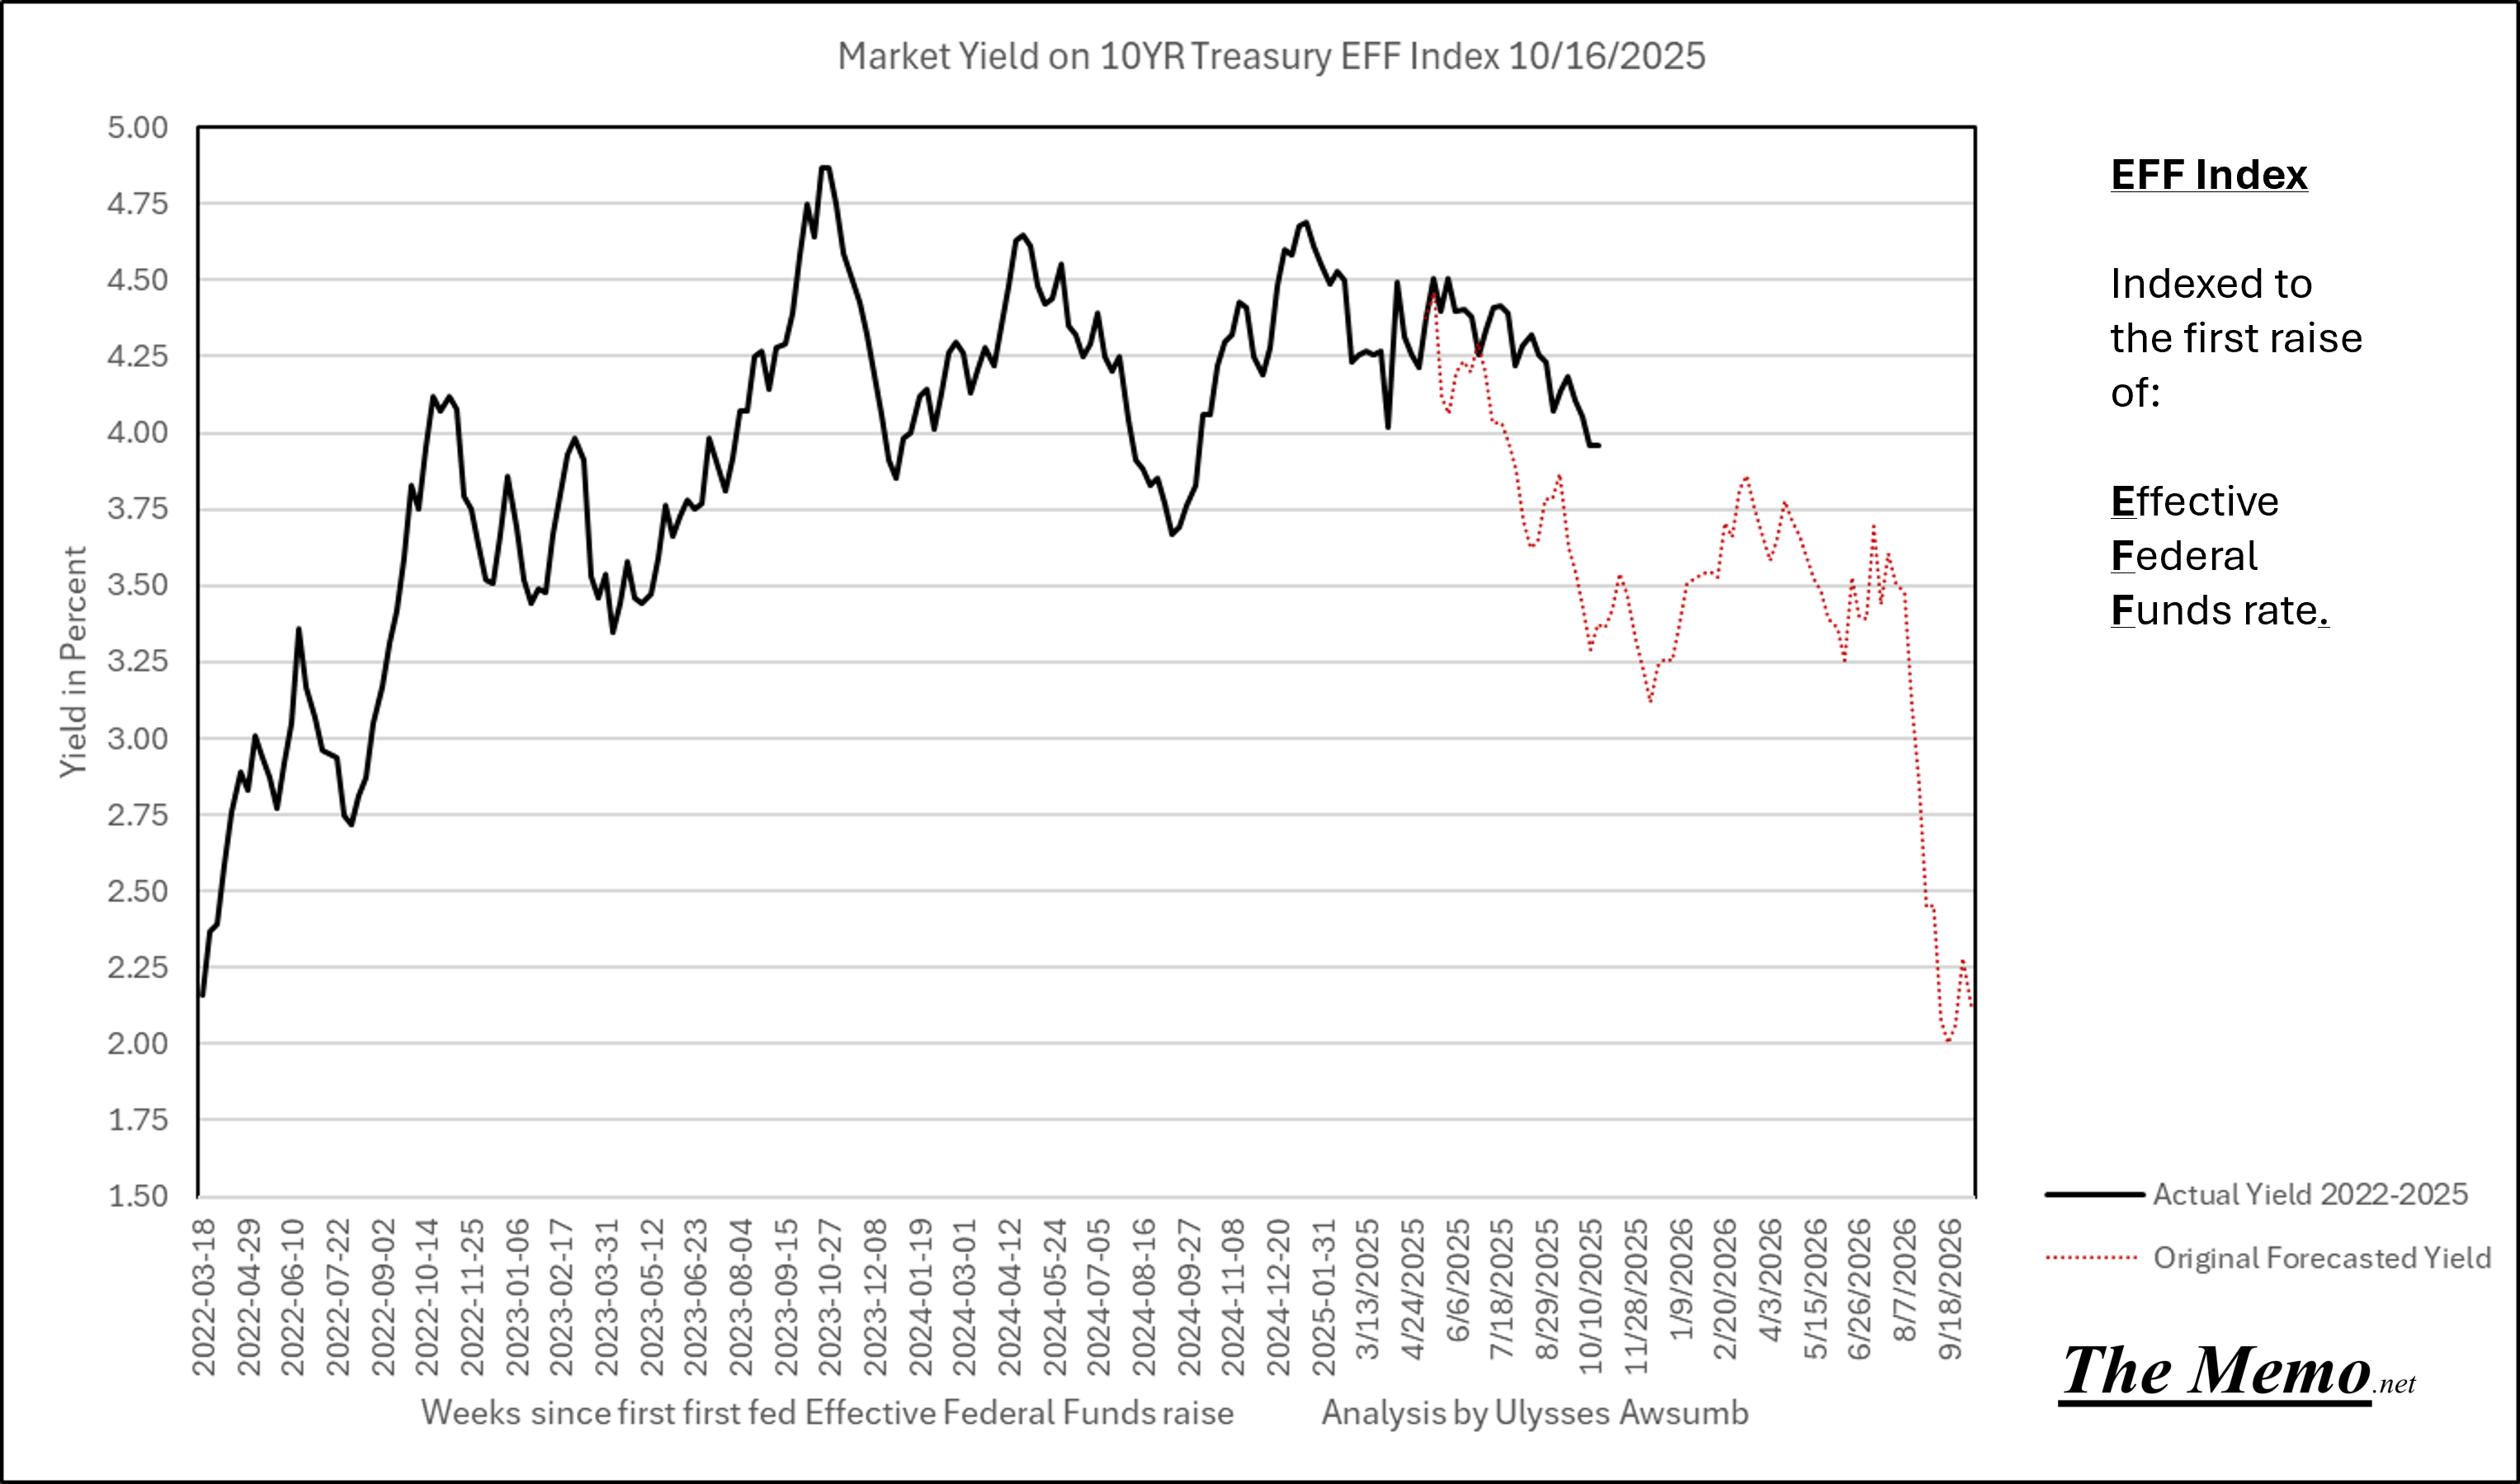
I’ve said here many times, the situation we all face is the cost of money, and while I’ve heard endless “the fed has lost control” commentary from people who genuinely do have more daily experience with said volume of bonds and swaps, remember, the entire purpose of the Federal Reserve is Monetary Policy.
And to that end, if we view the “target” as the levels of liquidity at the start of the 2020 recession, we can compare it to other data, affected by the cost of money.
In lieu of JOLTS (Job openings and Labor Turnover Survey) from the BLS, which is on hiatus from collecting and publishing data, let’s turn to the private sector.
Job postings on Indeed have gone back to levels last seen in February of 2021.
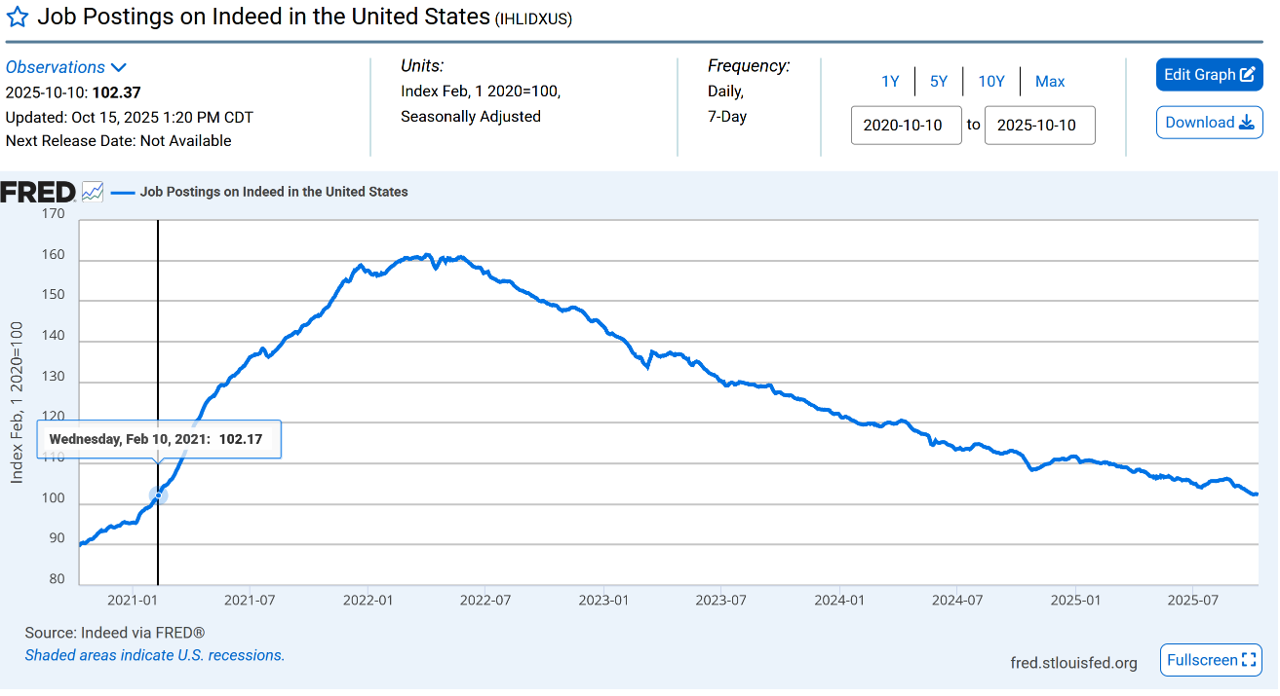
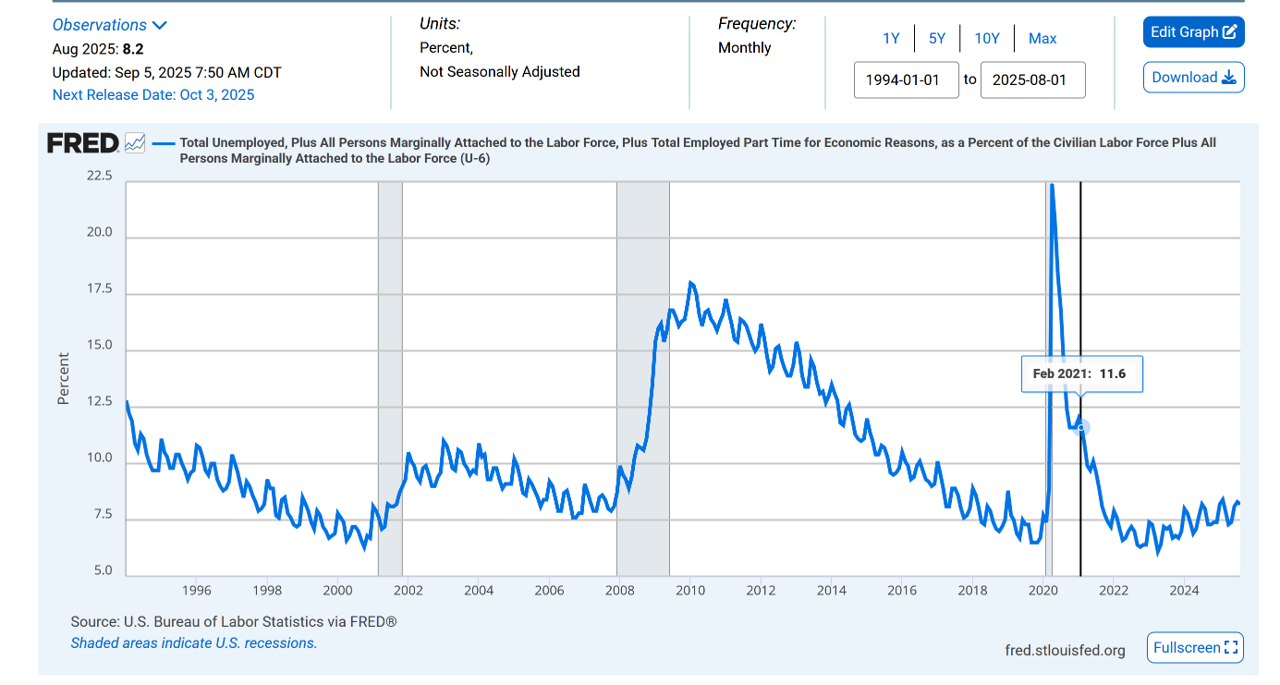
The same month the US had an unemployment rate of 11.6% non seasonally adjusted.
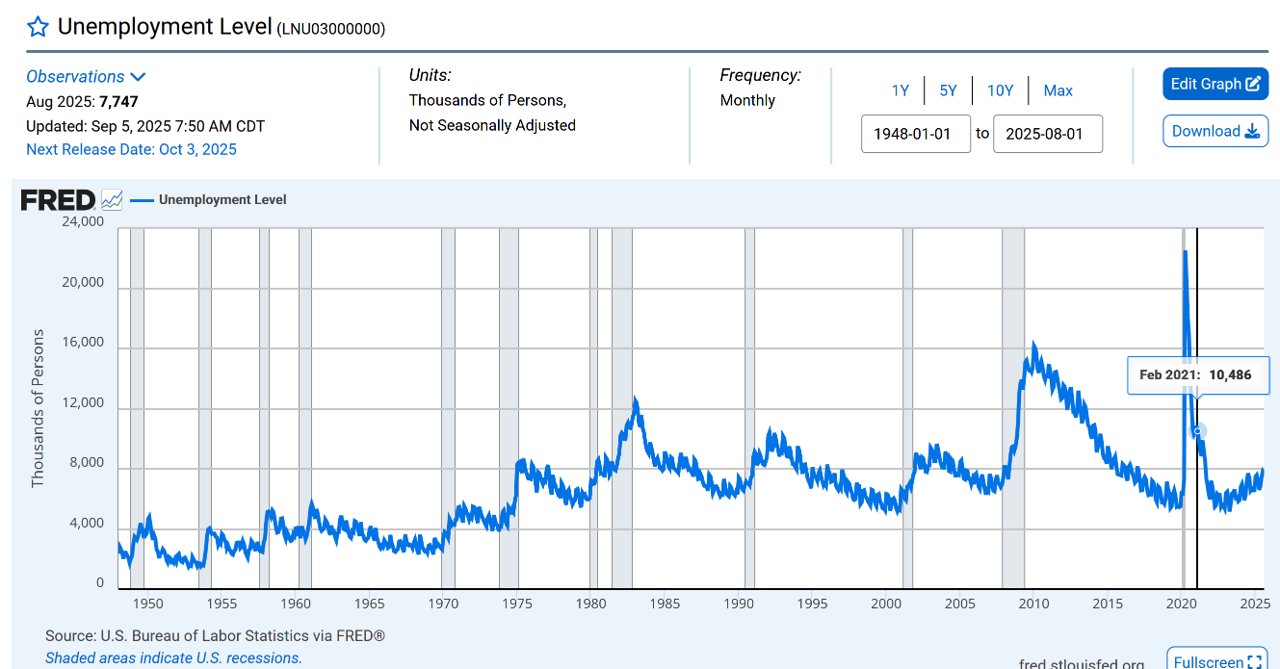
The same month we still had 10.8 Million Americans Unemployed, waiting in lines for food shelves.
Labor-atory
Since the BLS isn’t going to publish the federal data, I borrowed state level data and tallied the last two weeks of Initial Unemployment Claims. And we just bounced upwards again on a non seasonally adjusted basis.
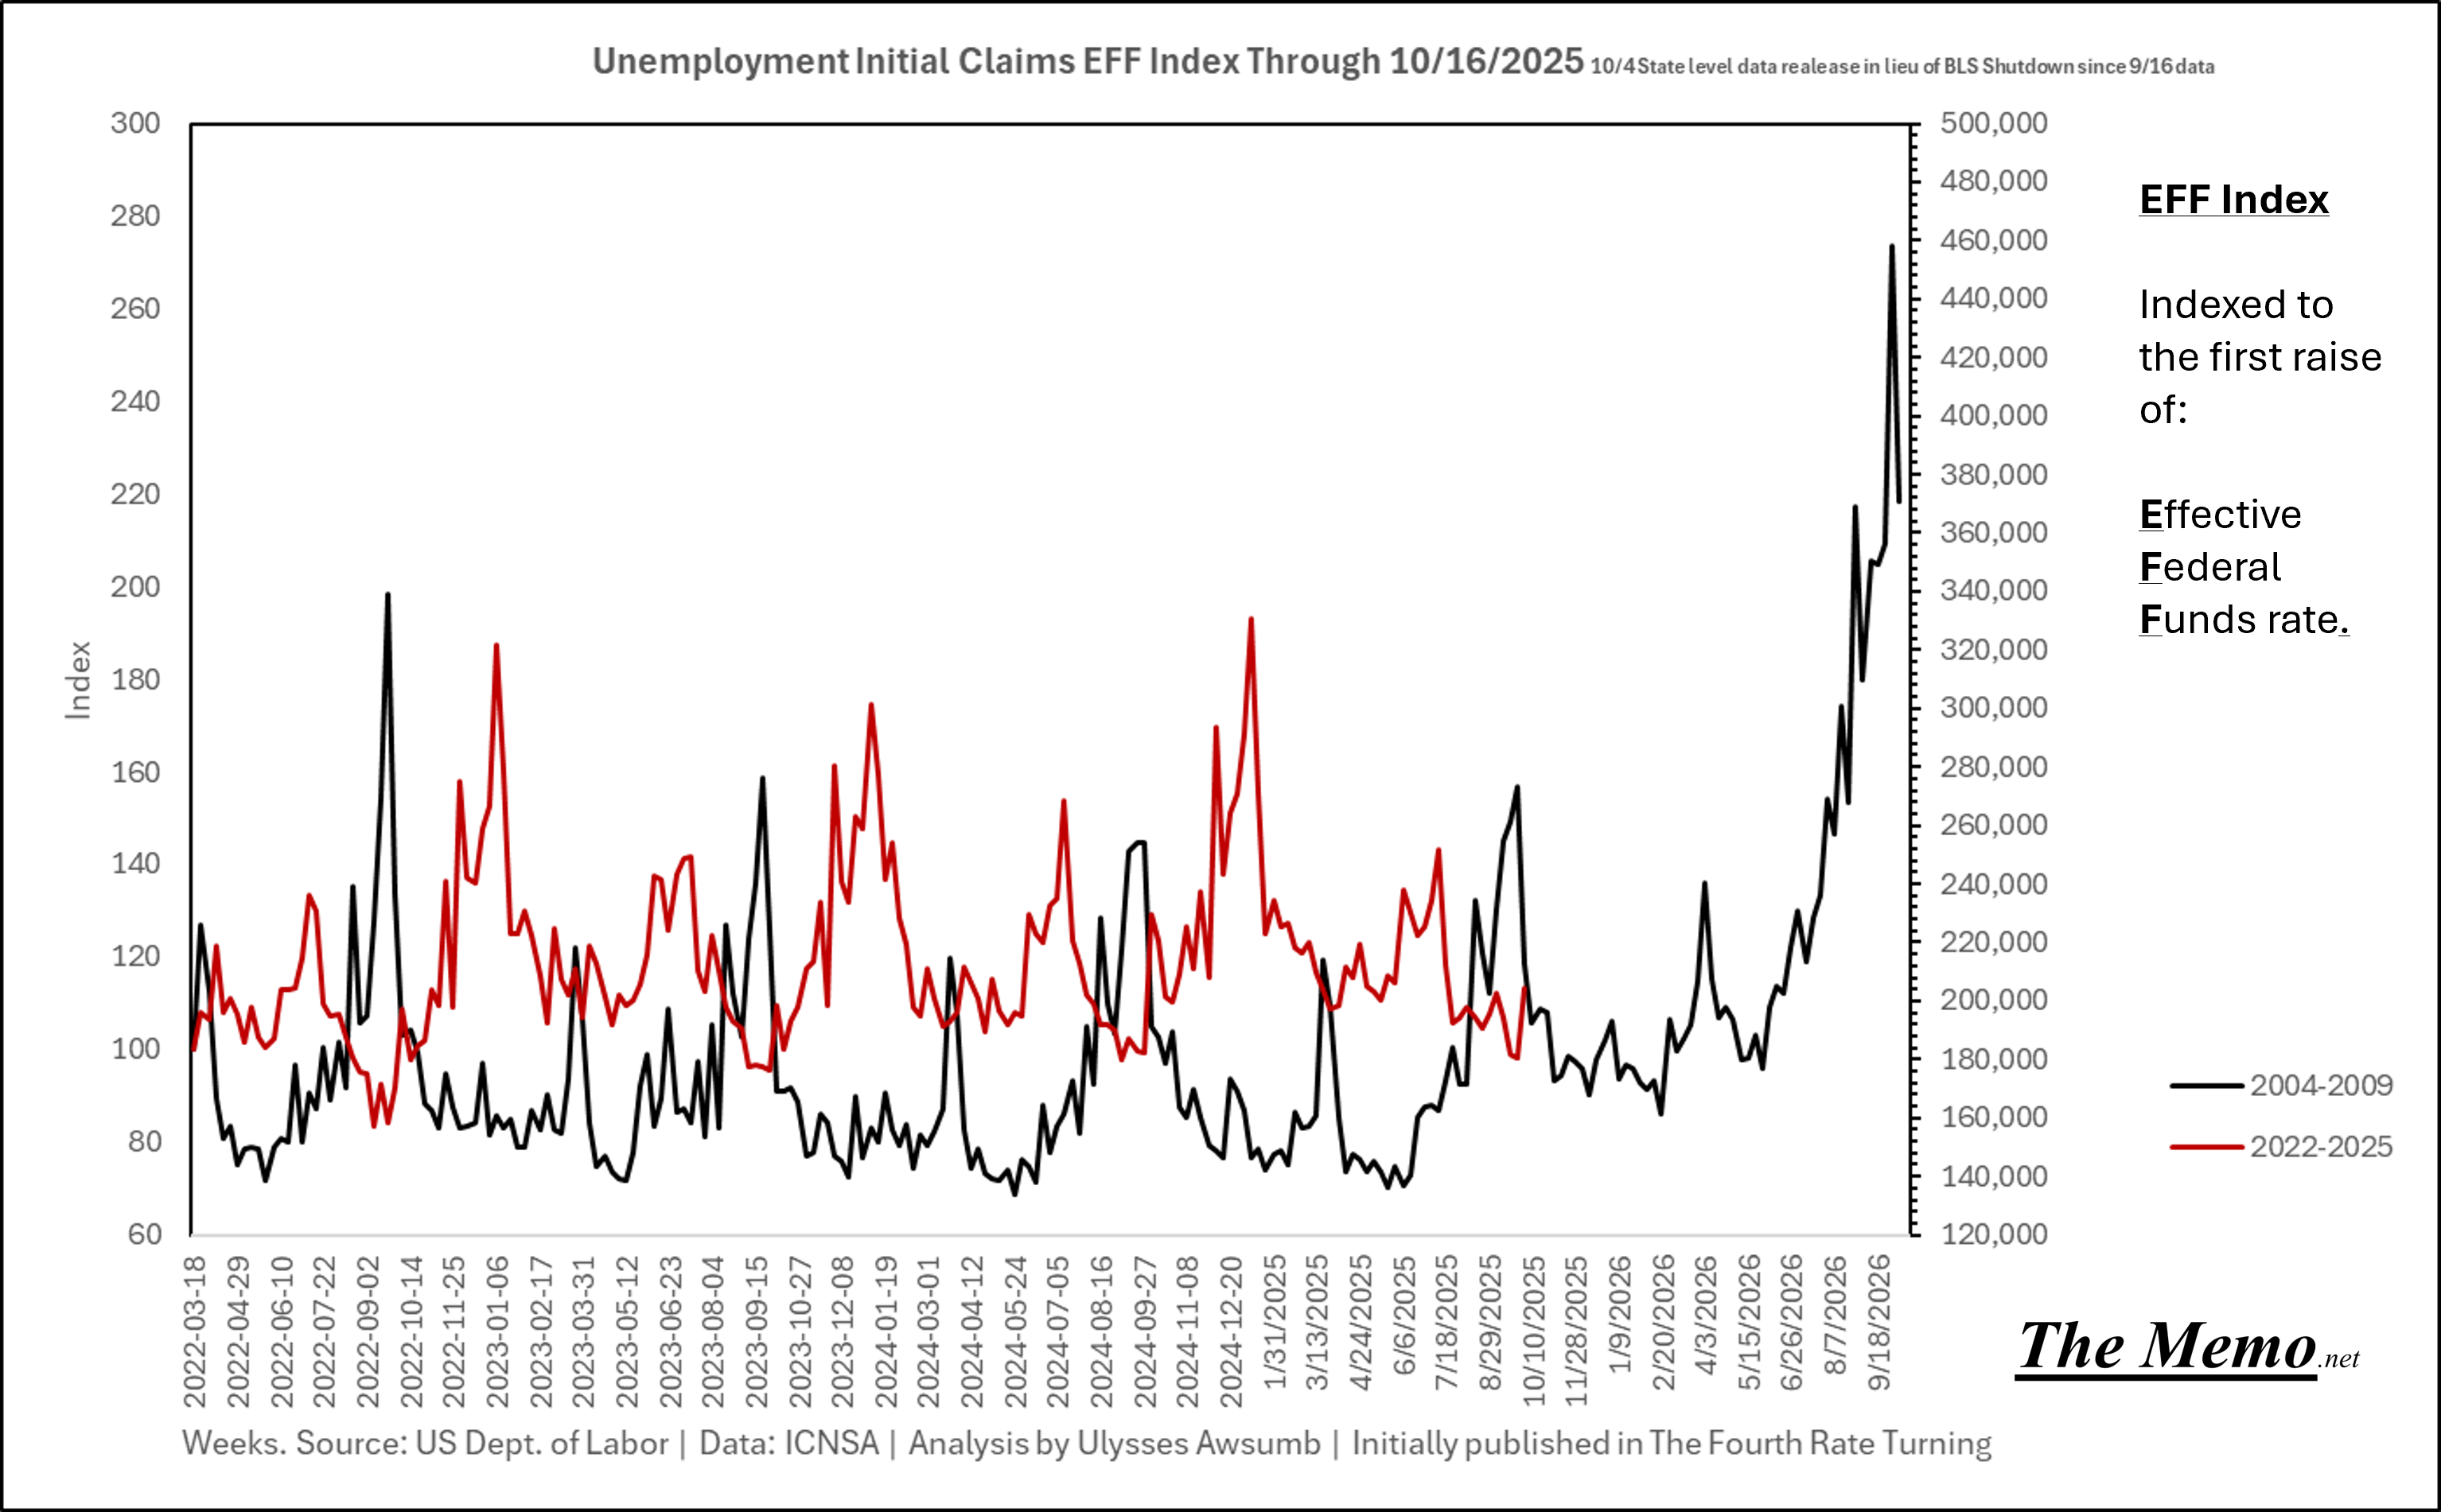
When you seasonally adjust it for smoothness, this is where we left off.
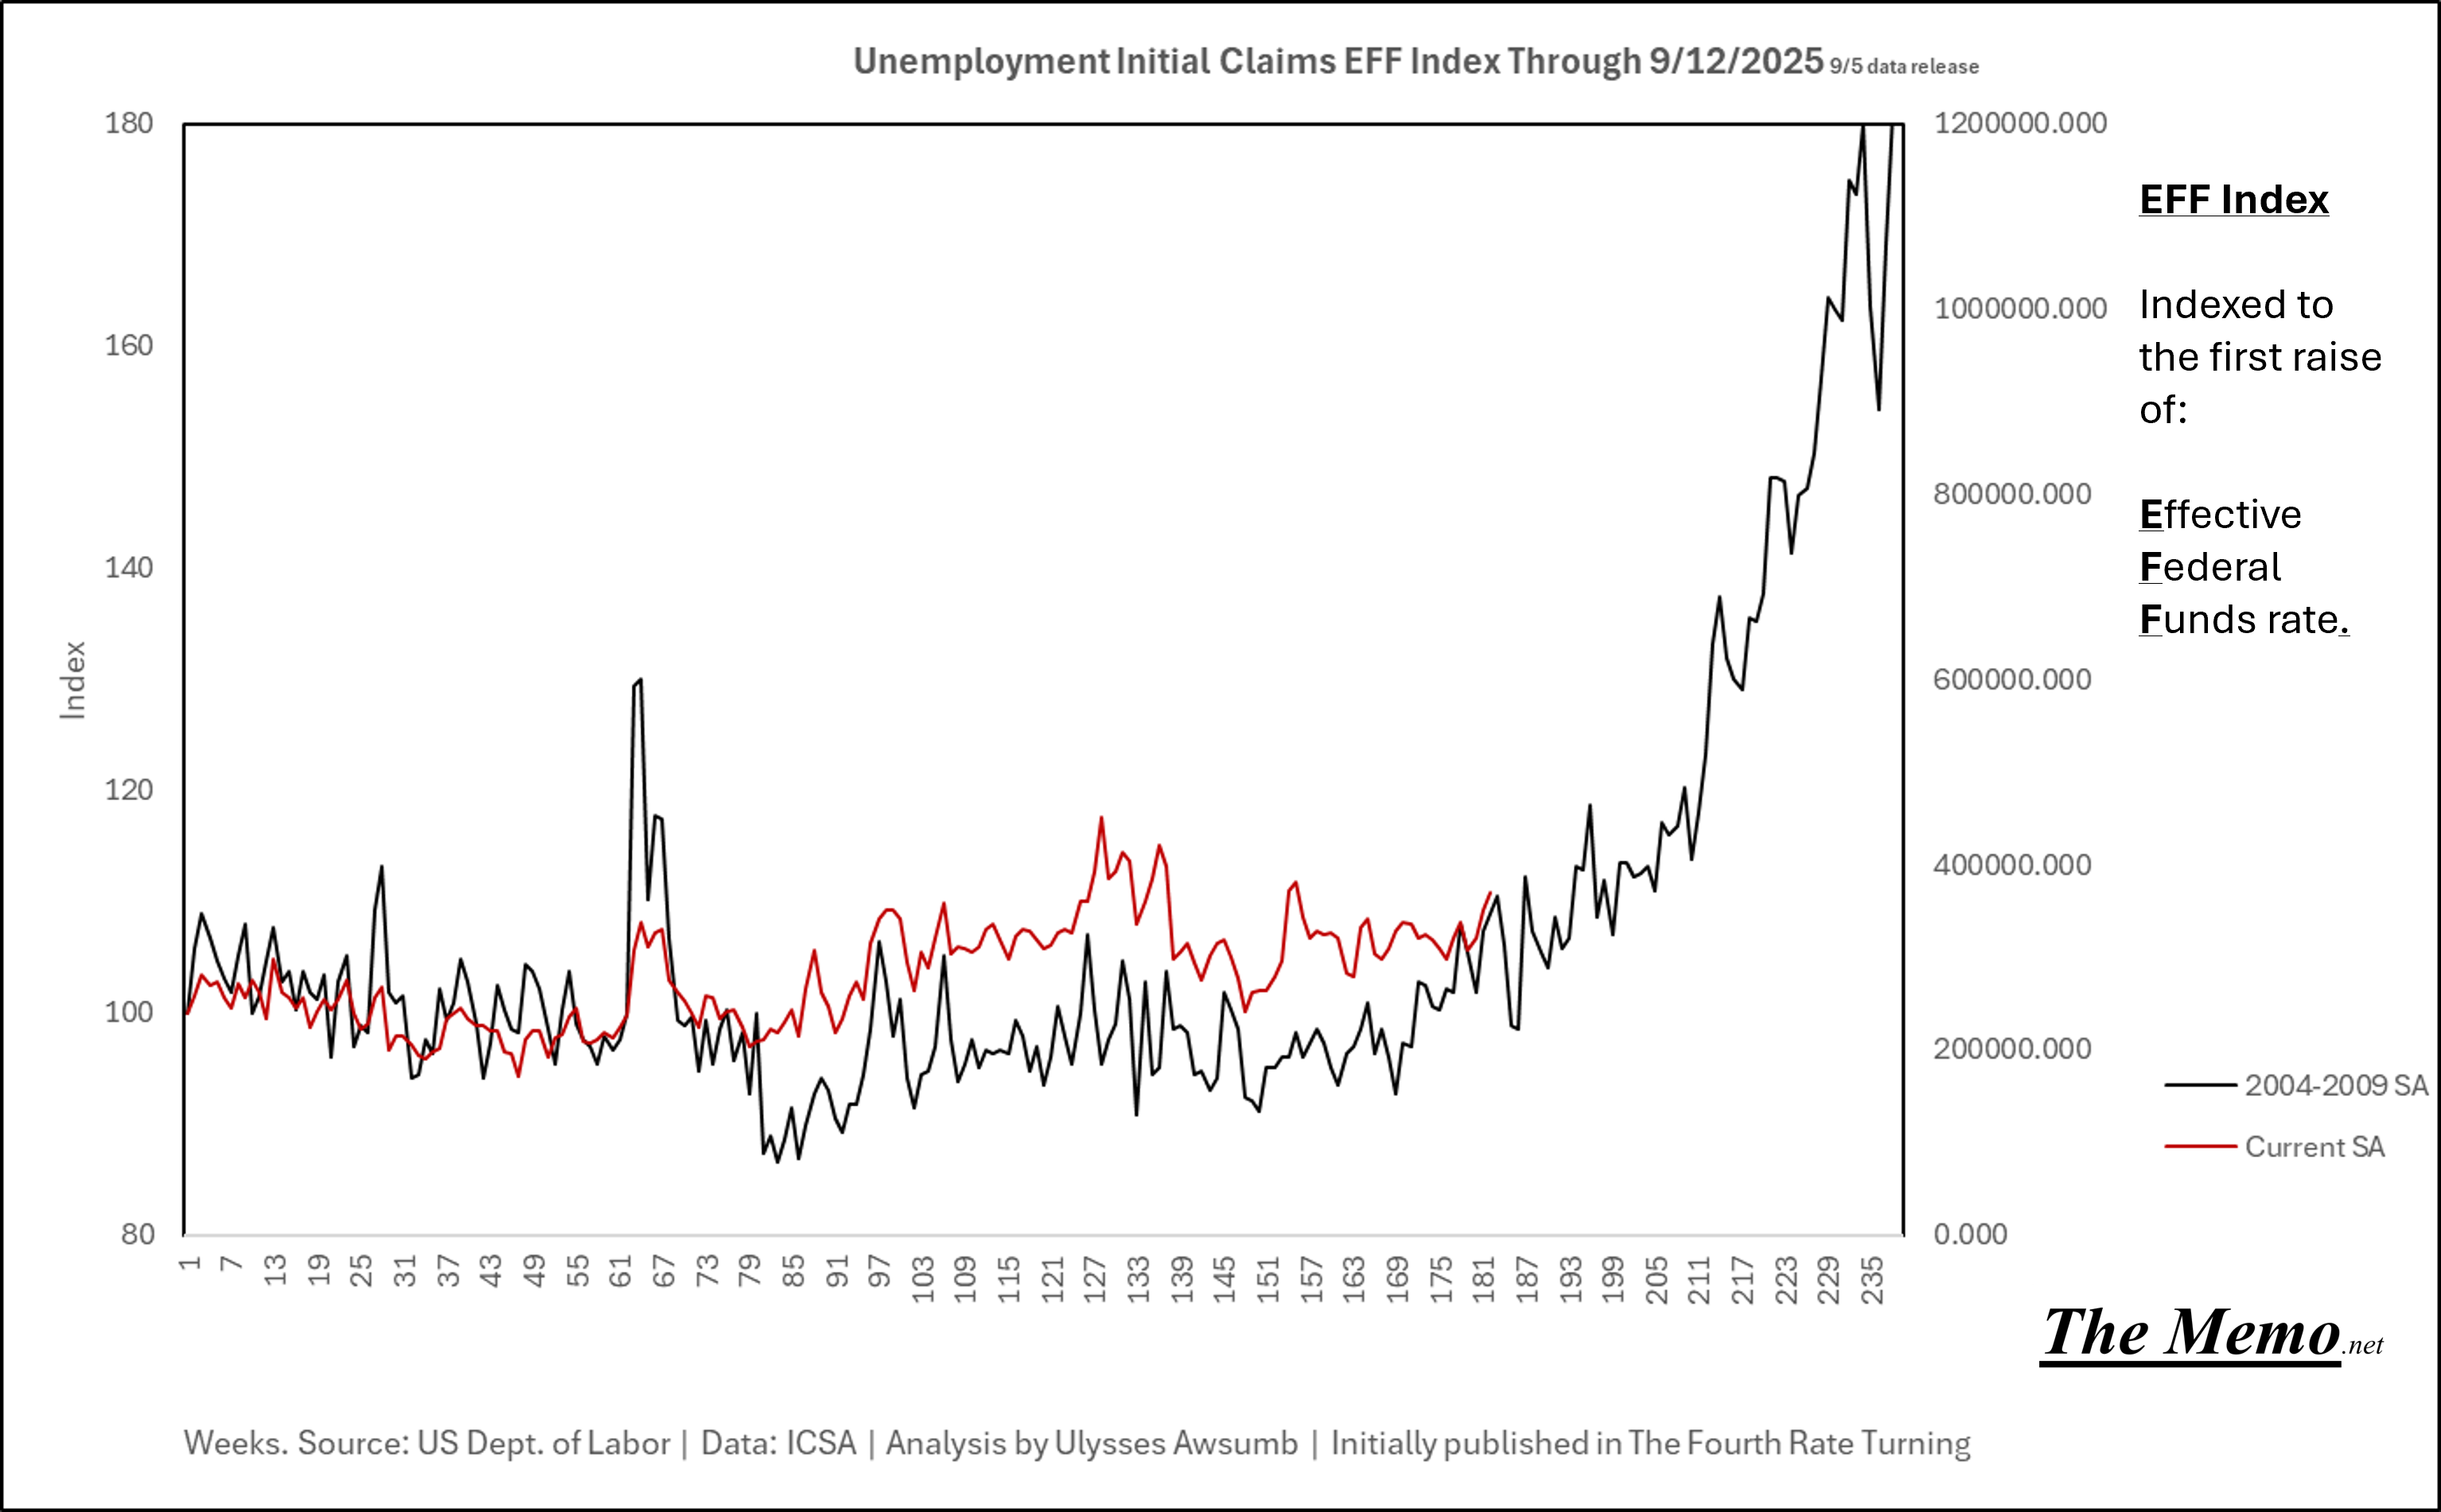
I’ll be updating and applying the SA formula myself as we go along in “shutdown” mode, lets move along to the next set of Effective Federal Funds Monetary Policy brought us back to….
Construction job postings are back to November 2020 levels. I heard that was a fun time.
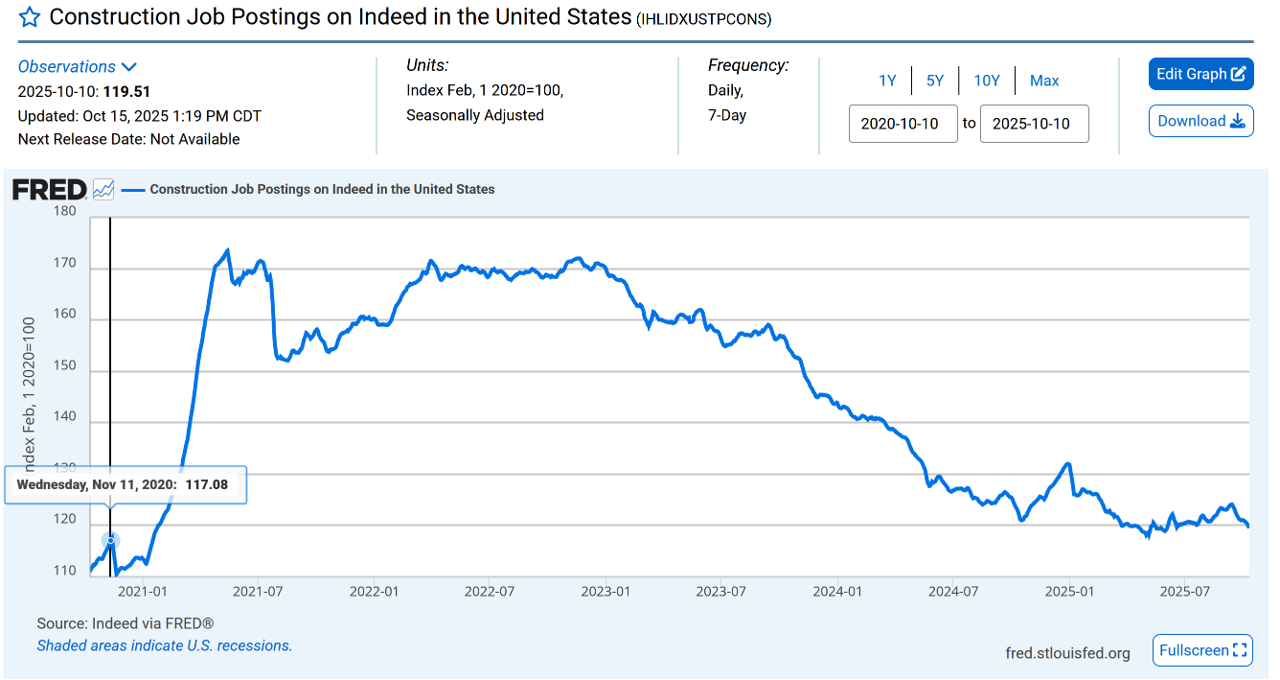
Yeah but “more people/population growth”….Yes. Yes exactly. More and yet, still less.
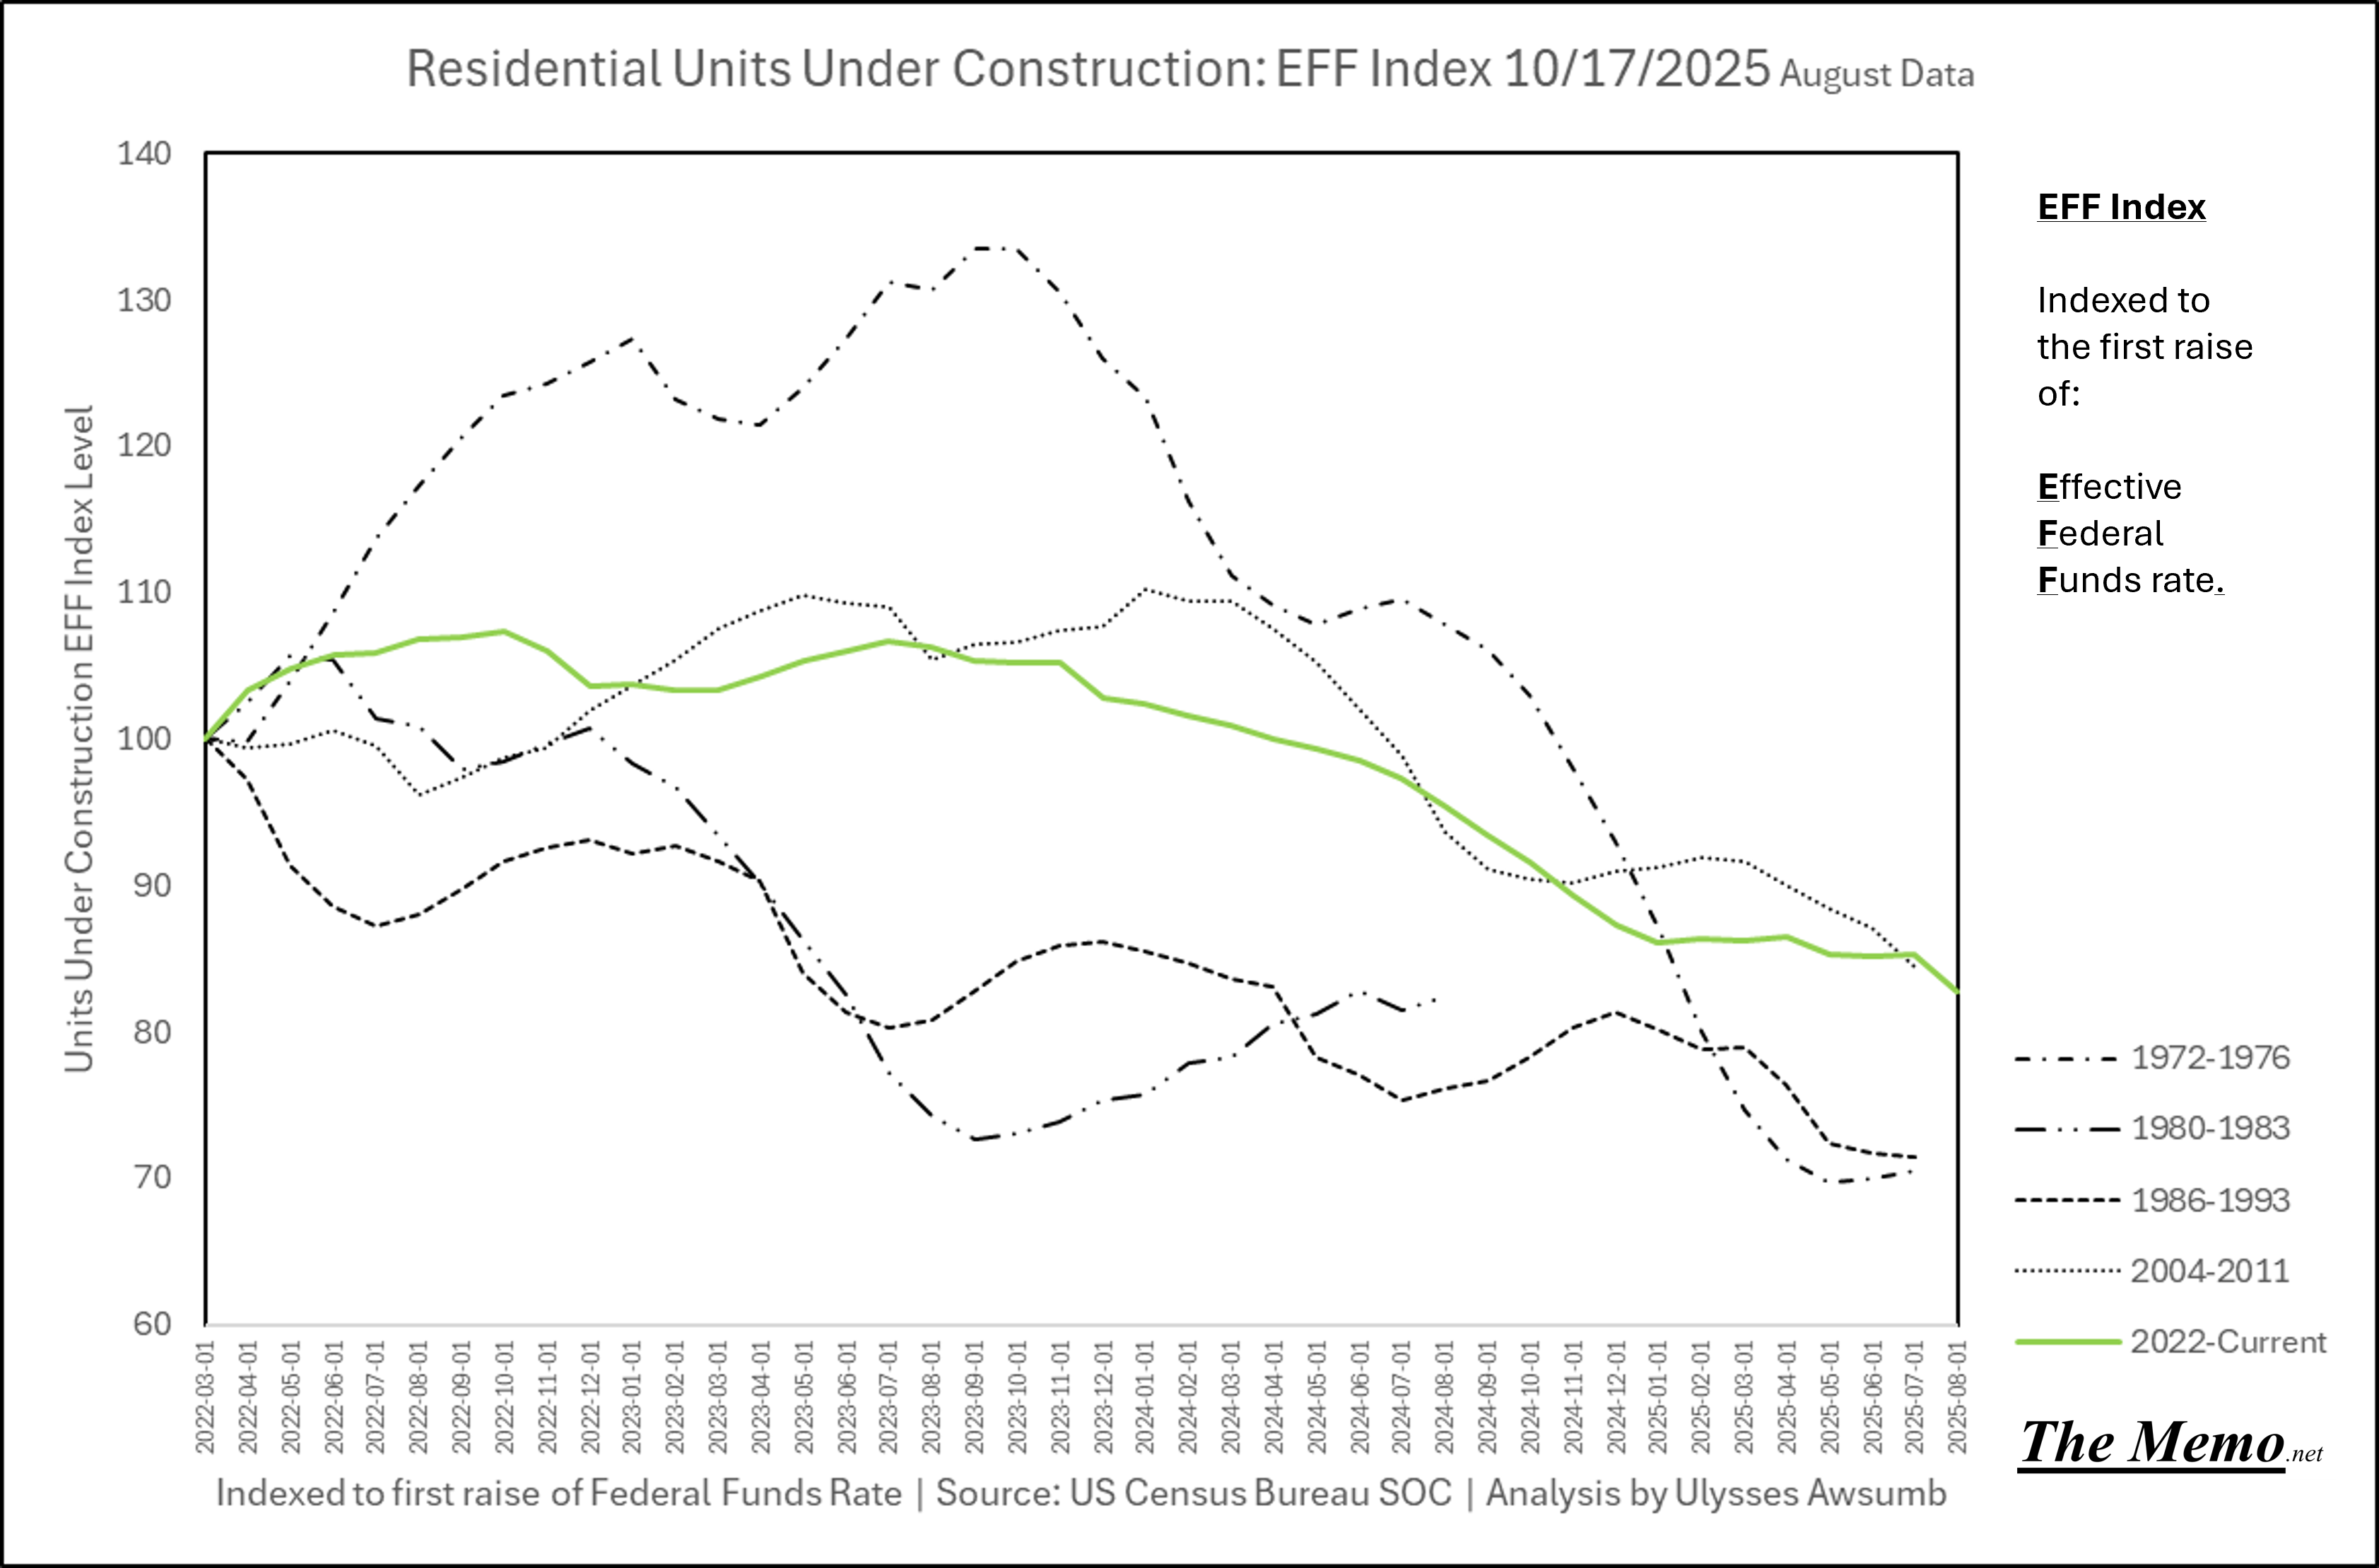
US CON. STATS. Homes & Home Accessories.
Which brings us to we’re back to April 2021 levels of privately owned housing under construction 1-multifamily. Which is still more than all other time periods outside the last 3 years and 1973-1975. From August. Because we won’t ever get September data. (Wake up, September is gone)
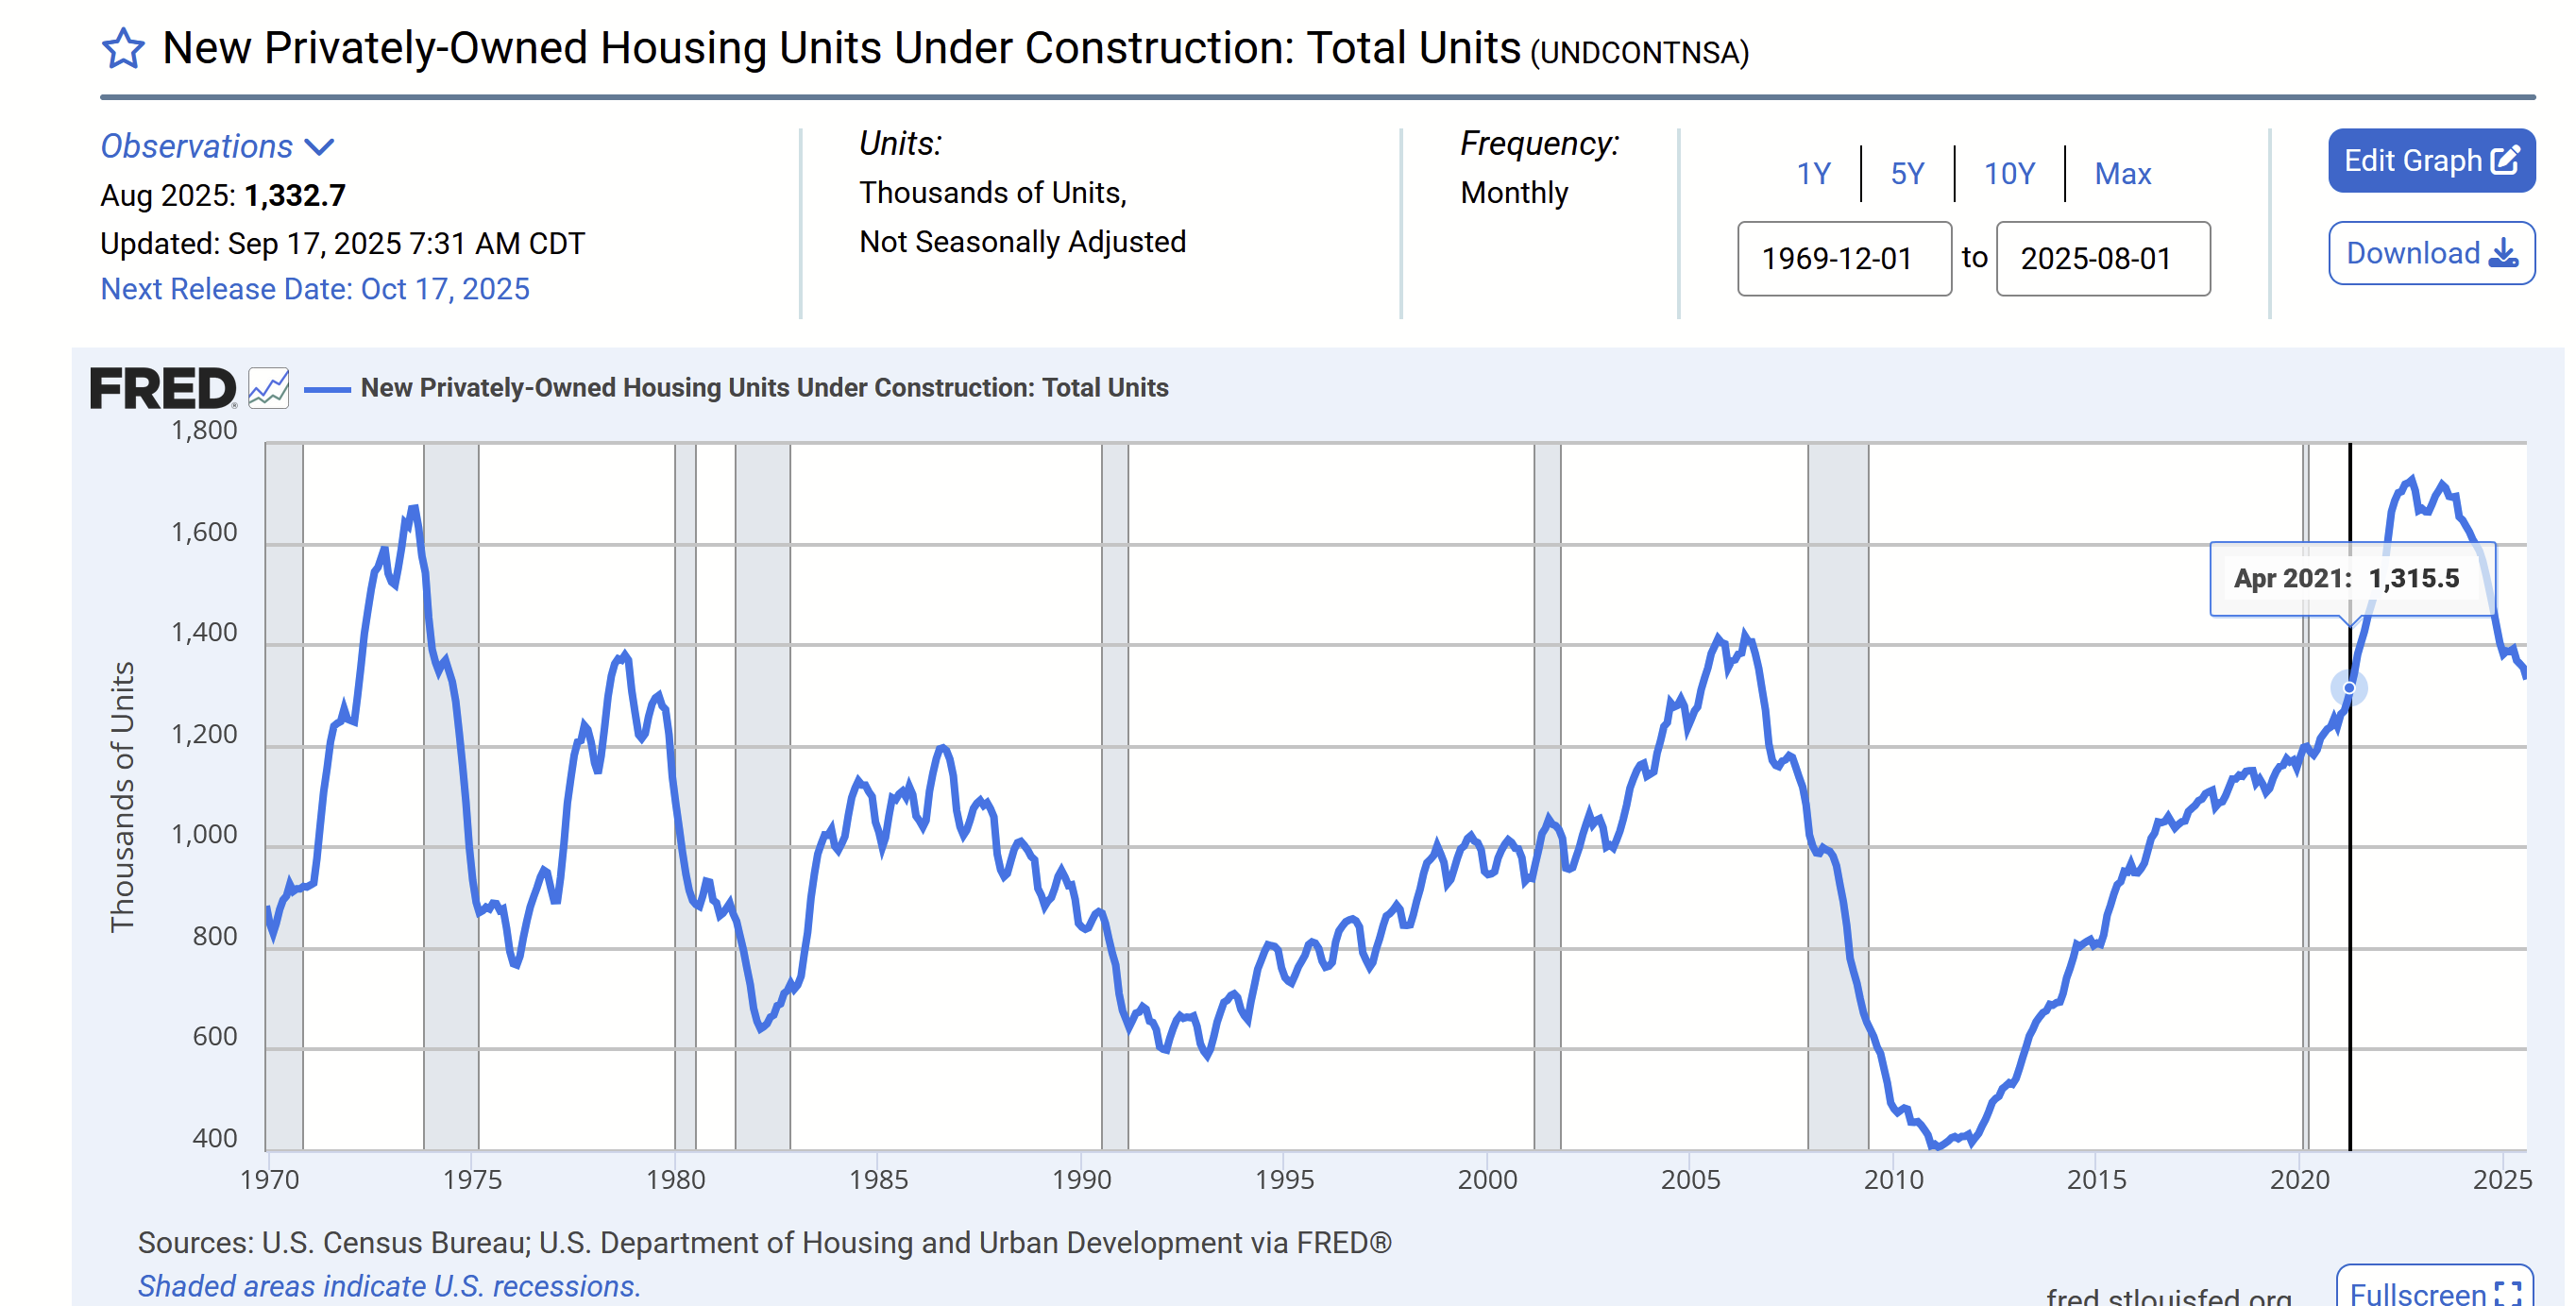
Here’s the current situation as was left off in EFFing time, compared to the bigger contraction cycles.
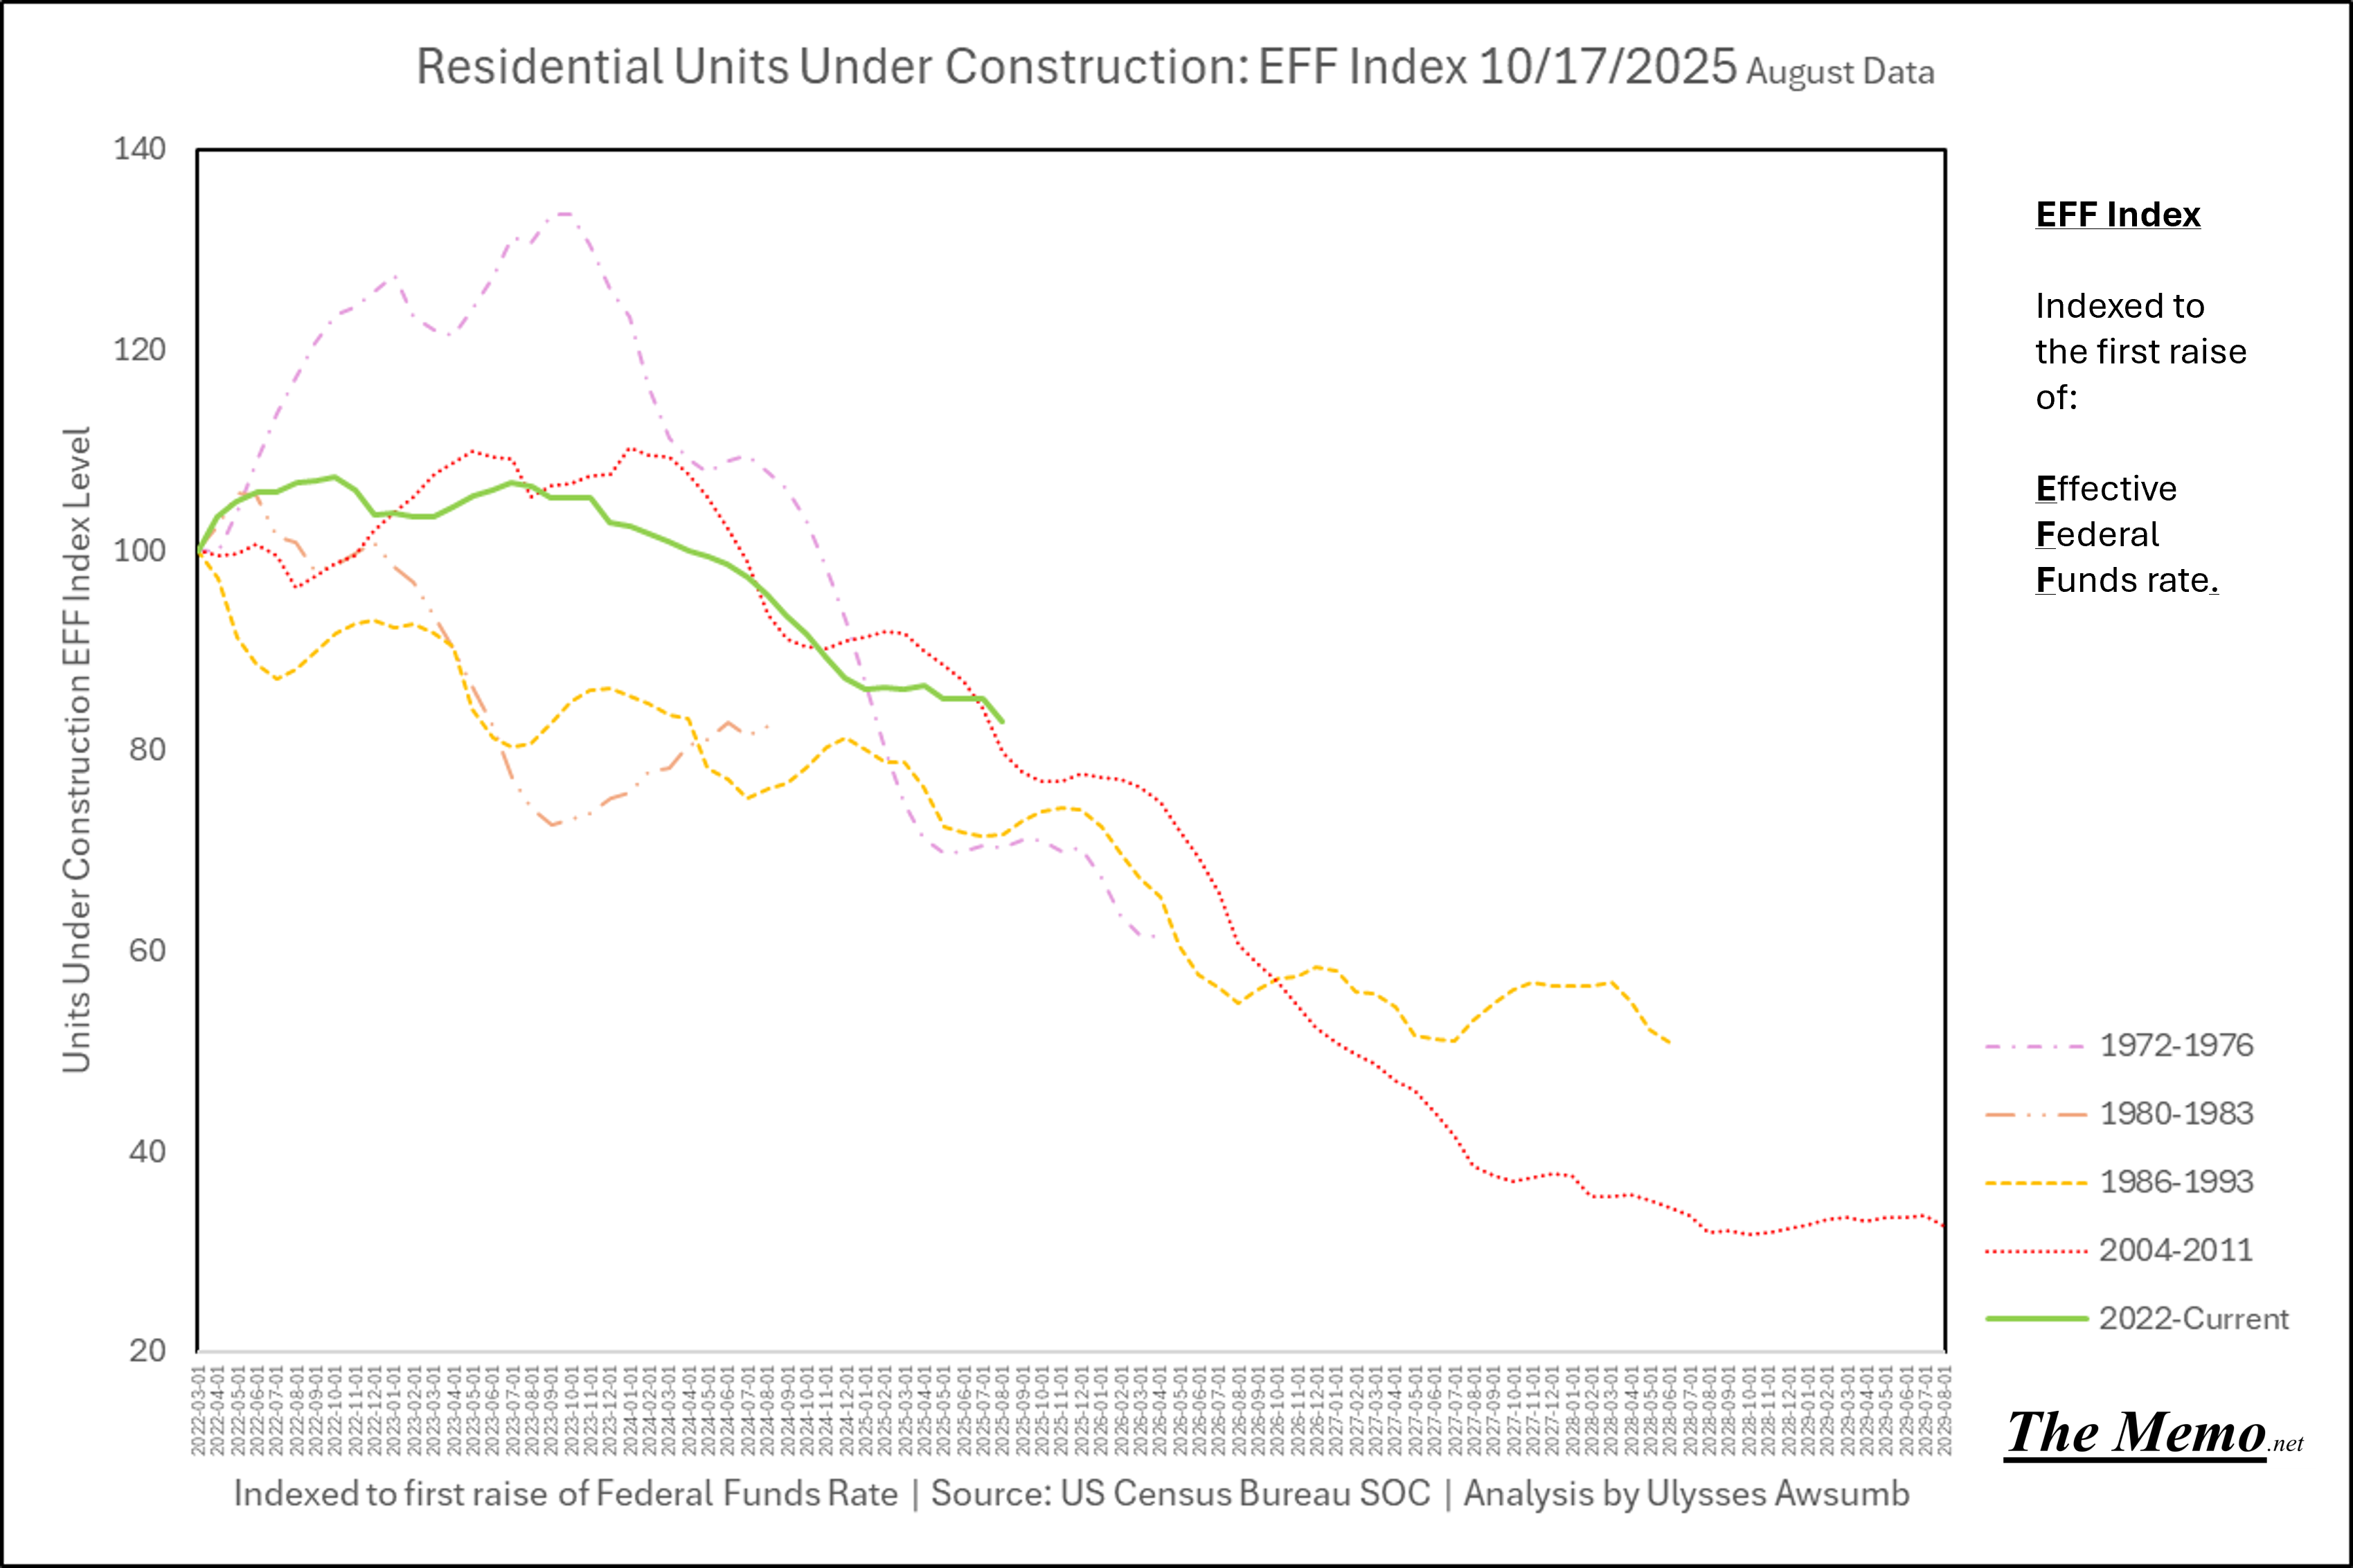
And the longer term effects as we’ve left a couple of those cycles in the past.
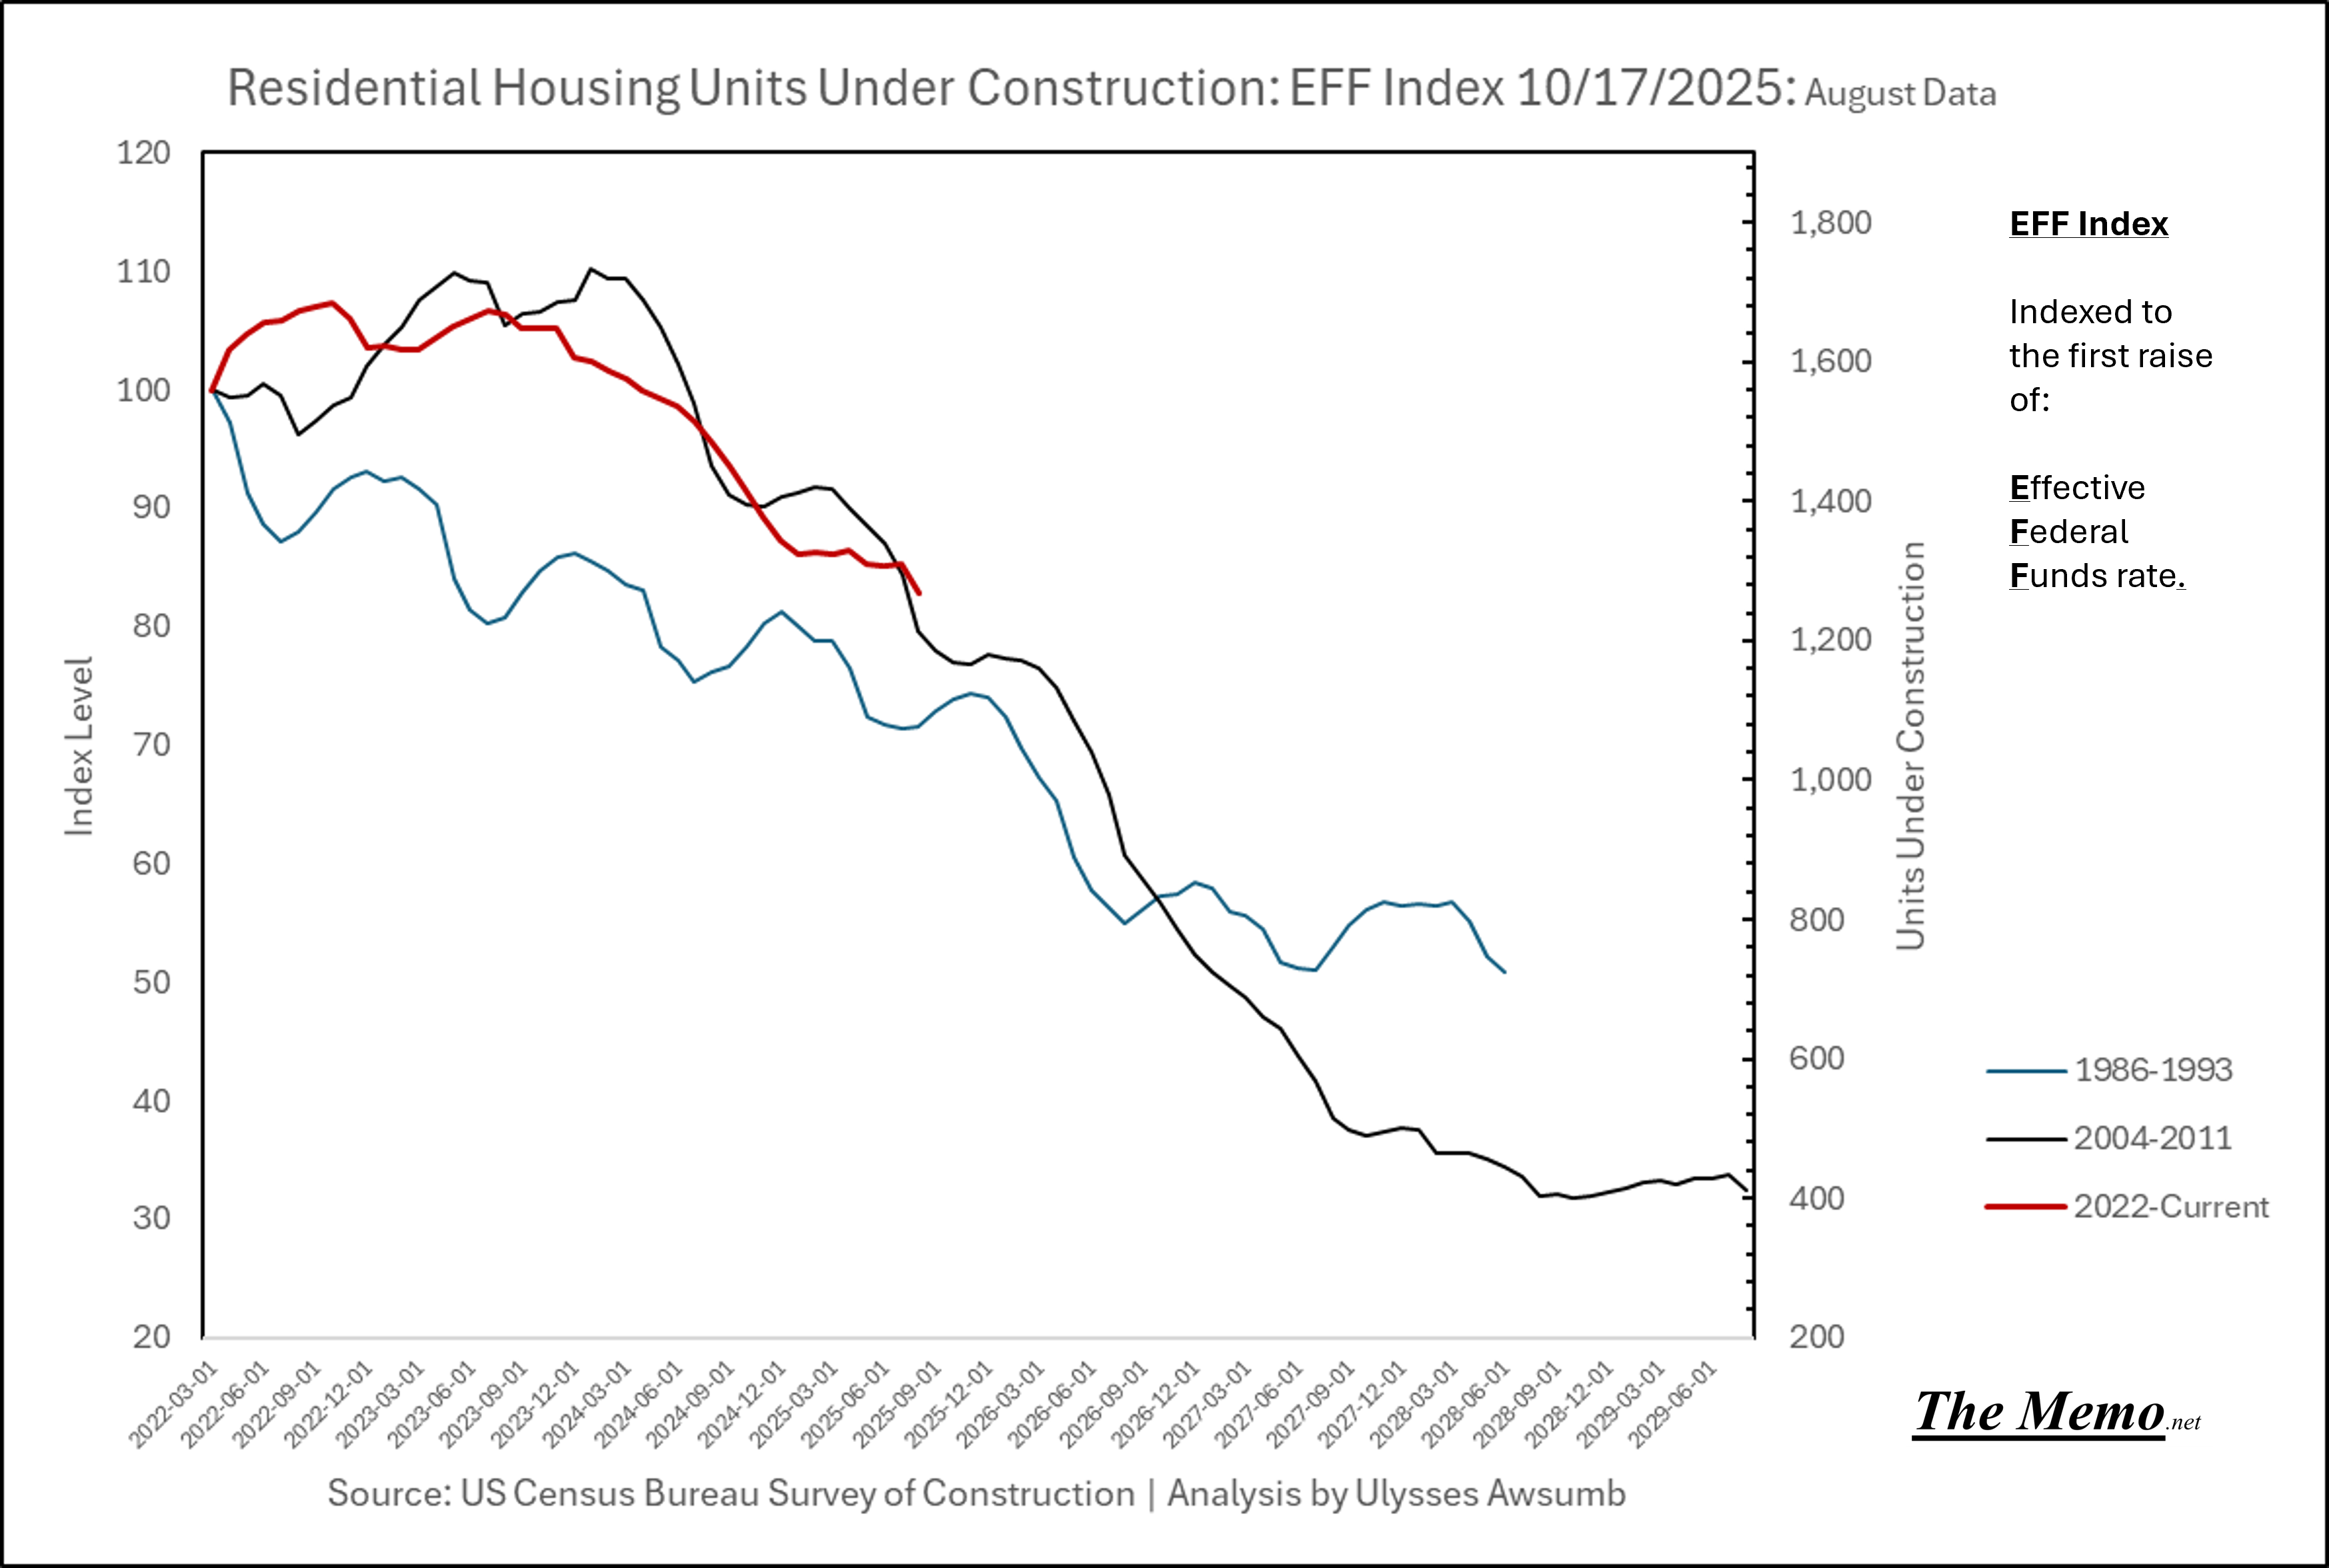
And the two cycles we currently most resemble.
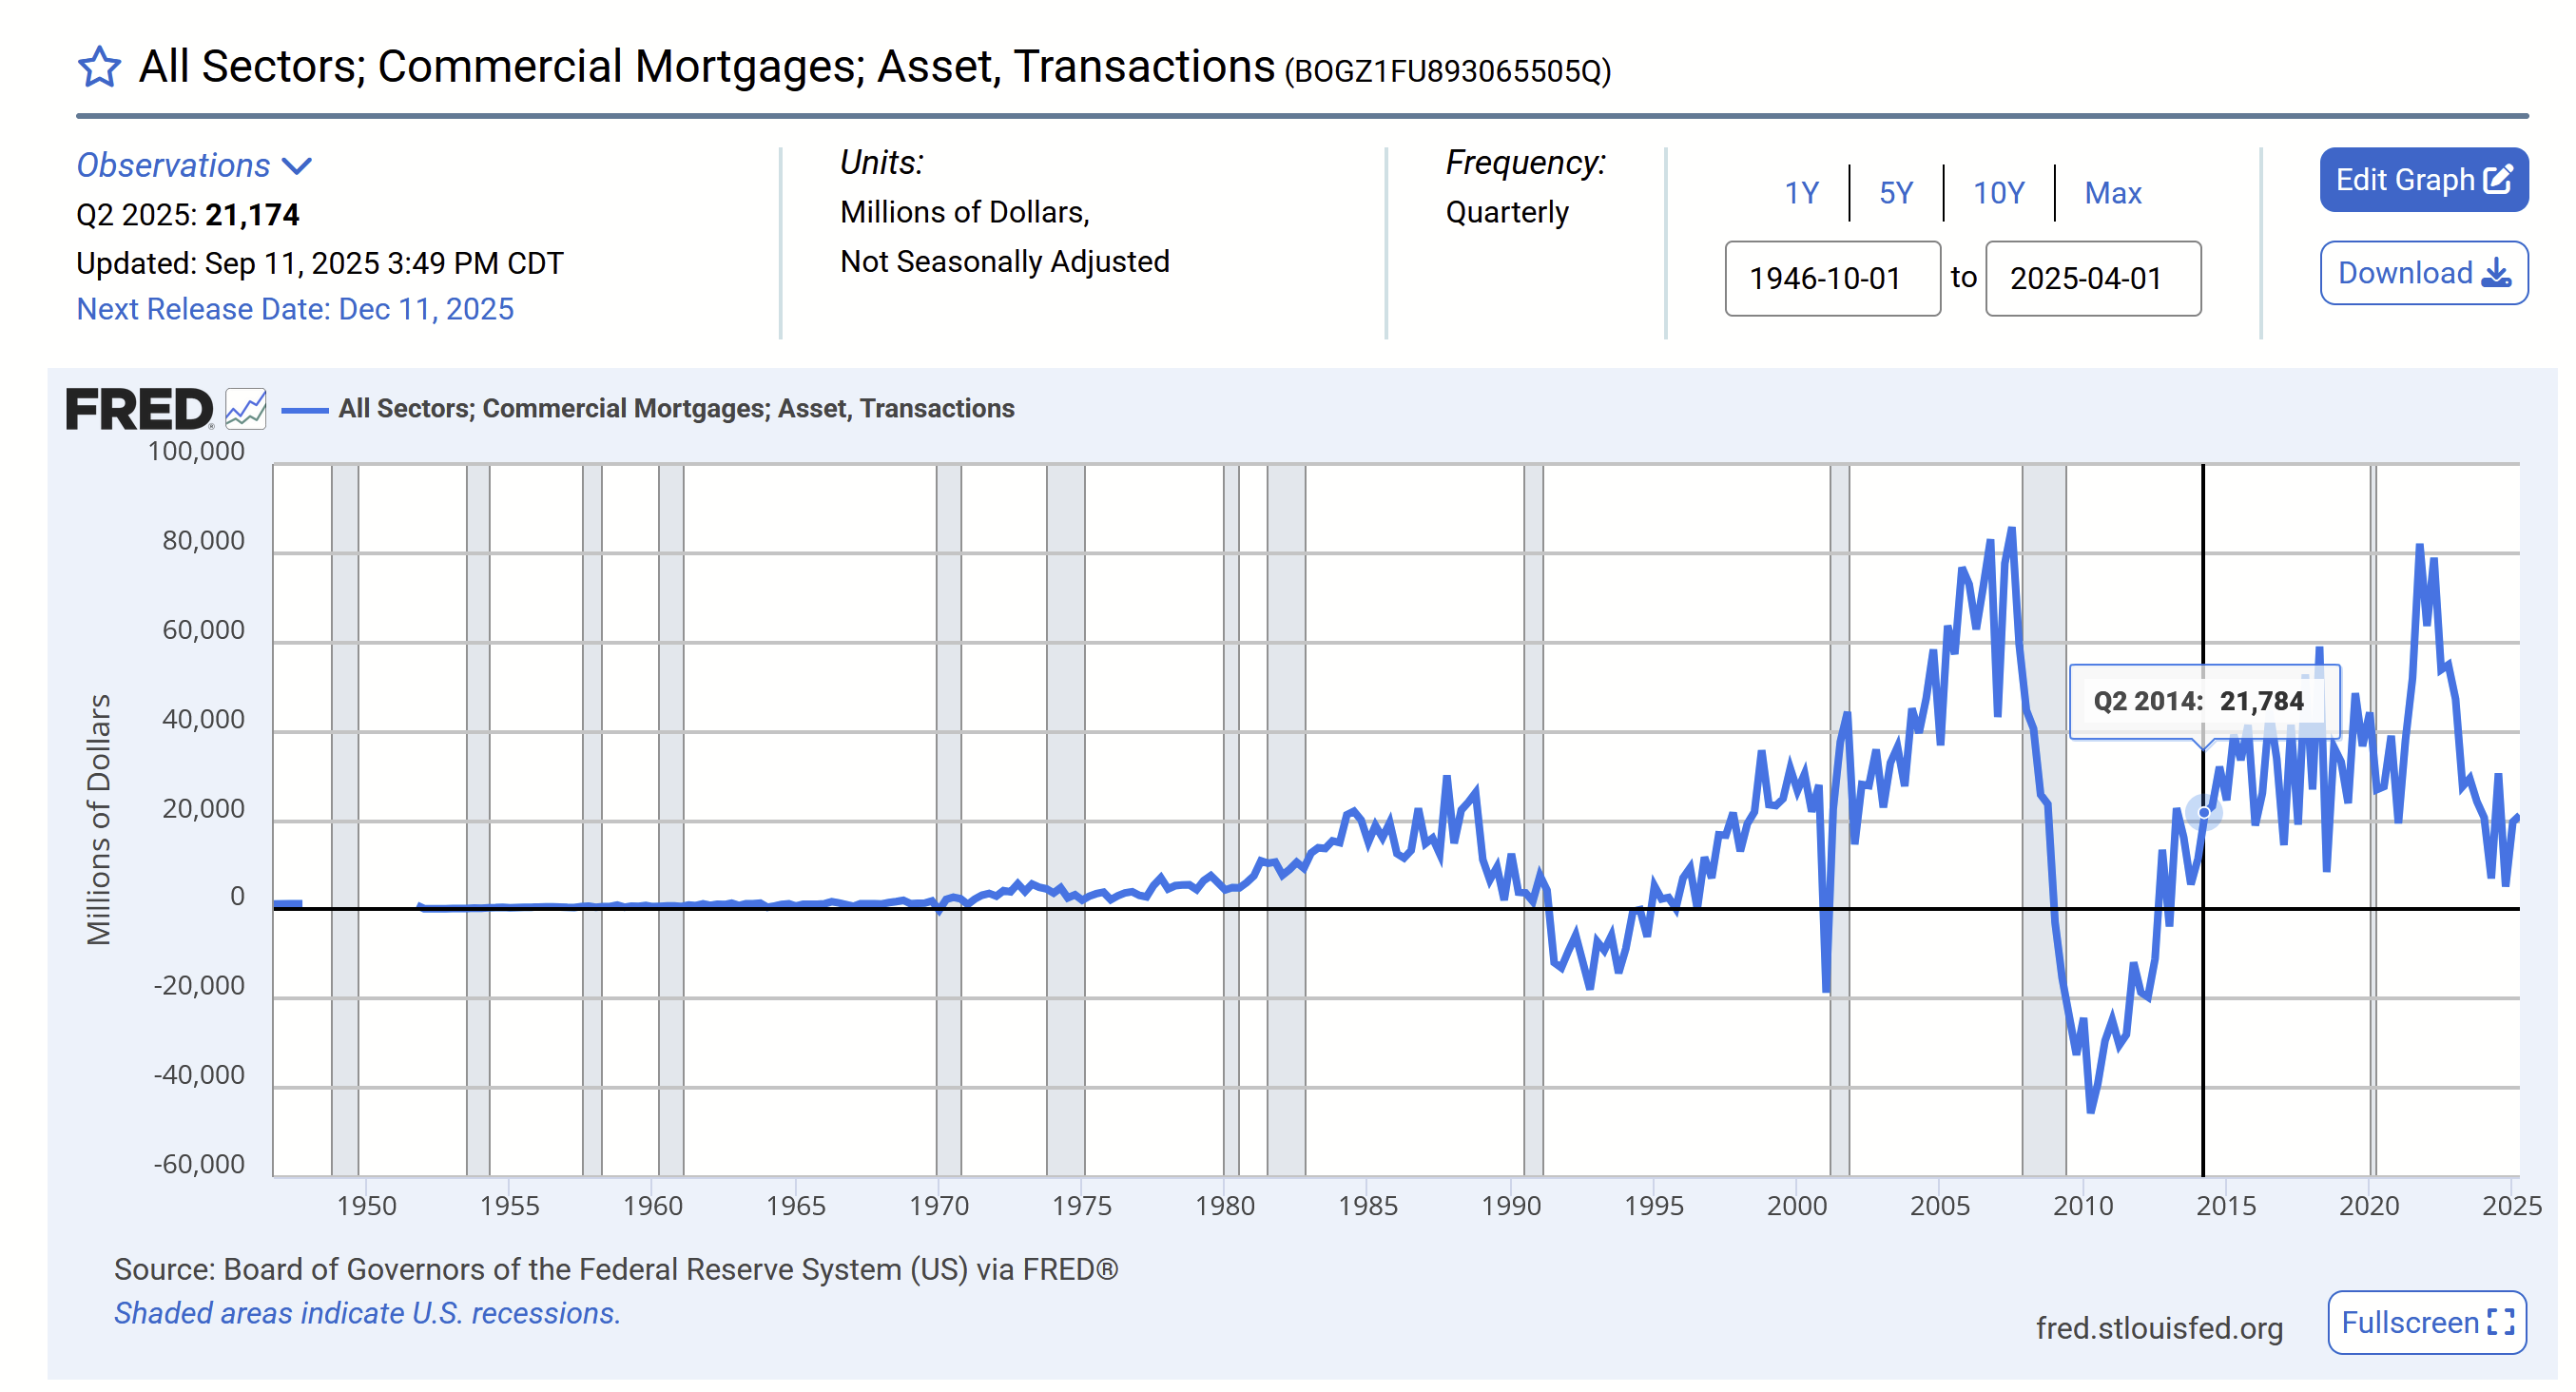
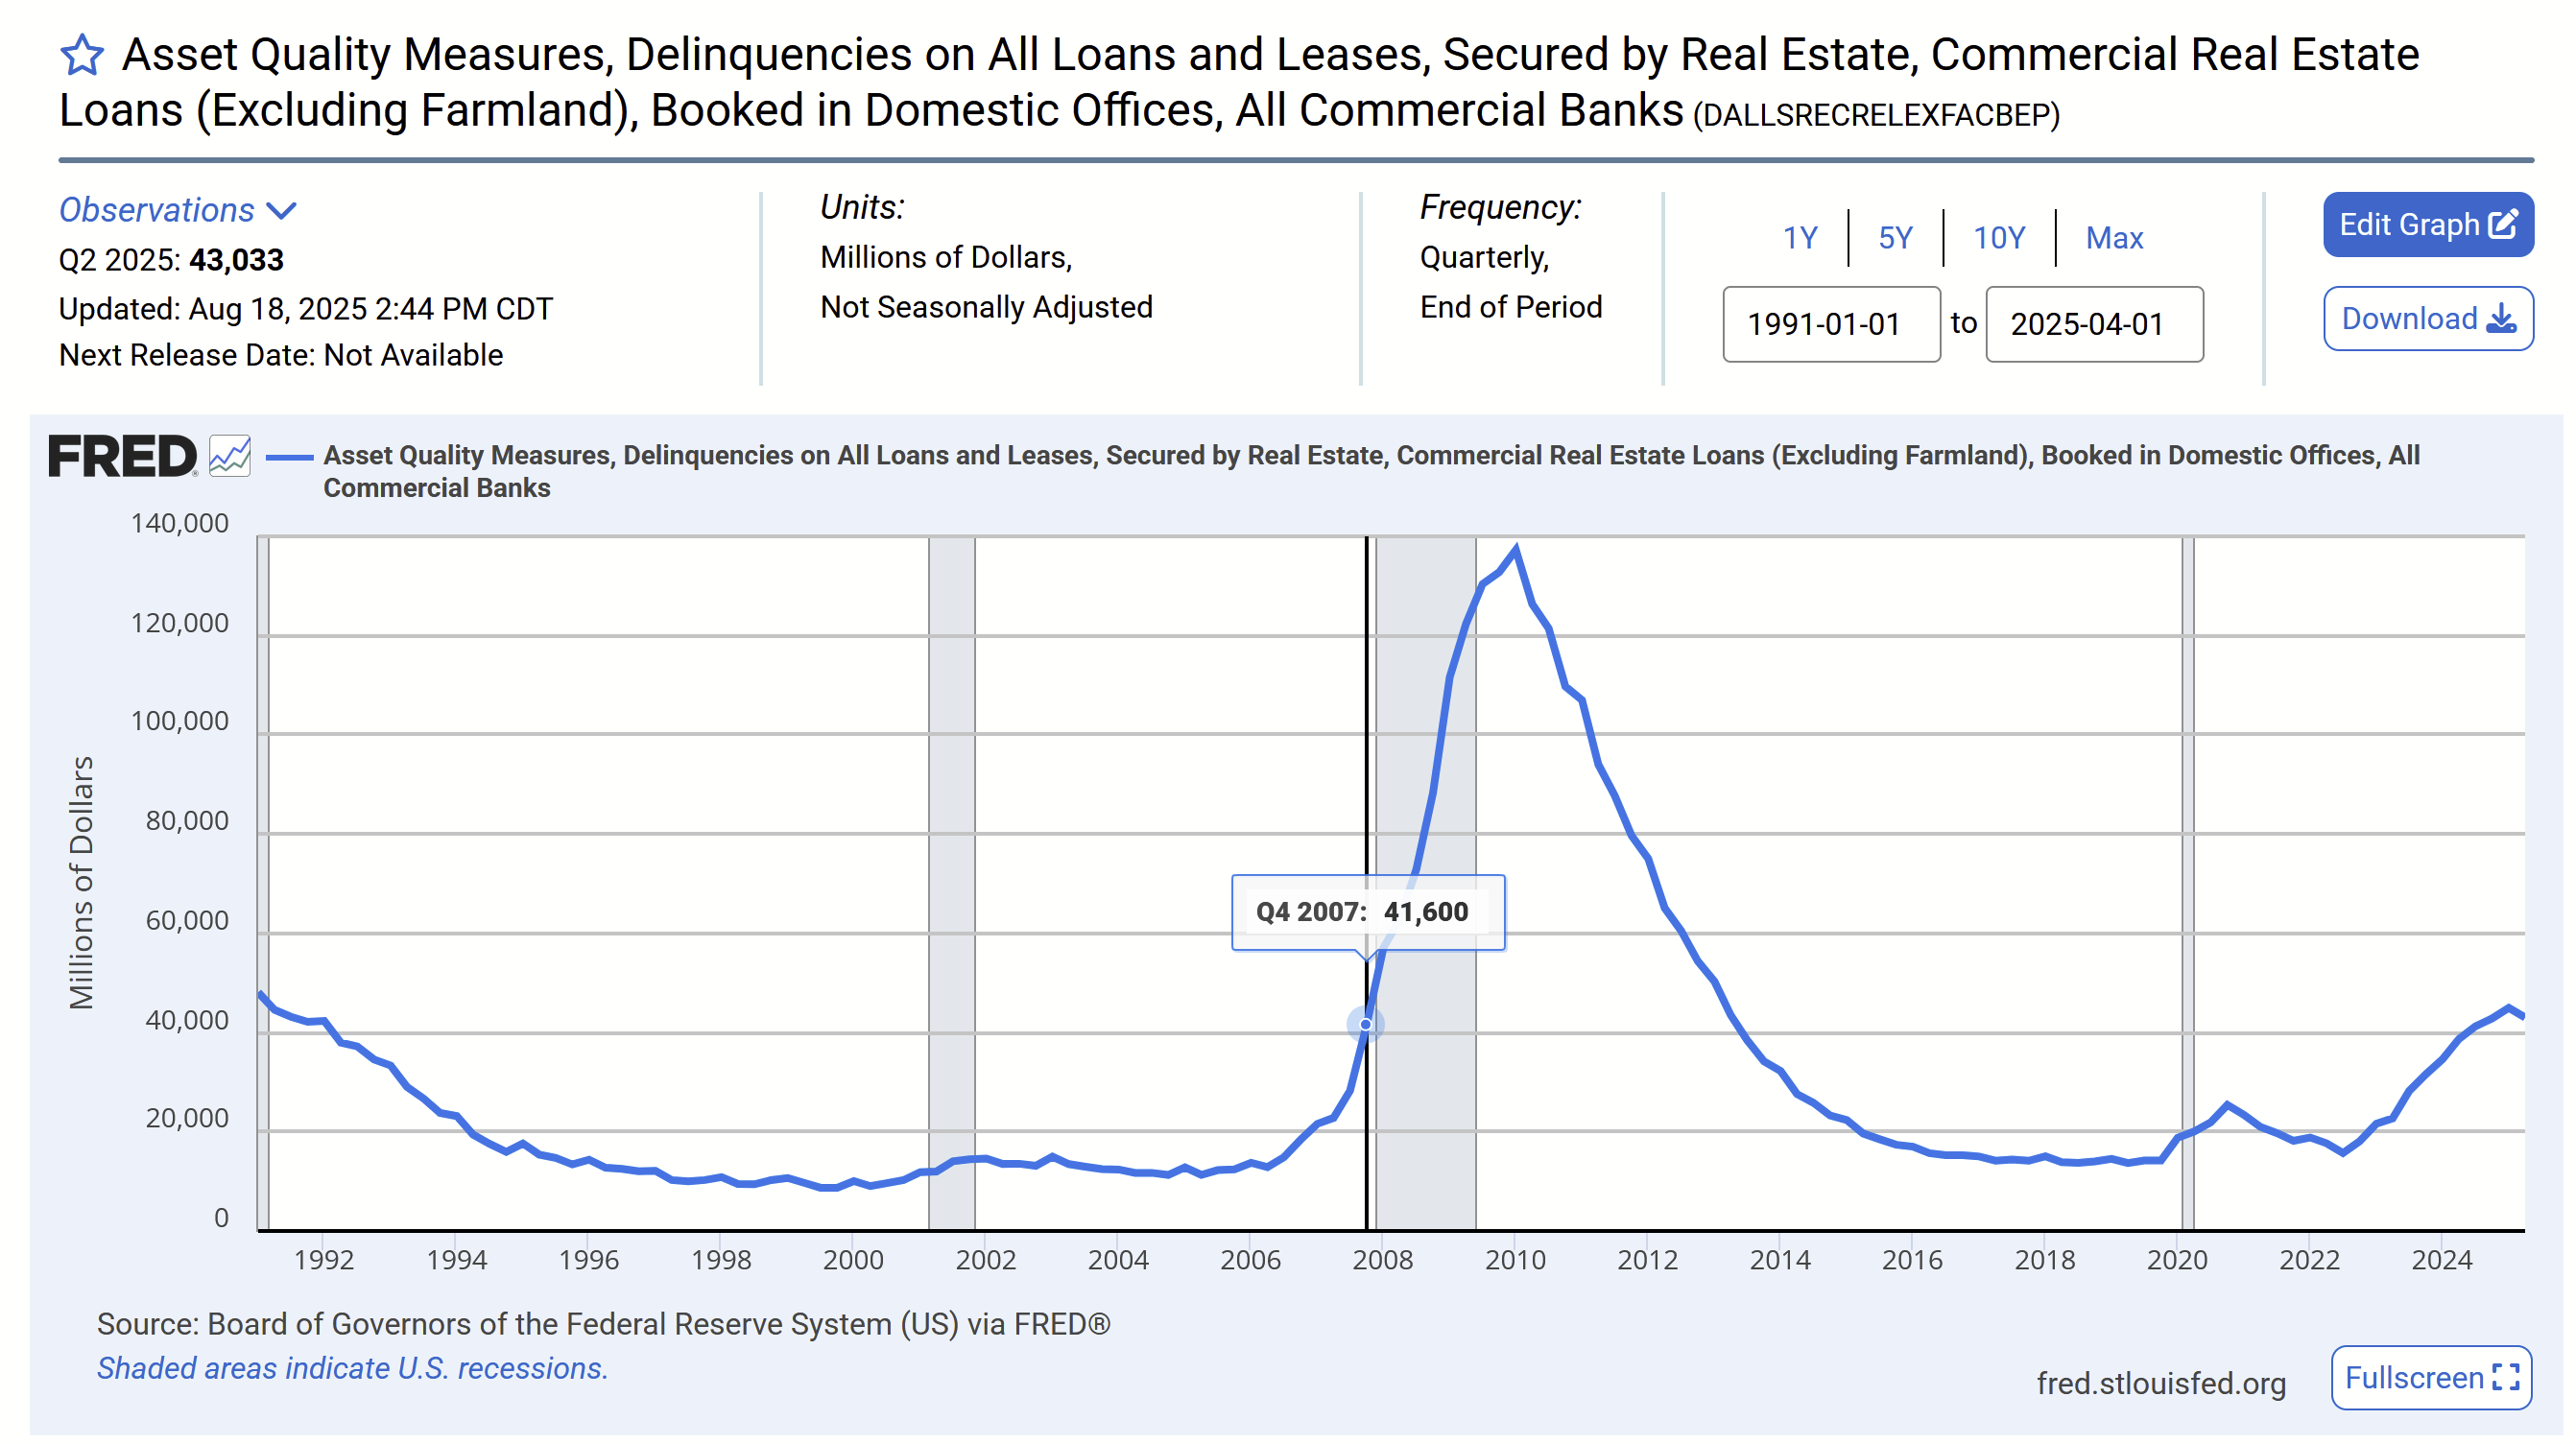
Mortgage Asset Transactions
Commercial mortgage assets are near to going negative, across all sectors. We’re back to 2014 levels.
Delinquency values and non performing (asset quality measures) are still at (slightly higher than) Q4 2007 levels for commercial real estate loans.
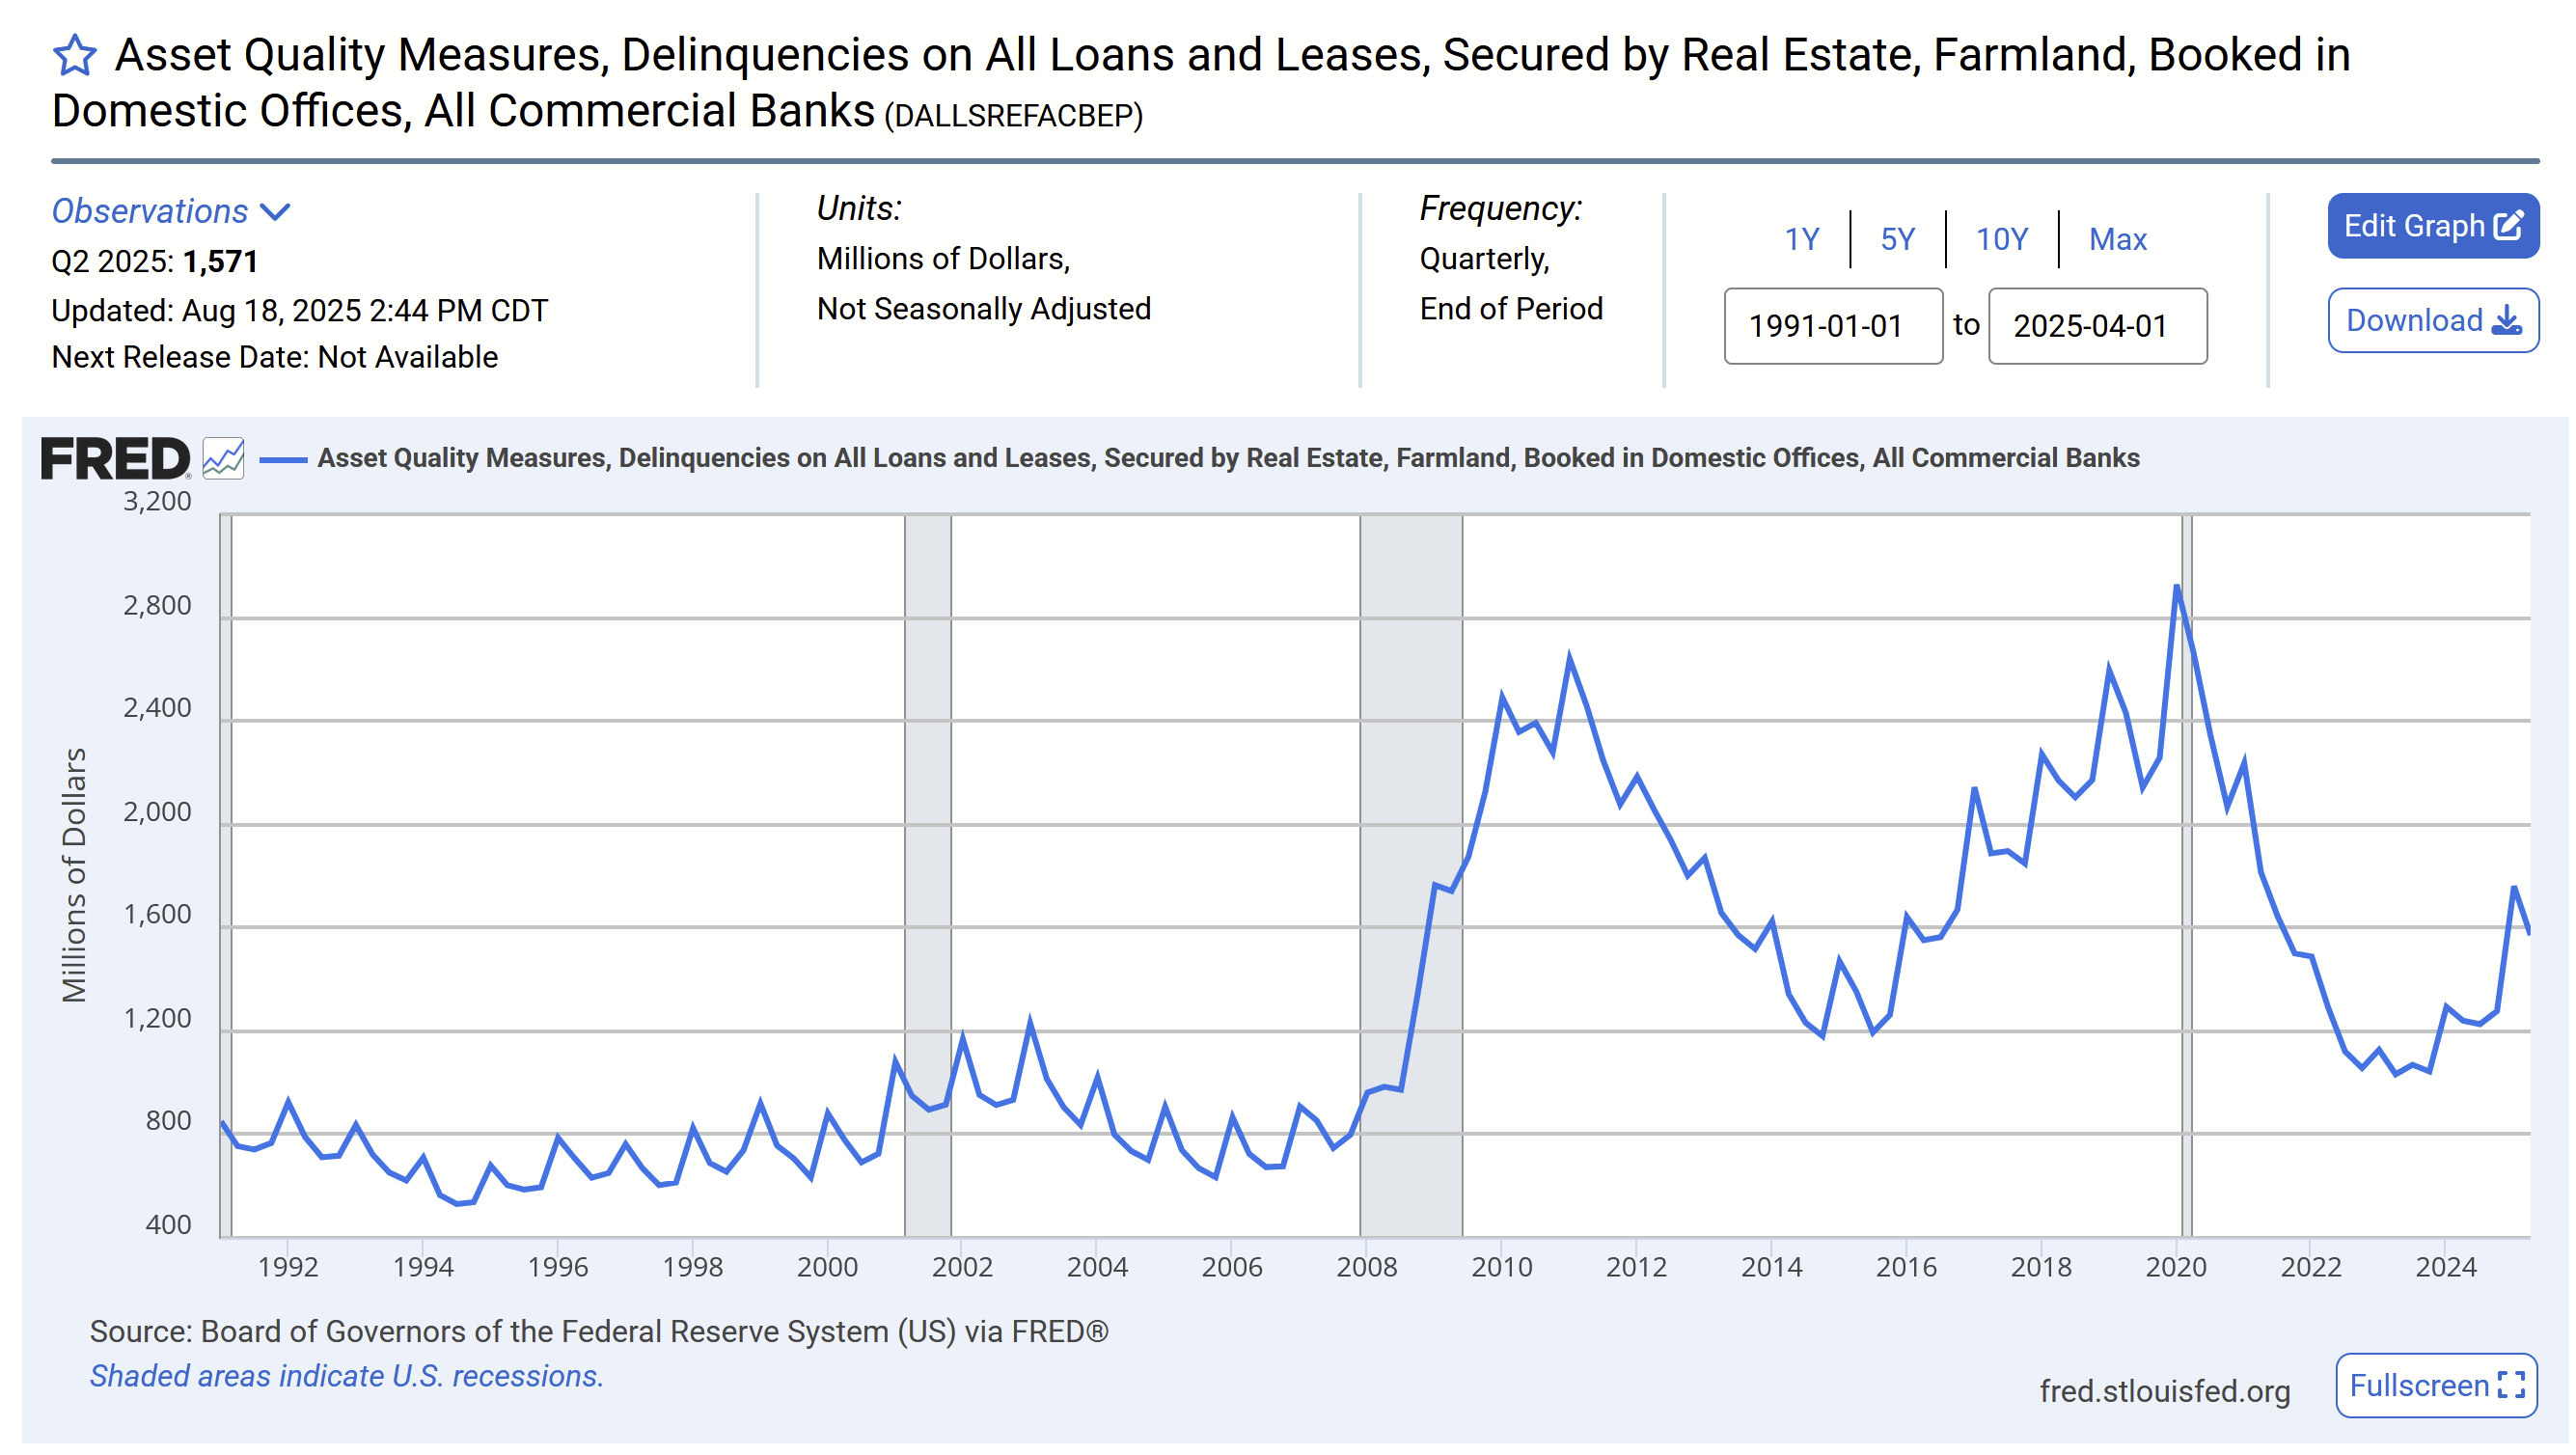
While you see stories of farmers on tv regarding the banner crop yields this year, the low commodity prices and trade wars, keep in mind, delinquency values are climbing and match 2008 levels. And this is backward looking (Q2). Welcome to Q4, the harvesting season.
Despite all that, spreads for residential mortgages are dropping for now. Based on pricing and incomes, at present, I don’t see a major bounce in existing sales soon.

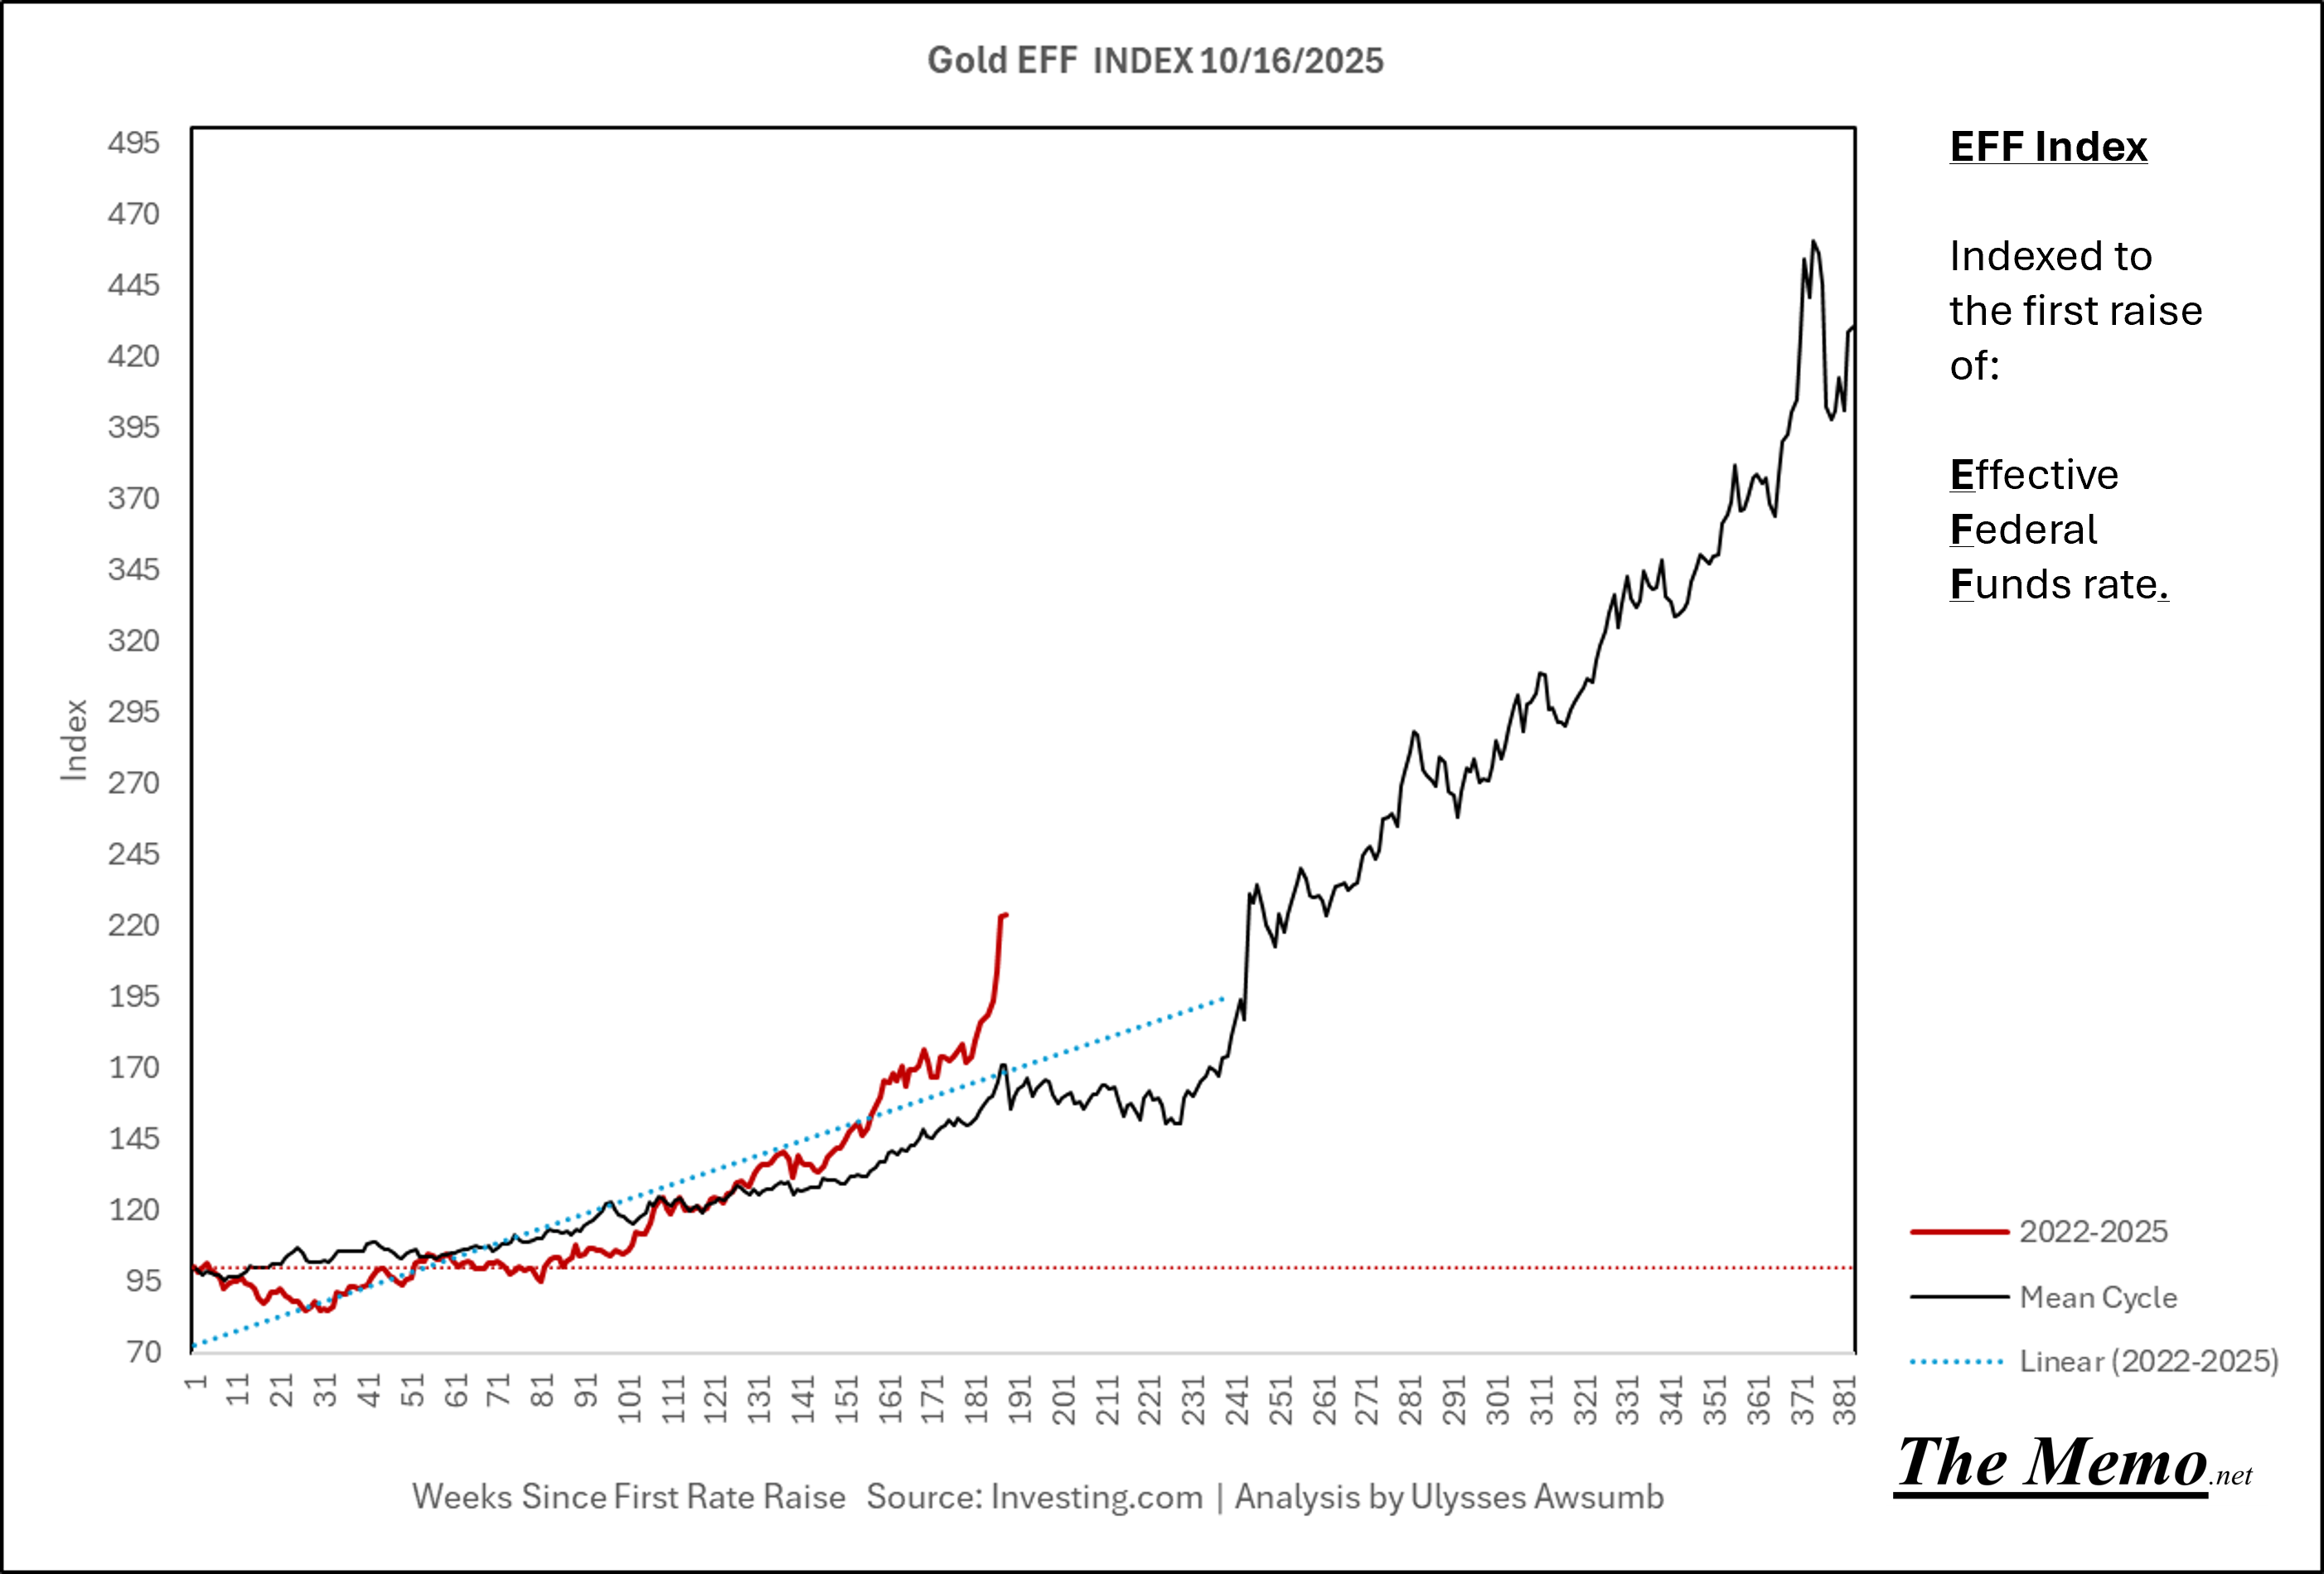
No Mr Bond. I expect you to die.
Large holders of gold probably have a nice liquid market to take profits into right now.
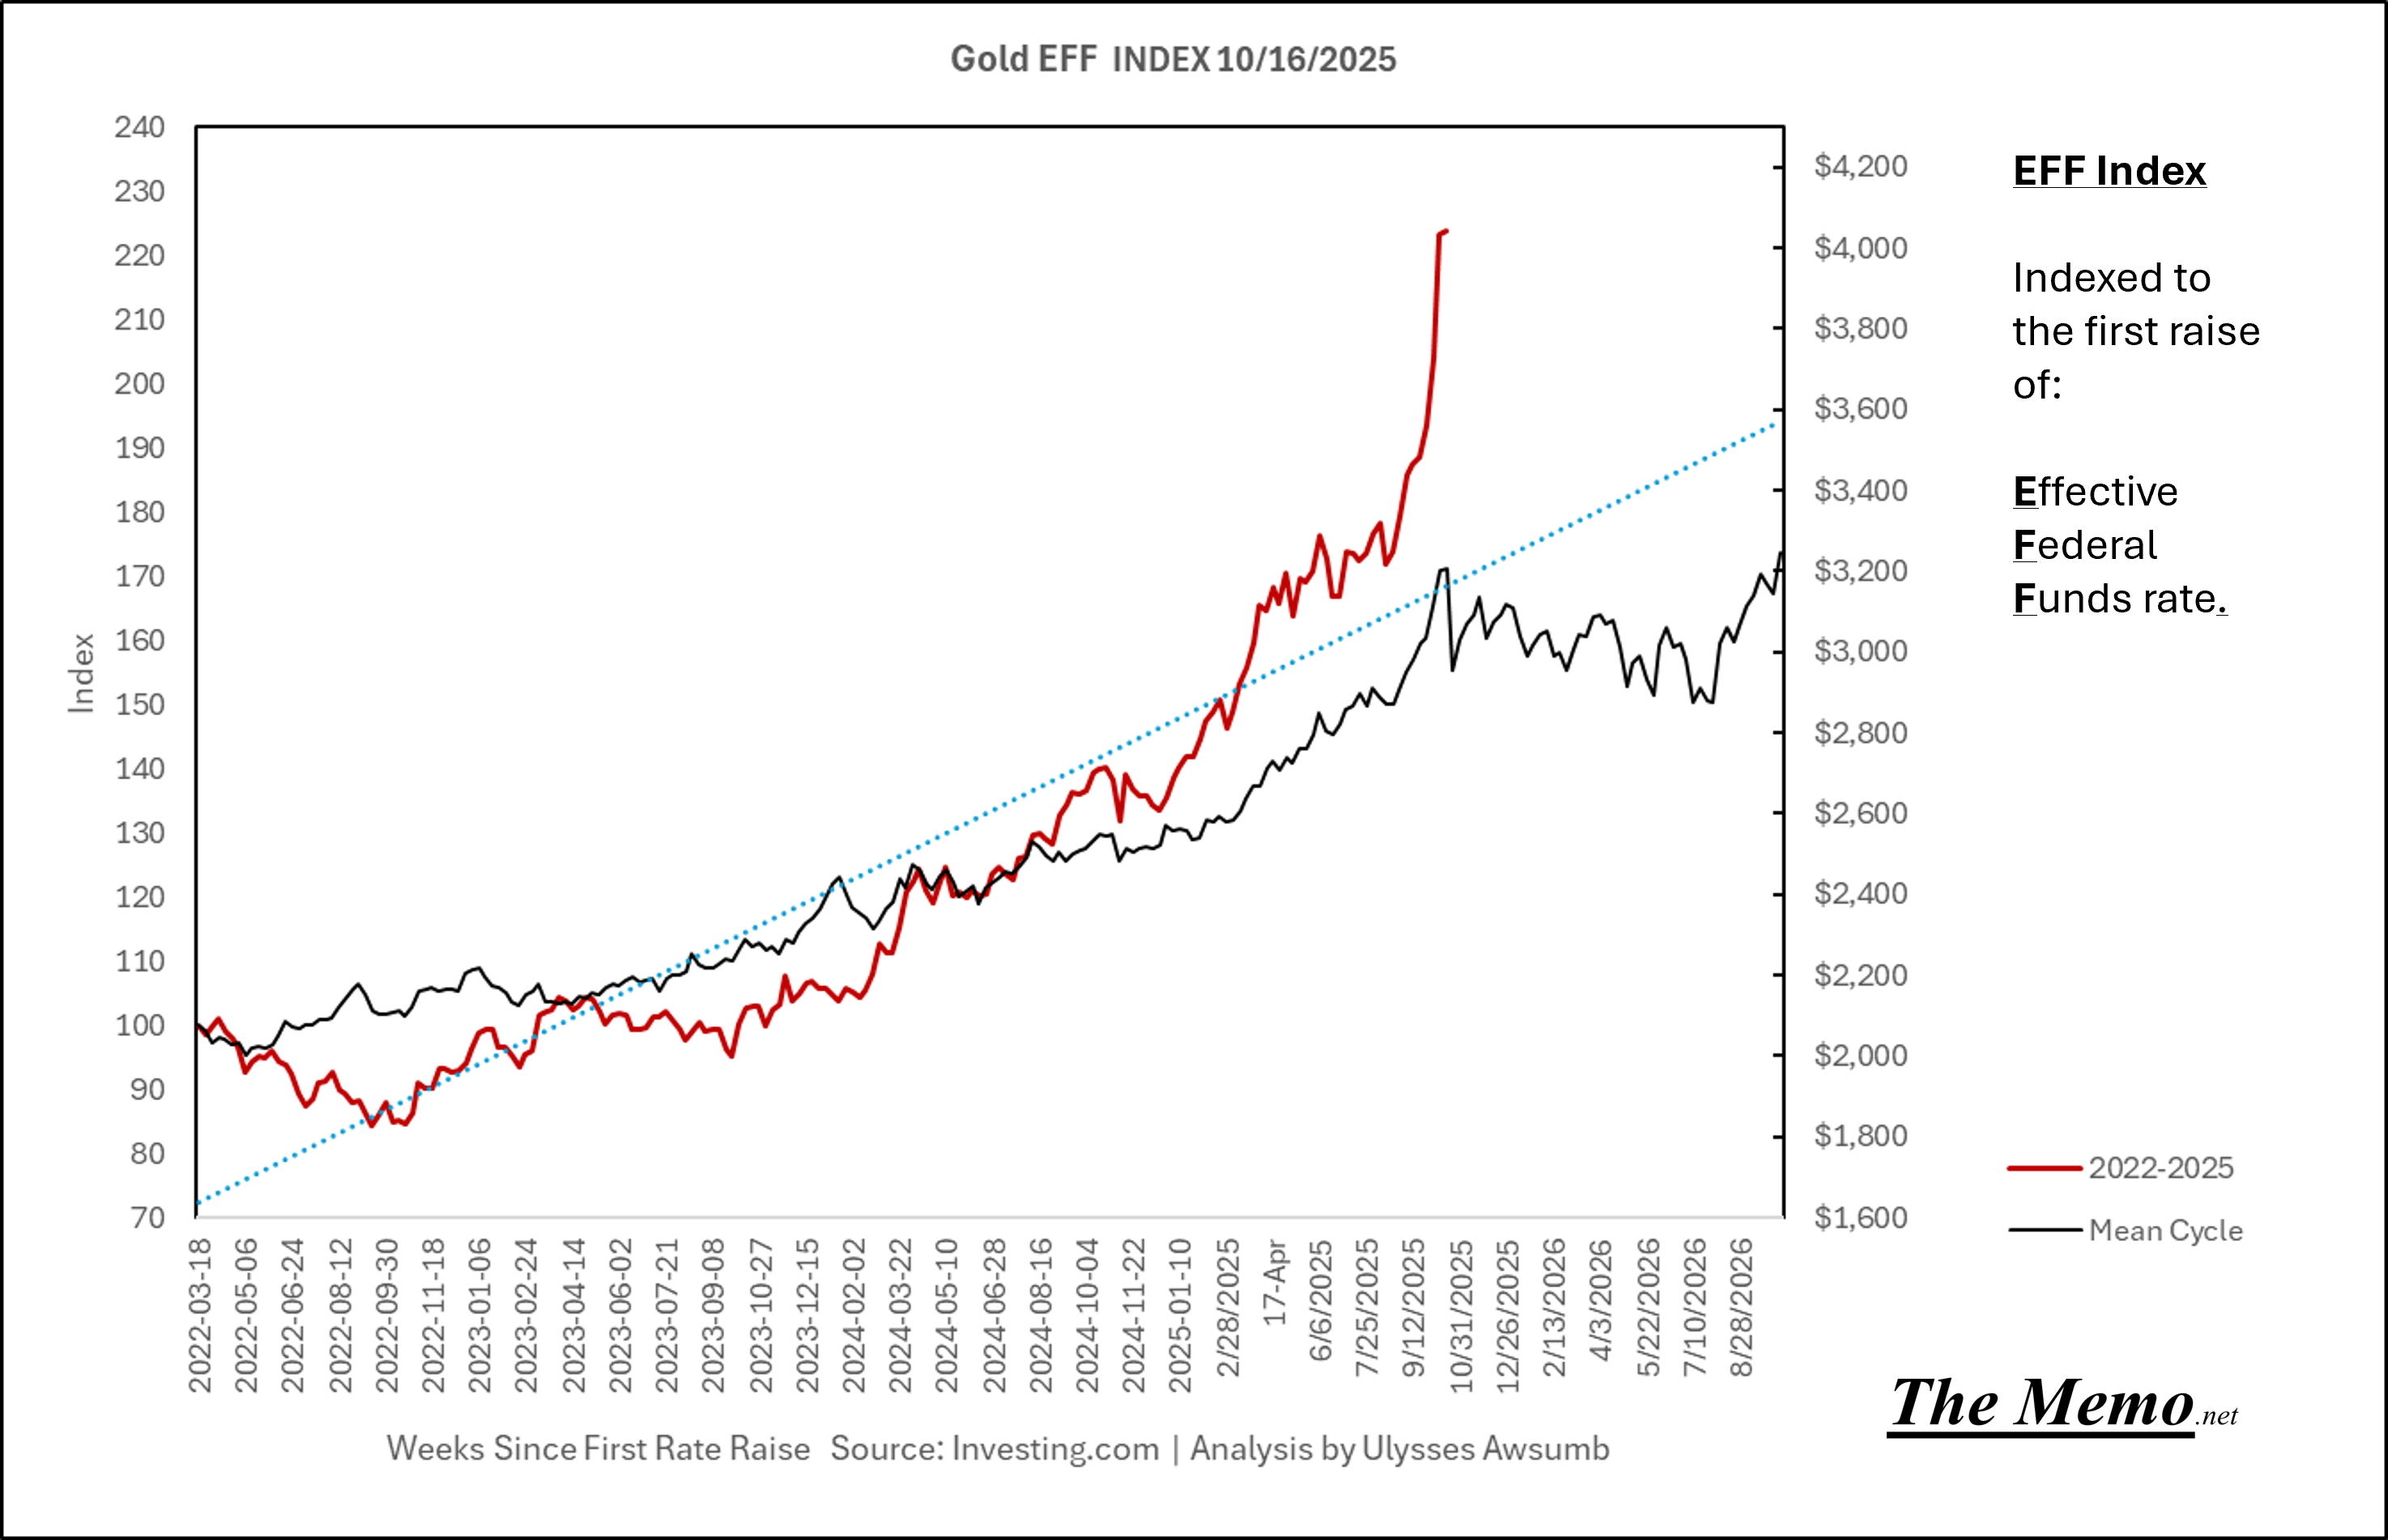
But never lose that Goldfinger entirely.
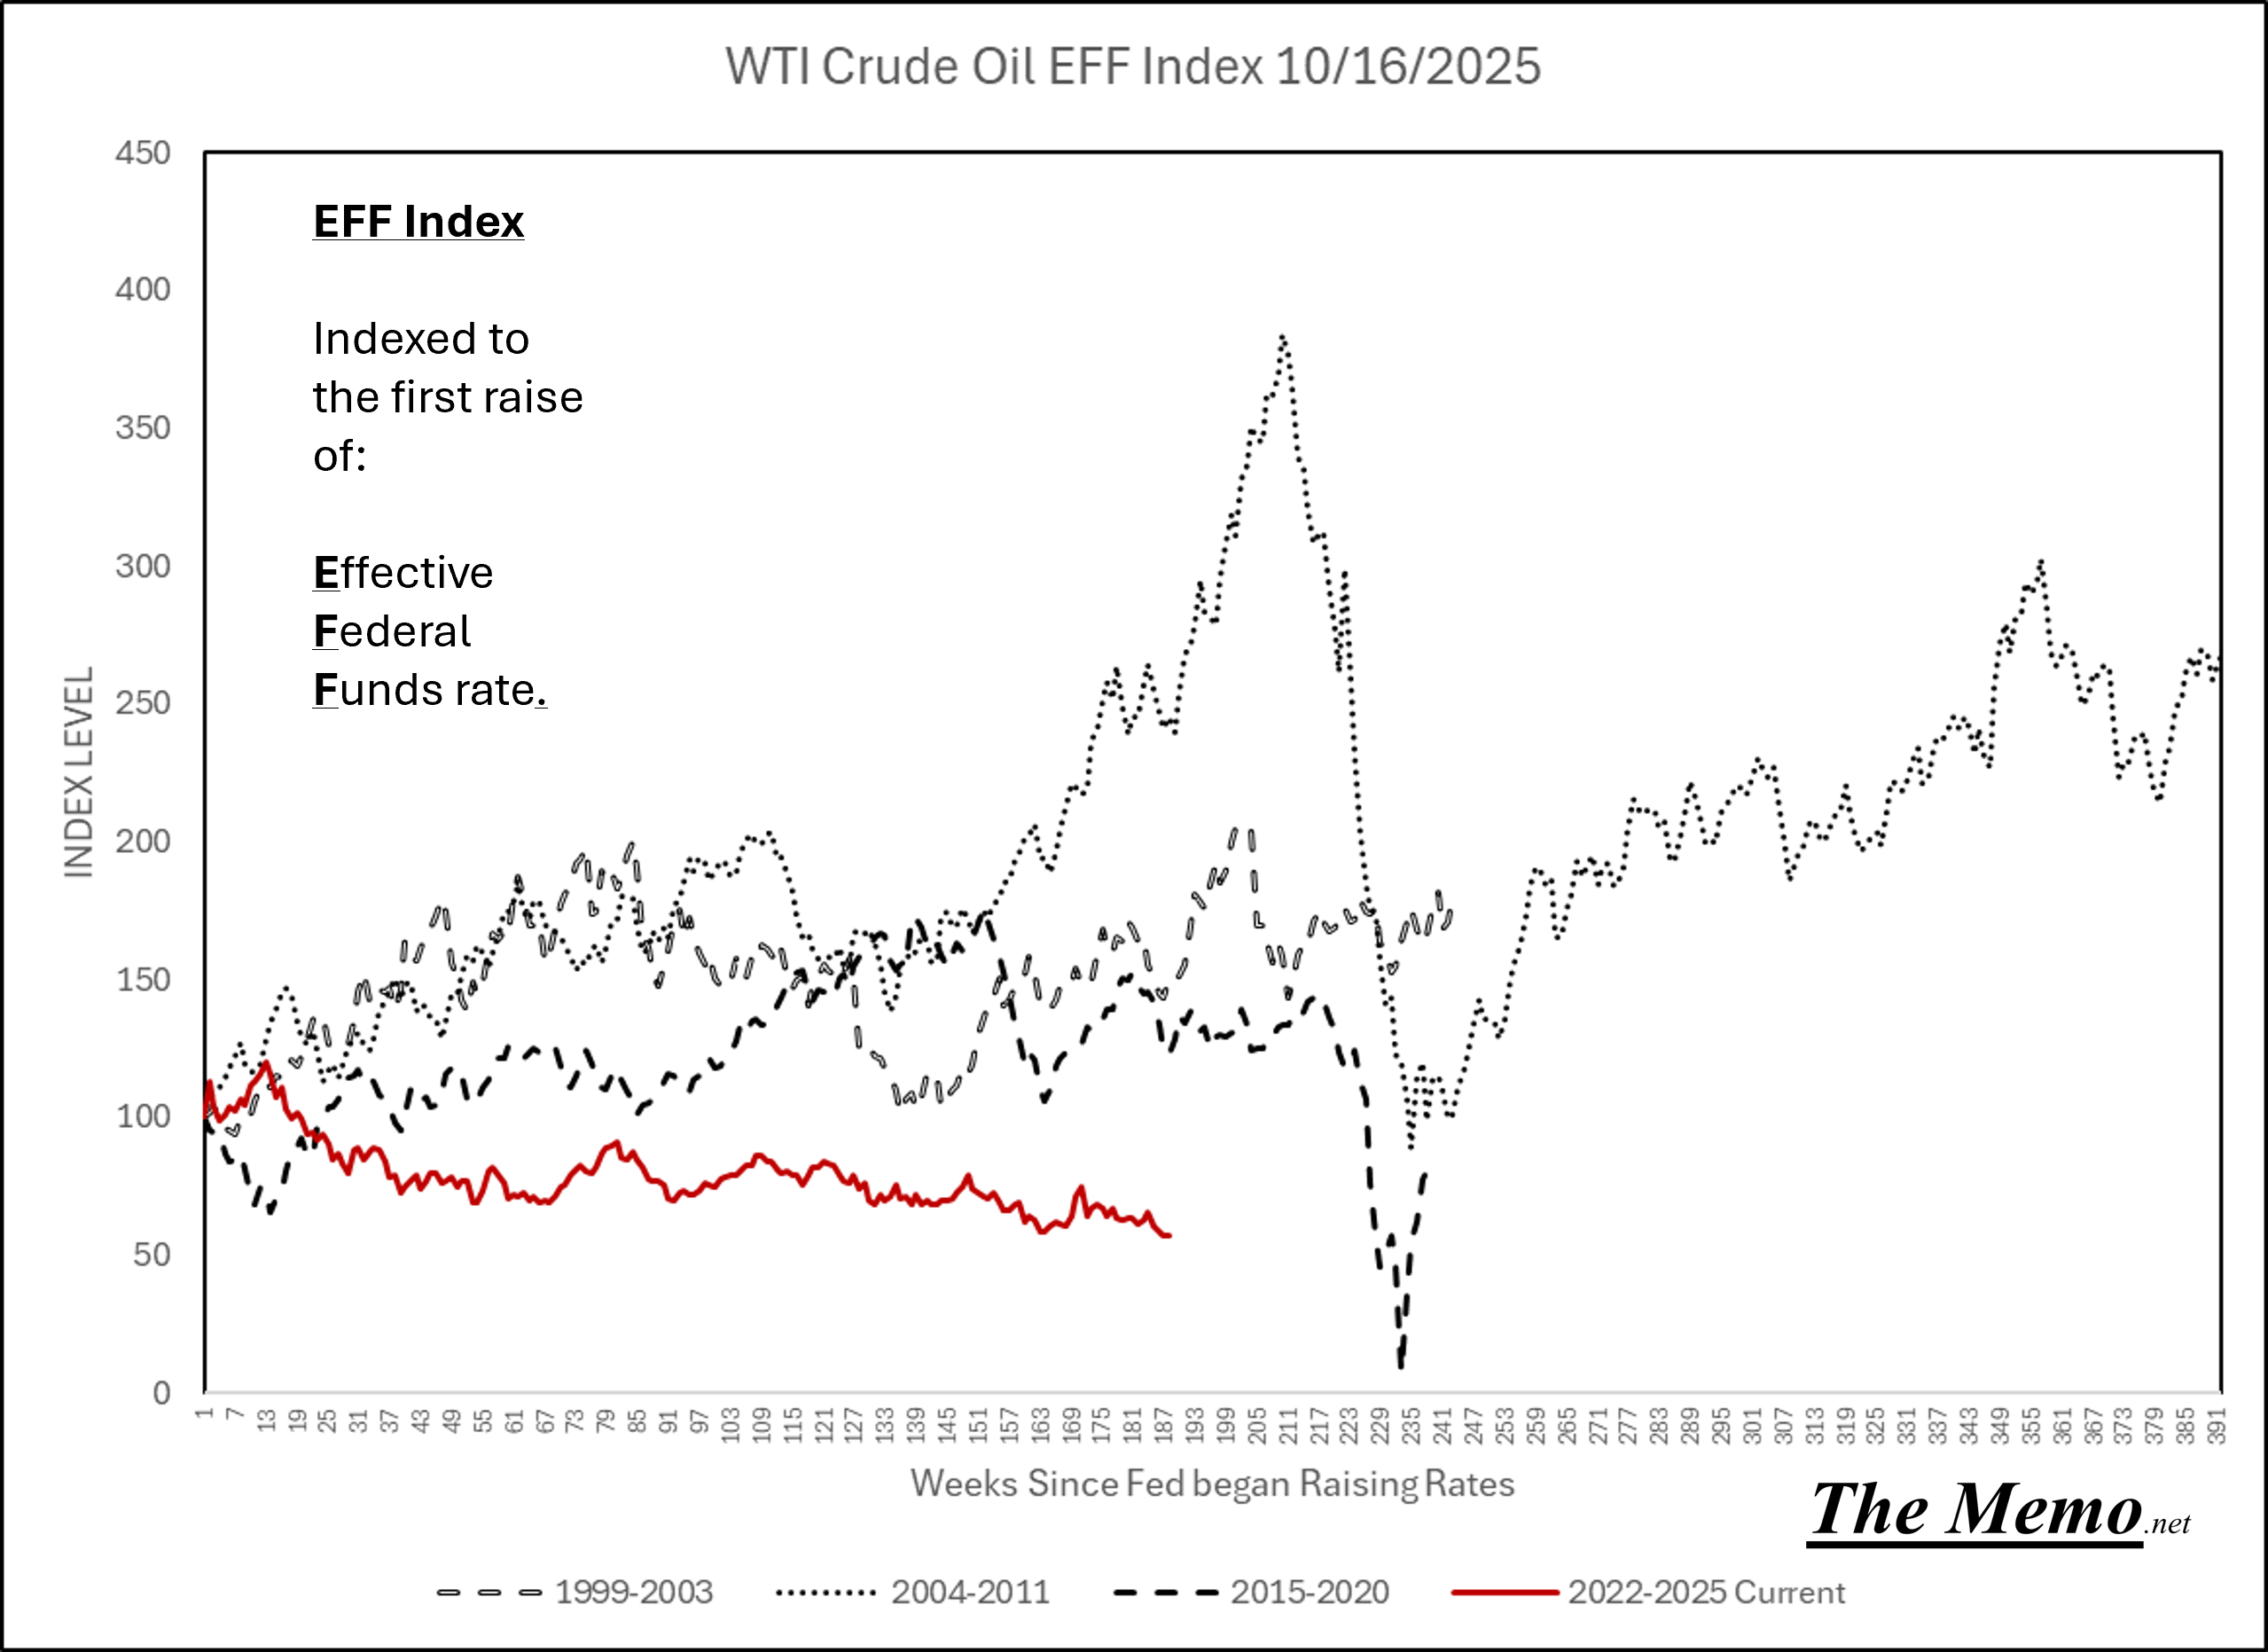
Just plain Rude
West Texas Intermediate Crude futures continue to drop. None of the expected bounces have been remotely “bouncy”.
Keep Calm and Chive On
Remember, we’ve been here 15 times before. And in even worse situations.
The bright side to the construction data, is that right now, despite the decline in units, and the price contraction ongoing (NAHB reported today, 6% declines) right now is actually a fantastic time for actual innovation, ingenuity and quality of service/craft.
3 Years ago, builders “would hire any contractor”. Today, builders are still saying “we’ll hire any contractor”. Wait….wut? 3 Years ago, nearly anyone who said “I’m a contractor” was offered work (shortage this, shortage that, EFF it all). Today, nearly anyone who offers a way to help ameliorate the cost, and consistency of product delivery, has an open door, open phone line and open invitation to land an opportunity. (“nearly anyone” meaning contractors)
You just have to walk the line. But that’s why you keep your eyes wide open all the time.
THE TACO TRADE
Ok, on one hand, Jack in the Box just lost $460,000,000.00 (Four Hundred Sixty Million and 00/100 Dollars)

On the other hand, a franchisee just bought the entire brand and 550 stores for $0.20 (twenty cents) on the dollar. (were you expecting a different topic?)
That’s $209,000 and change per store. All they need to do is net $41,818 per store (Forty Eight Thousand Eight Hundred Eighteen dollars) per store, to have a themselves a 5 year payback. In CAP rate terms, they just snagged a 20% CAP rate on 550 taco stores.
If they really wanted to stretch, they need to make $52,000 to have a 4 year (25% CAP rate) payback.
Granted they’ll be closing some non performing stores, but a Net return of $41k per store over 4 years, is a pretty low bar to make this one hell of a Taco trade. I doth tip my cap to Yadav Enterprises.
Go find your TACO trade. Offer what you want. From Franchisee to Lock Stock and Two Smoking Barrels.
Relatedly, if you’ve never slept on the side of Pacific Coast Highway 1 next to the Pacific Ocean, waking from the waves and sunshine, only to then venture from Malibu down to Venice for a breakfast Del Taco, you’re missing out on some Americana.
TACO trade FTW.
Today in EFFing Time
Today is October 17th, 2025 Anno Domini (though I’d understand if you thought otherwise for multiple reasons)
Other current days in past times:
July 12th 2019

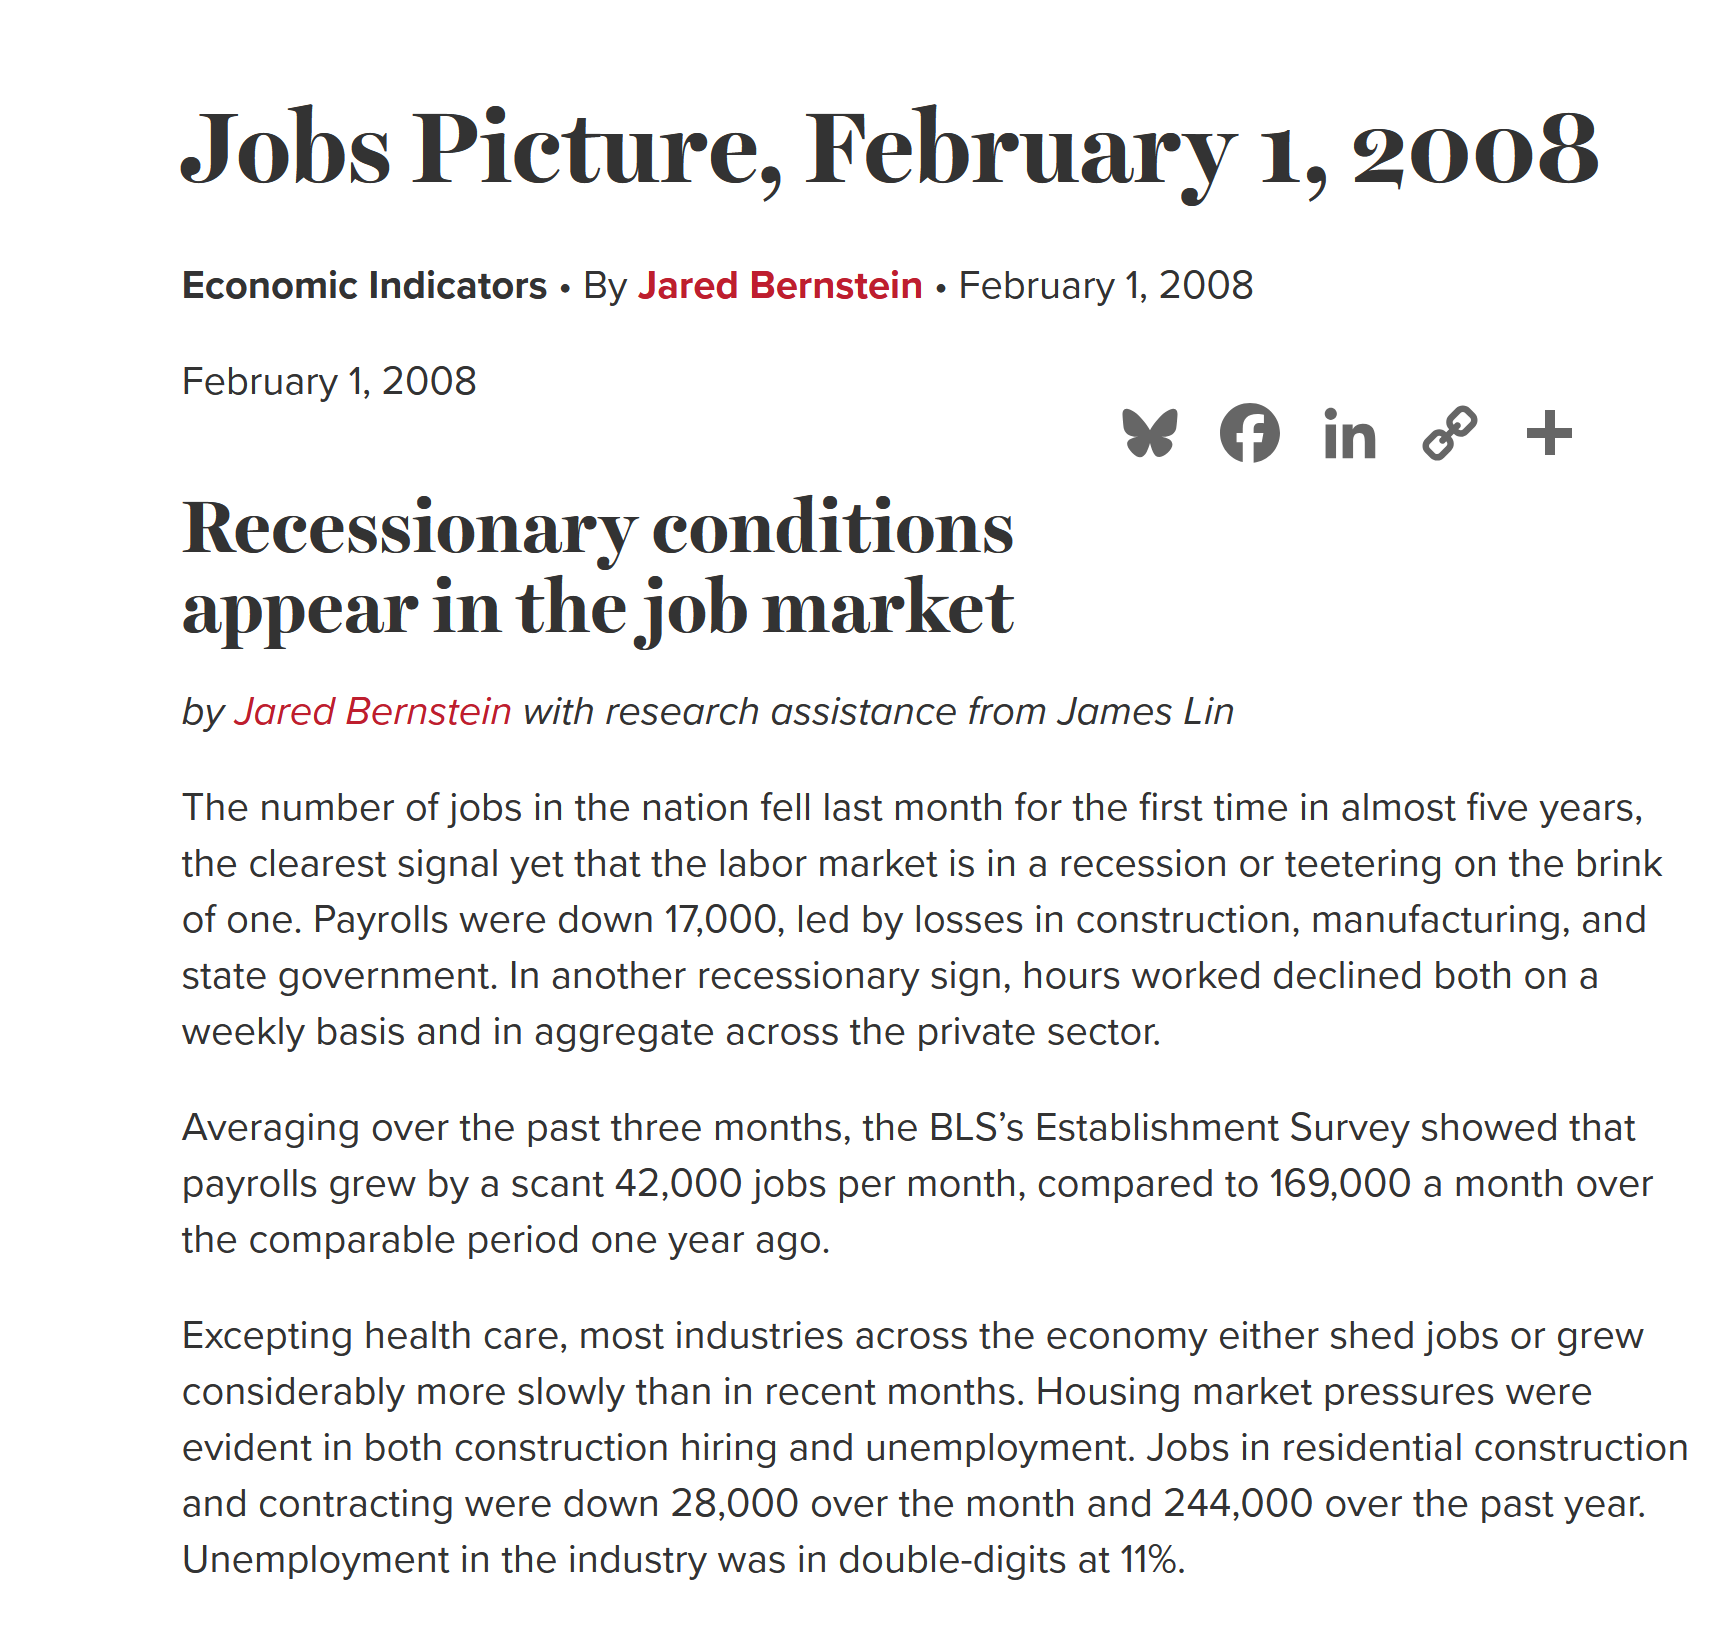
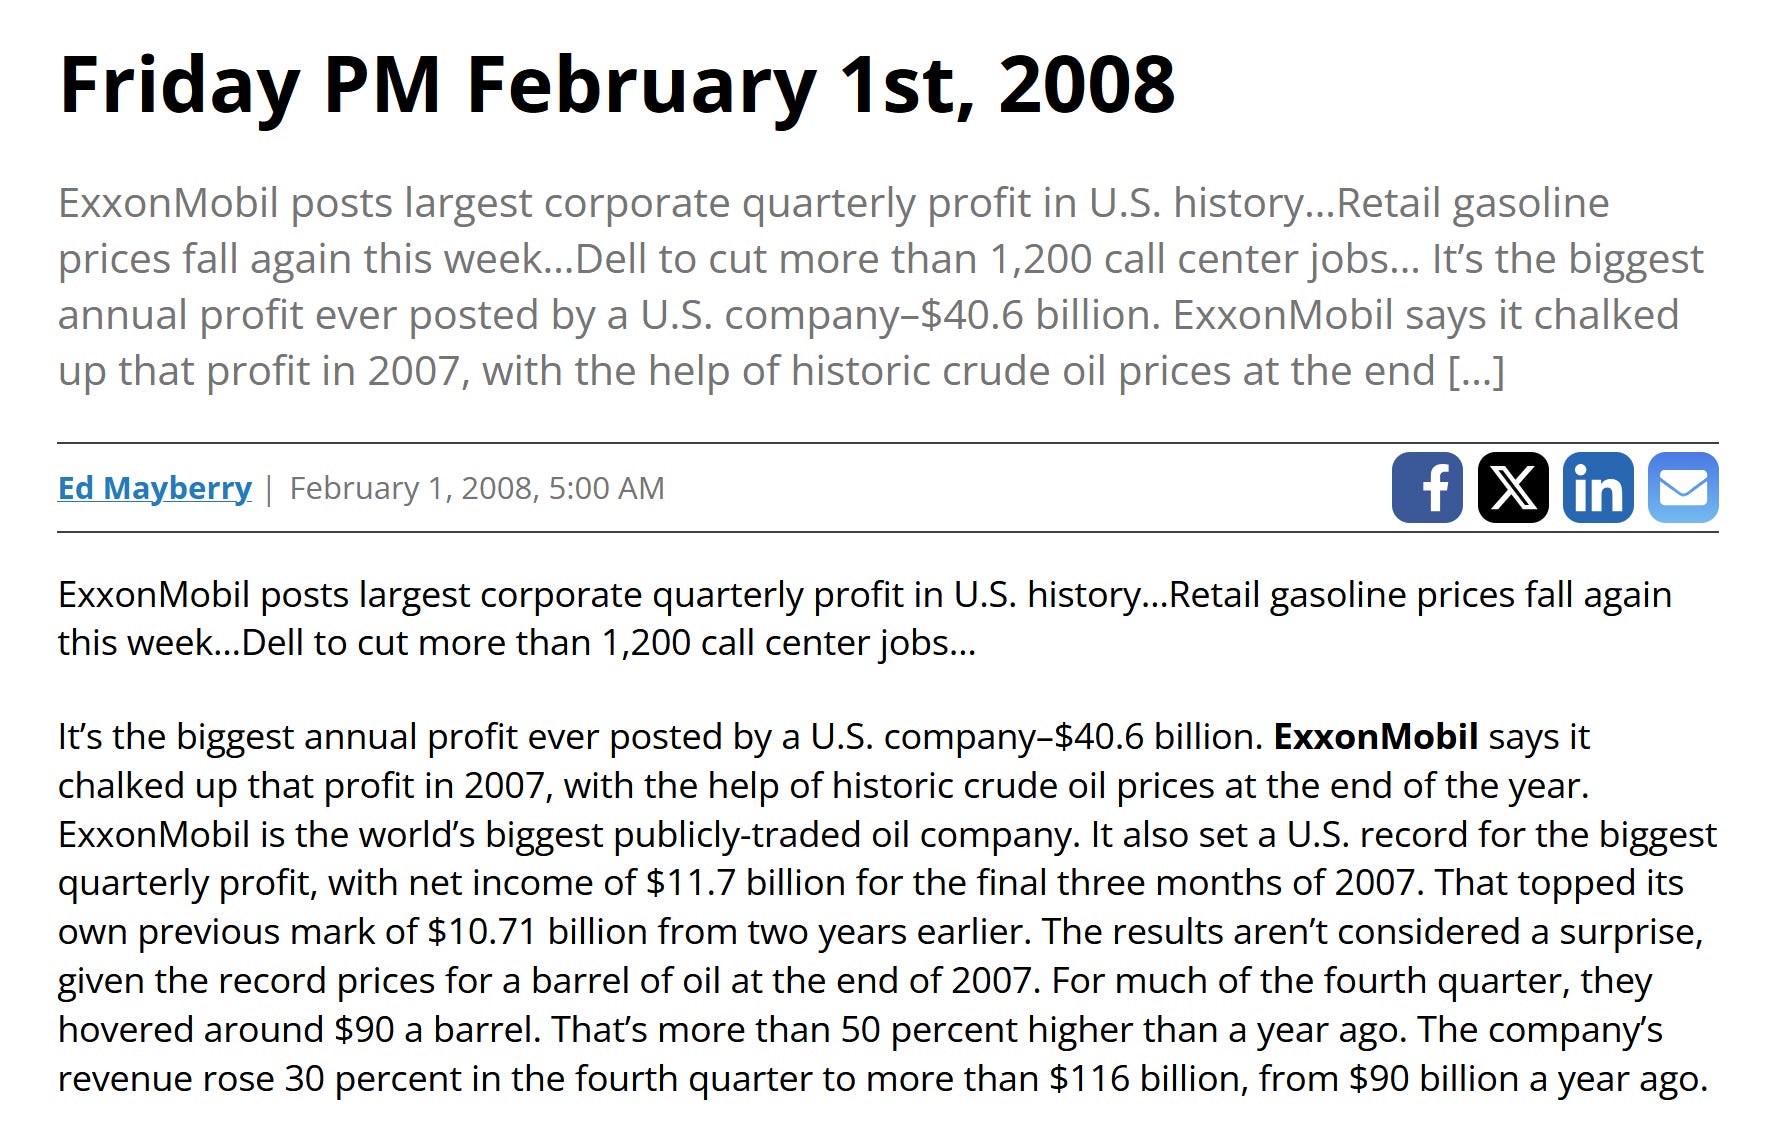
February 1 2008
August 8th 1996
April 20th 1990
Keep Calm and Chive On. No matter what.
None of this is investment, financial, or business advice. It’s for entertainment and hopefully educational purposes.
15y Nikkei overlay 🤔