

Friday EFFing Memo
Memo RE of Earnings


The Memo
To:
The Team
Re:
Realty, Real(i)tors, Reality, Real Income
Nasdaq
Employment
Yields
Playing Swiss
Comments:
“This is one time where television really fails to capture the true excitement of a large squirrel prediciting the wather. I, for one, am very greateful to have been here.
From Punxsutawney, this is Phill Connors. So Long”

End Memo.
Hey! Phil? Phil? Phil Connors! Is that you?
{Punches Ned in the face}
The Report
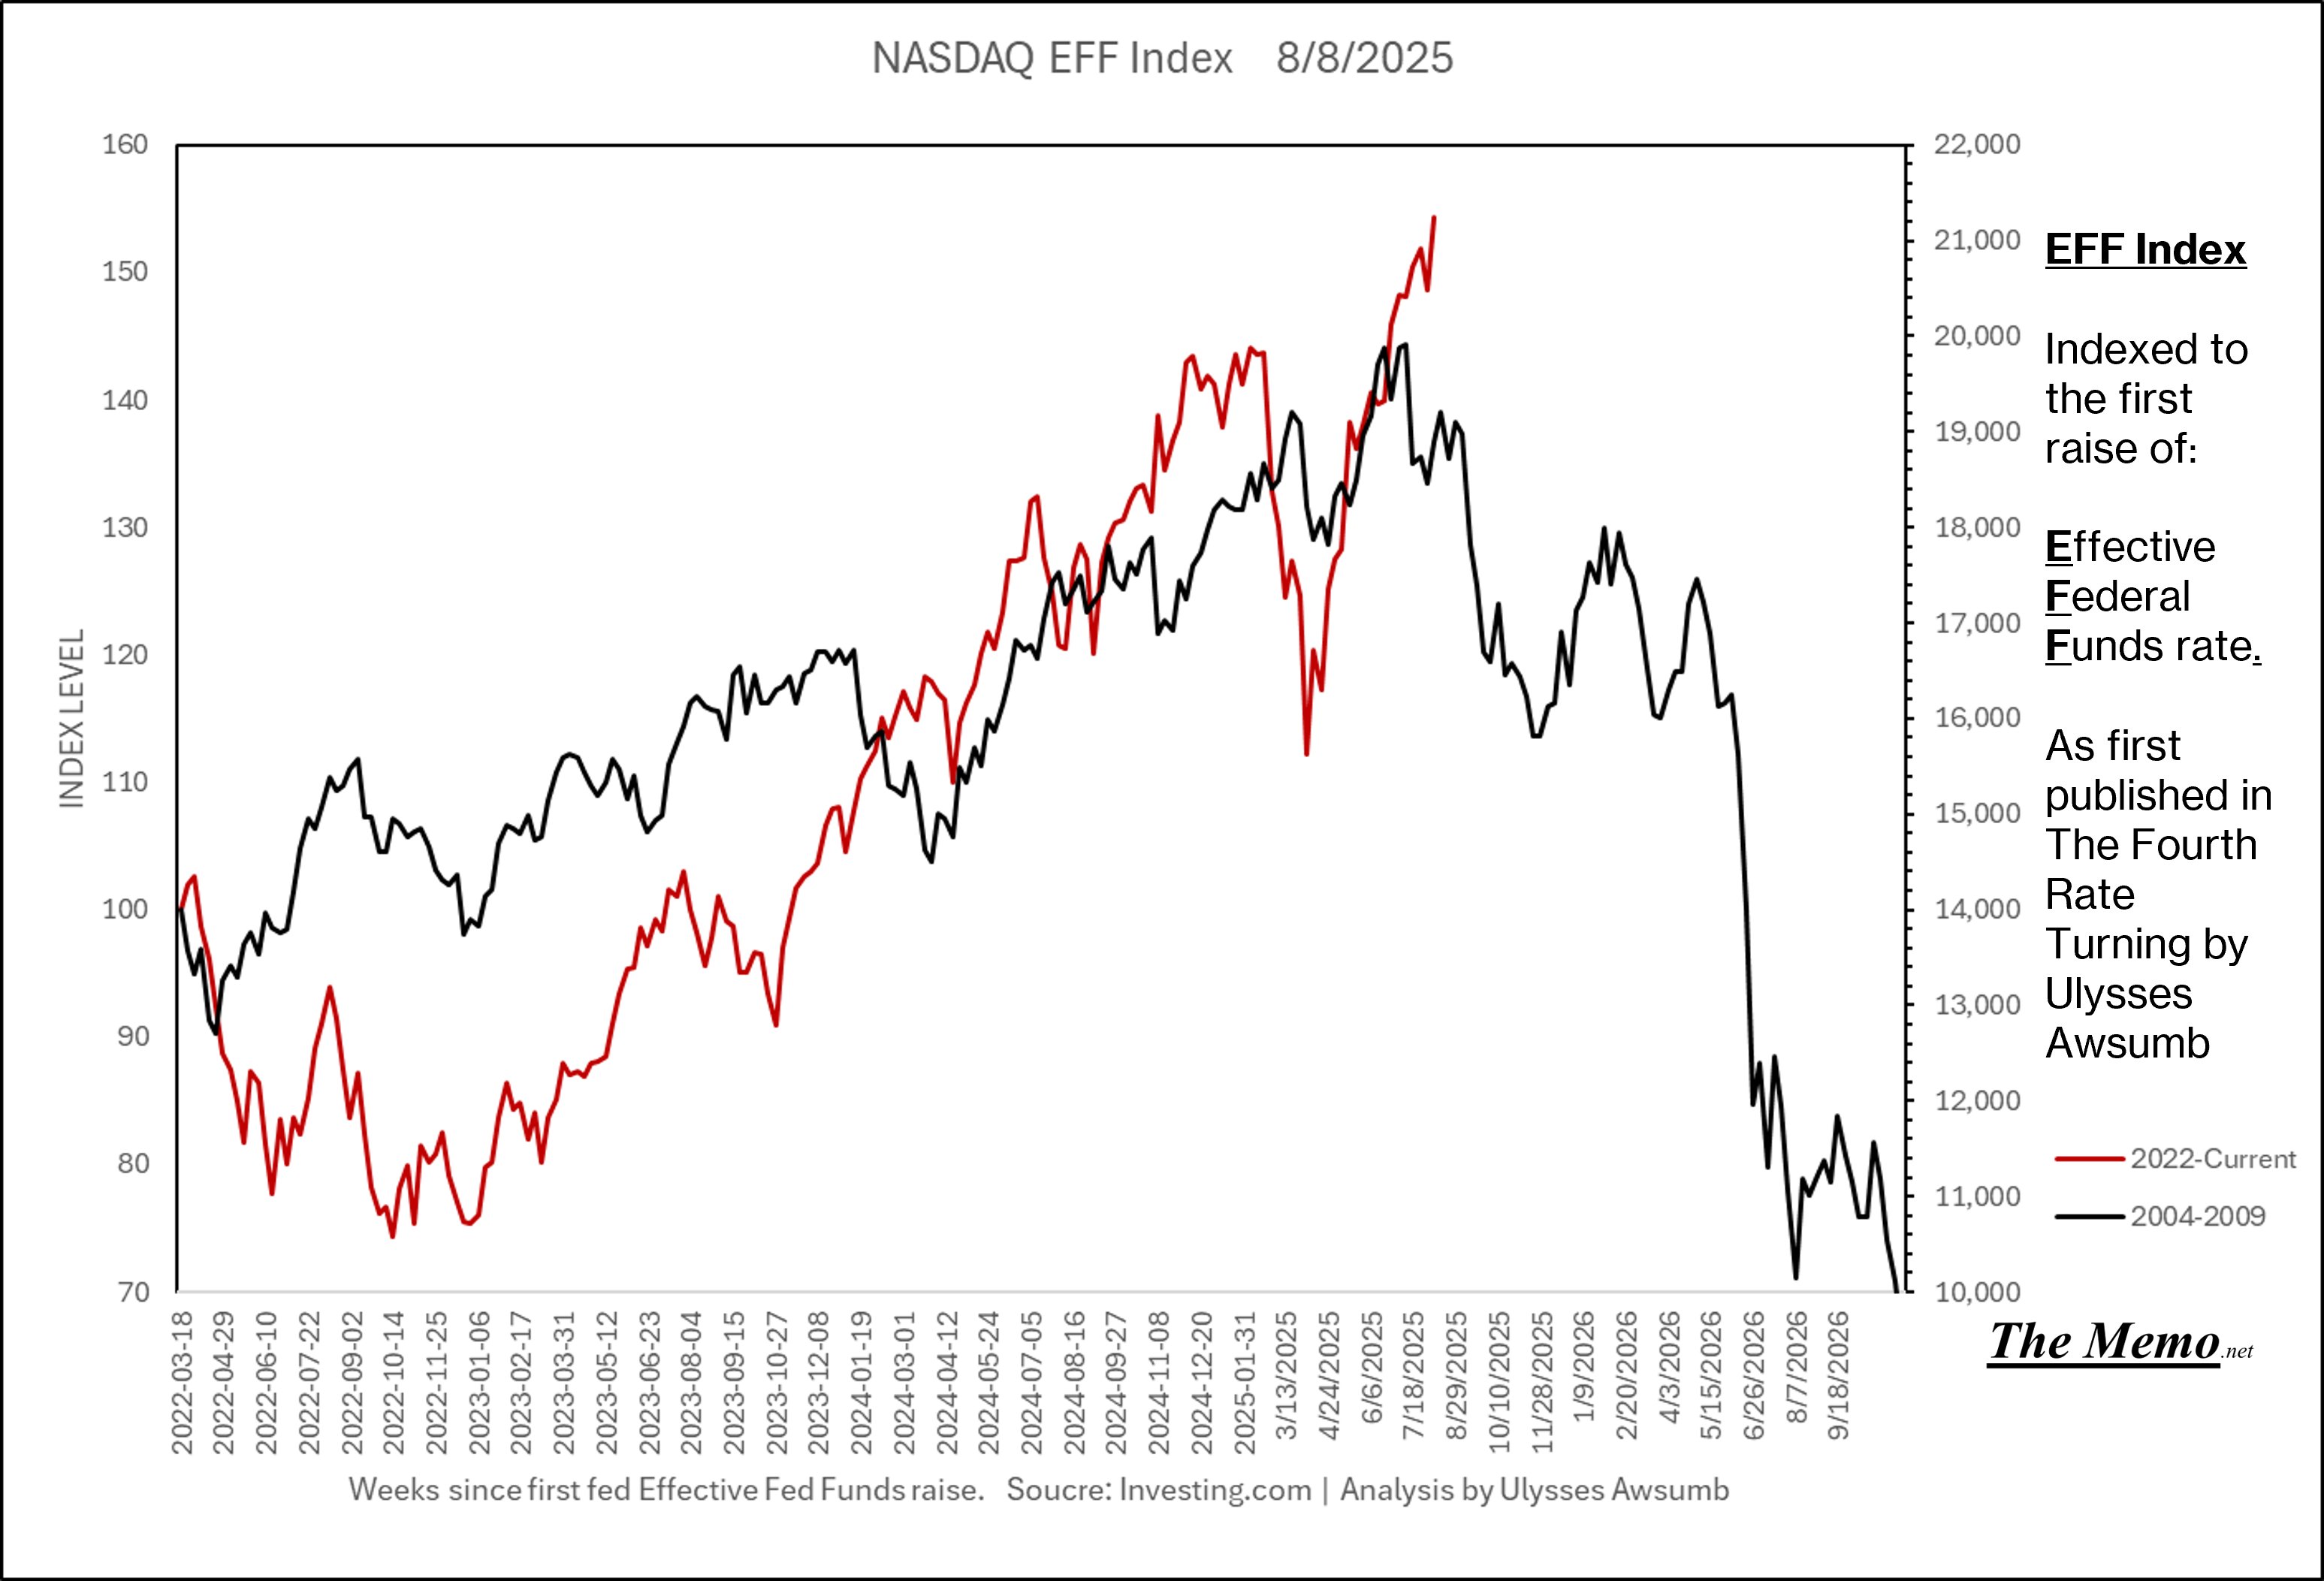
Equities
Bull this bear that. Not much happening here outside of the same script.
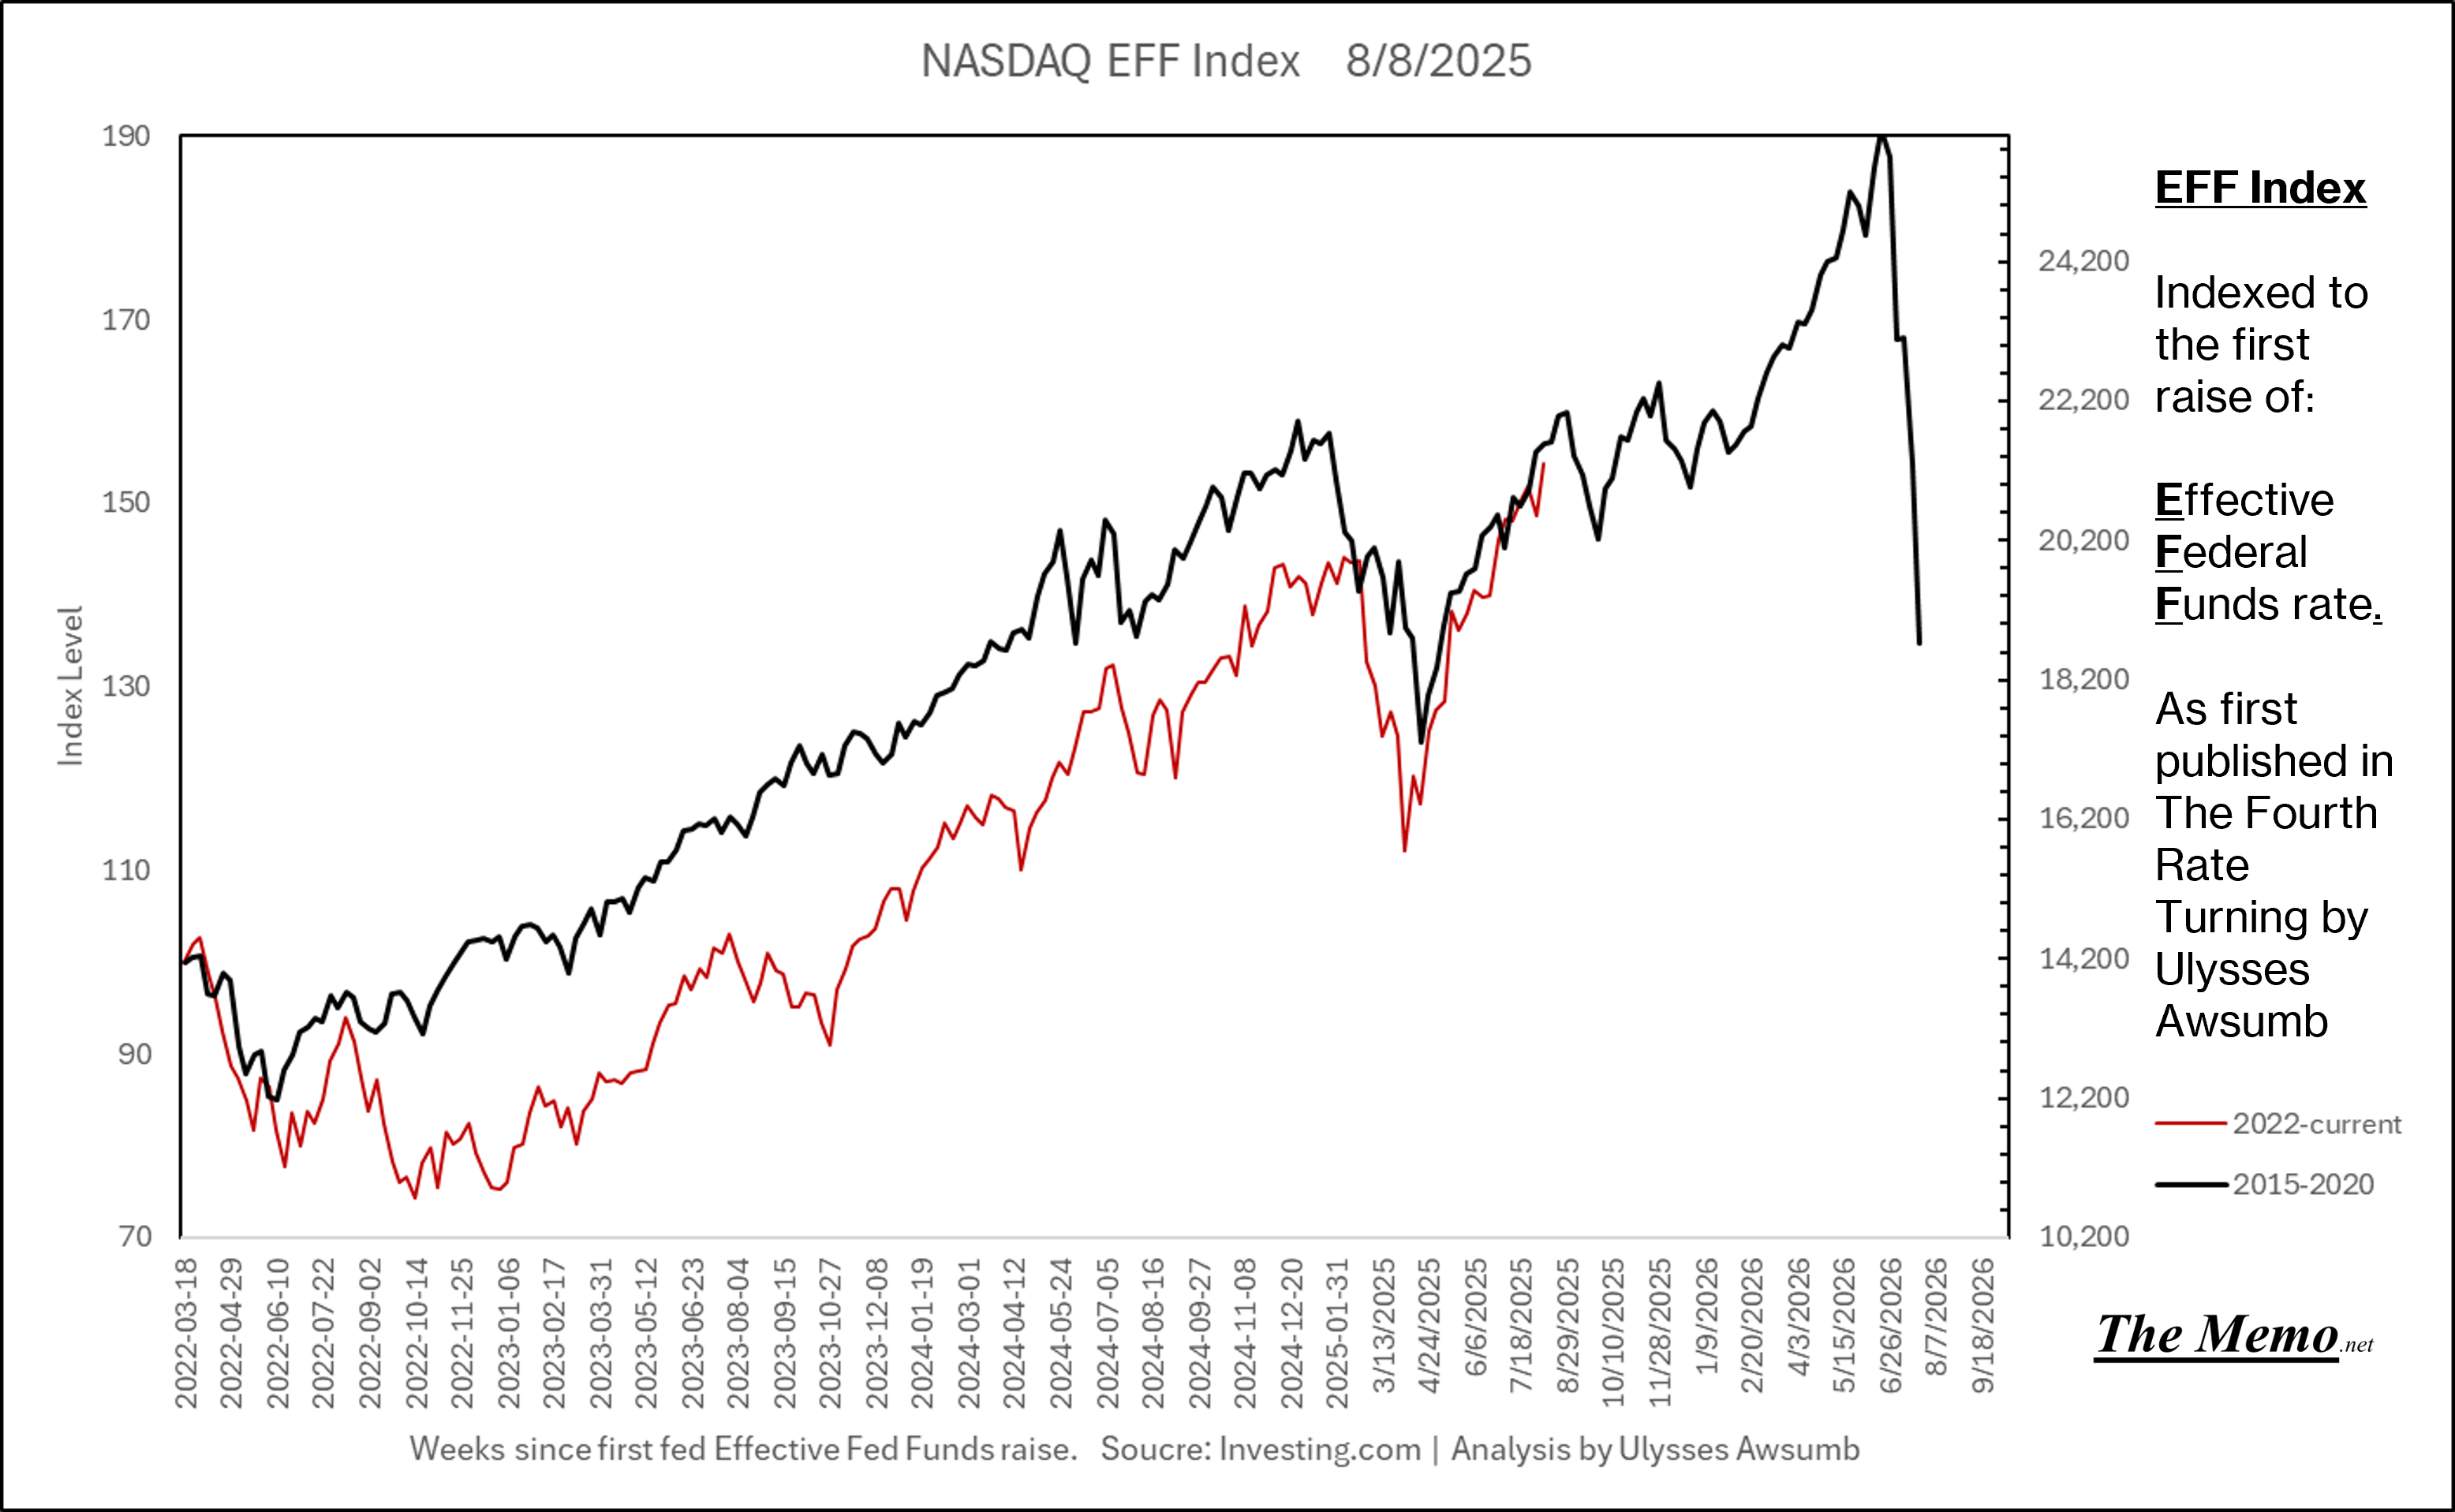
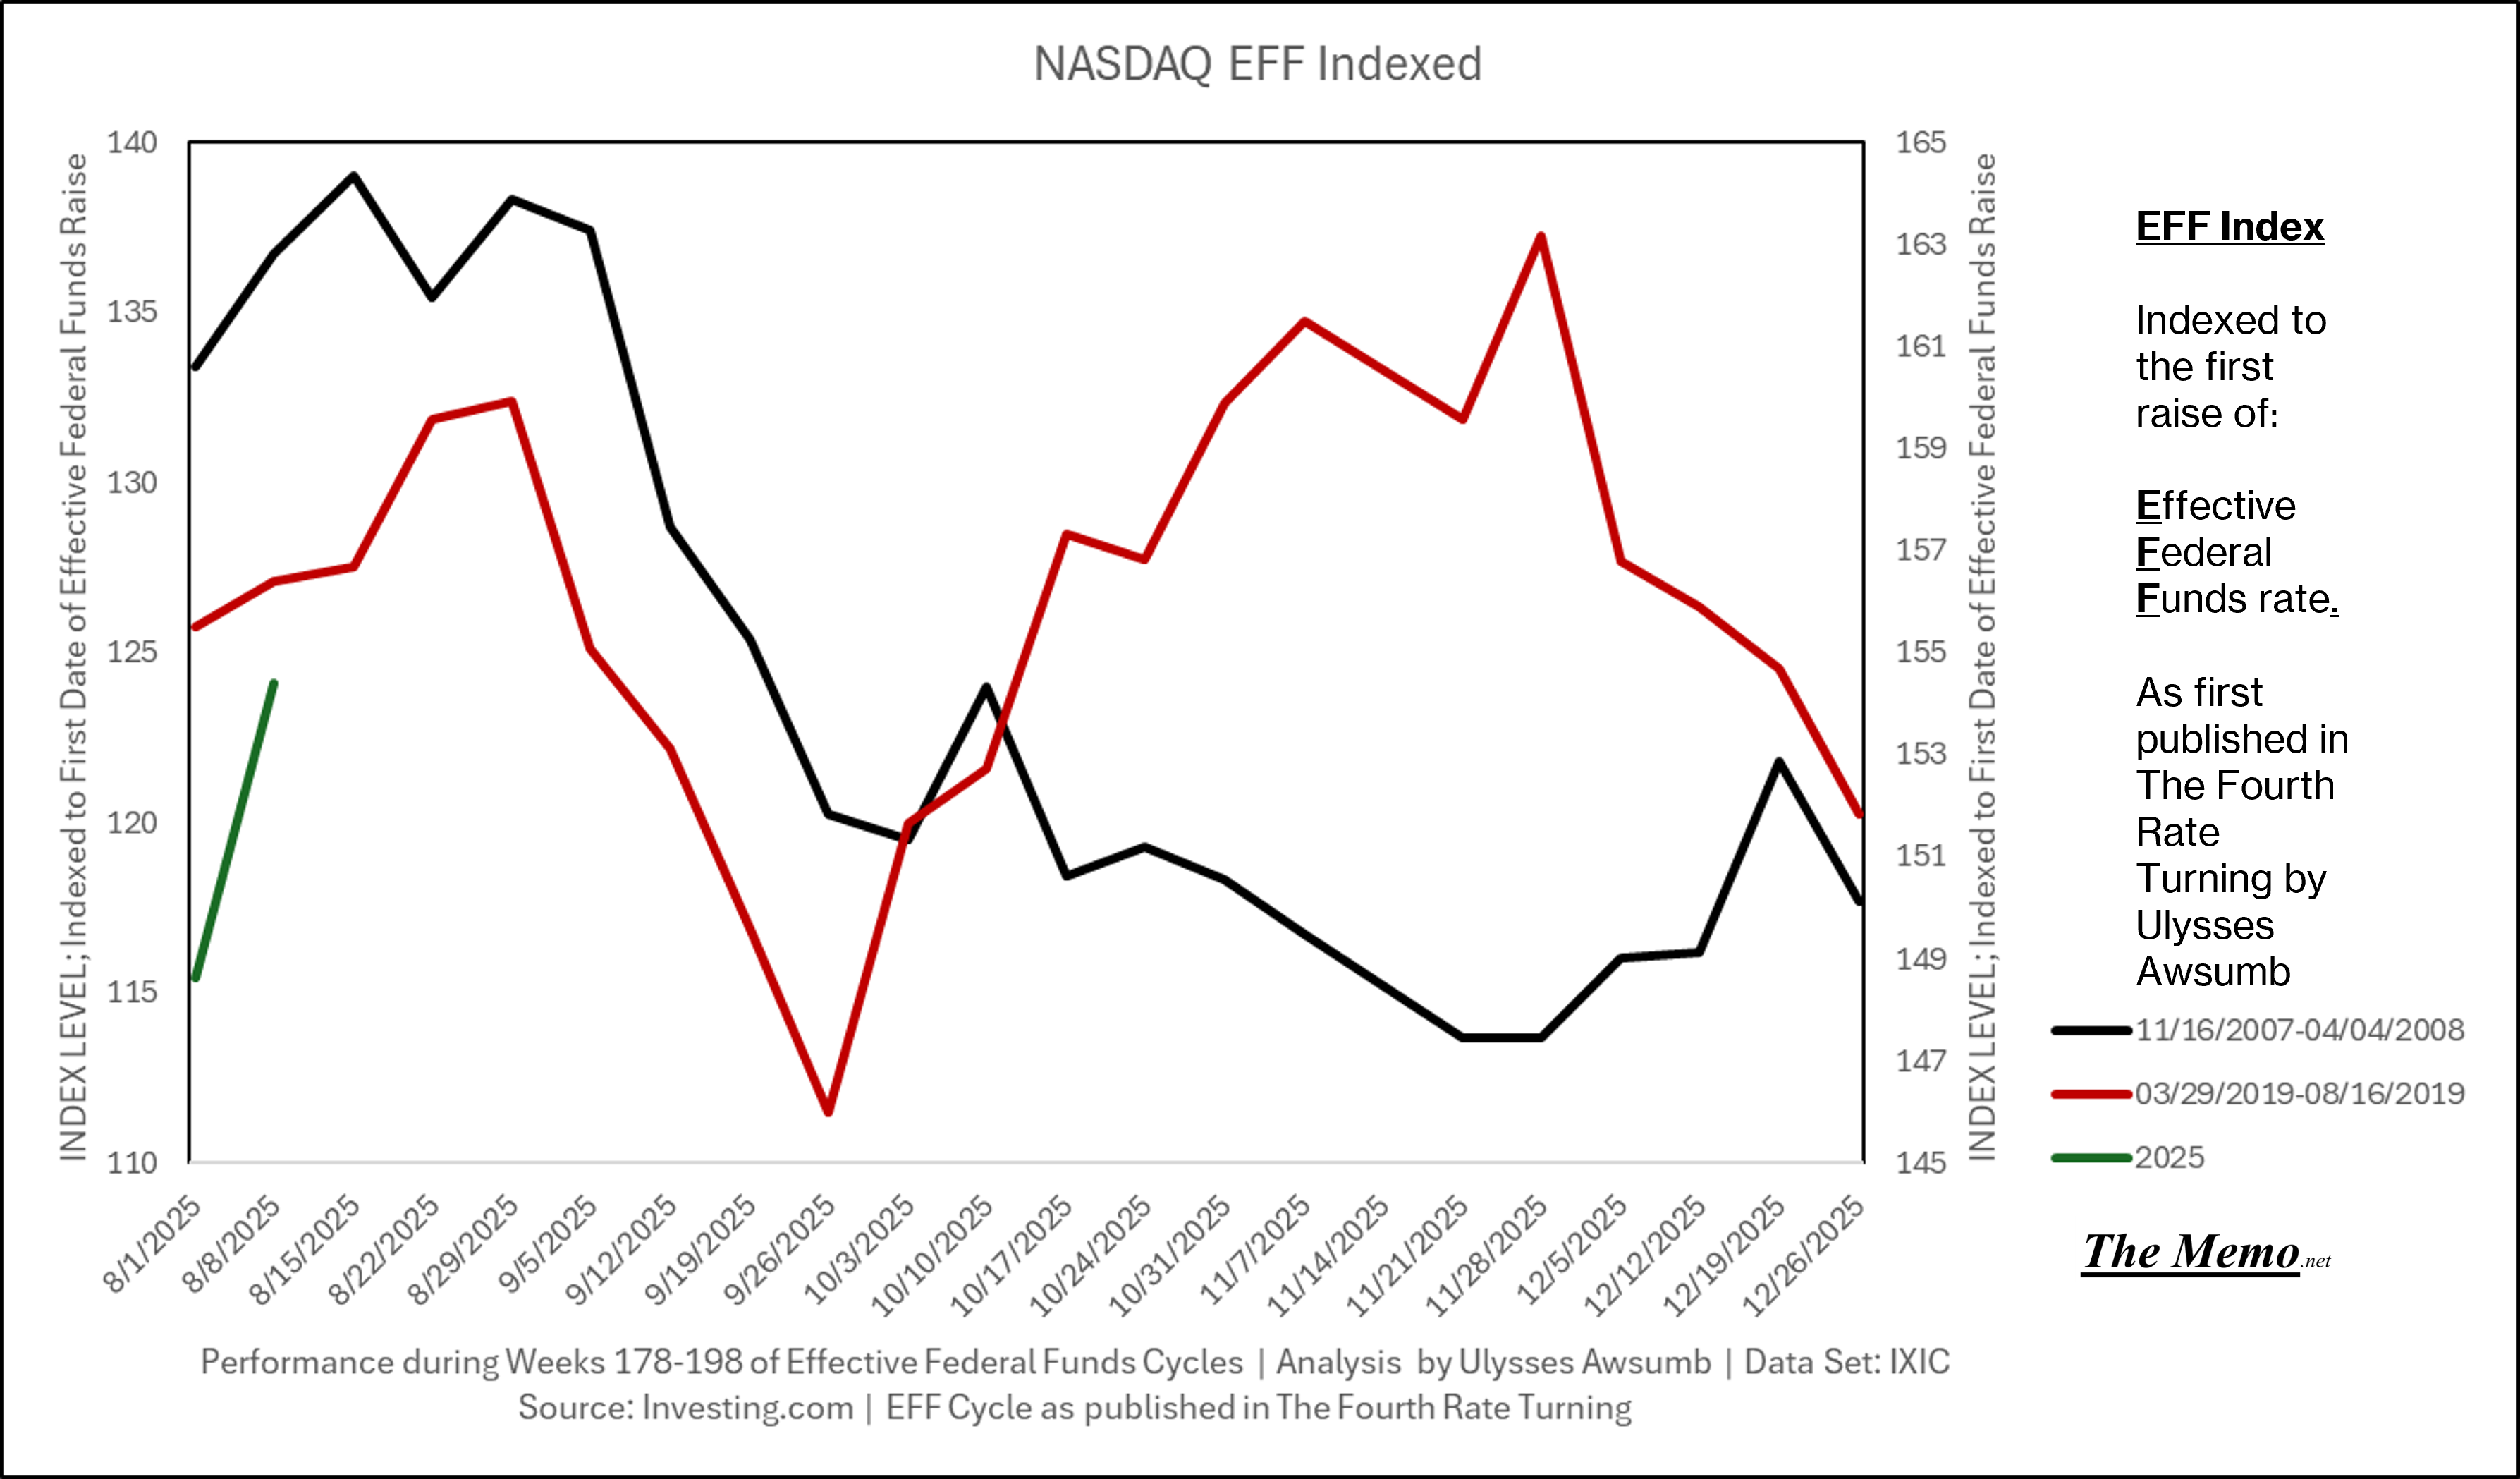
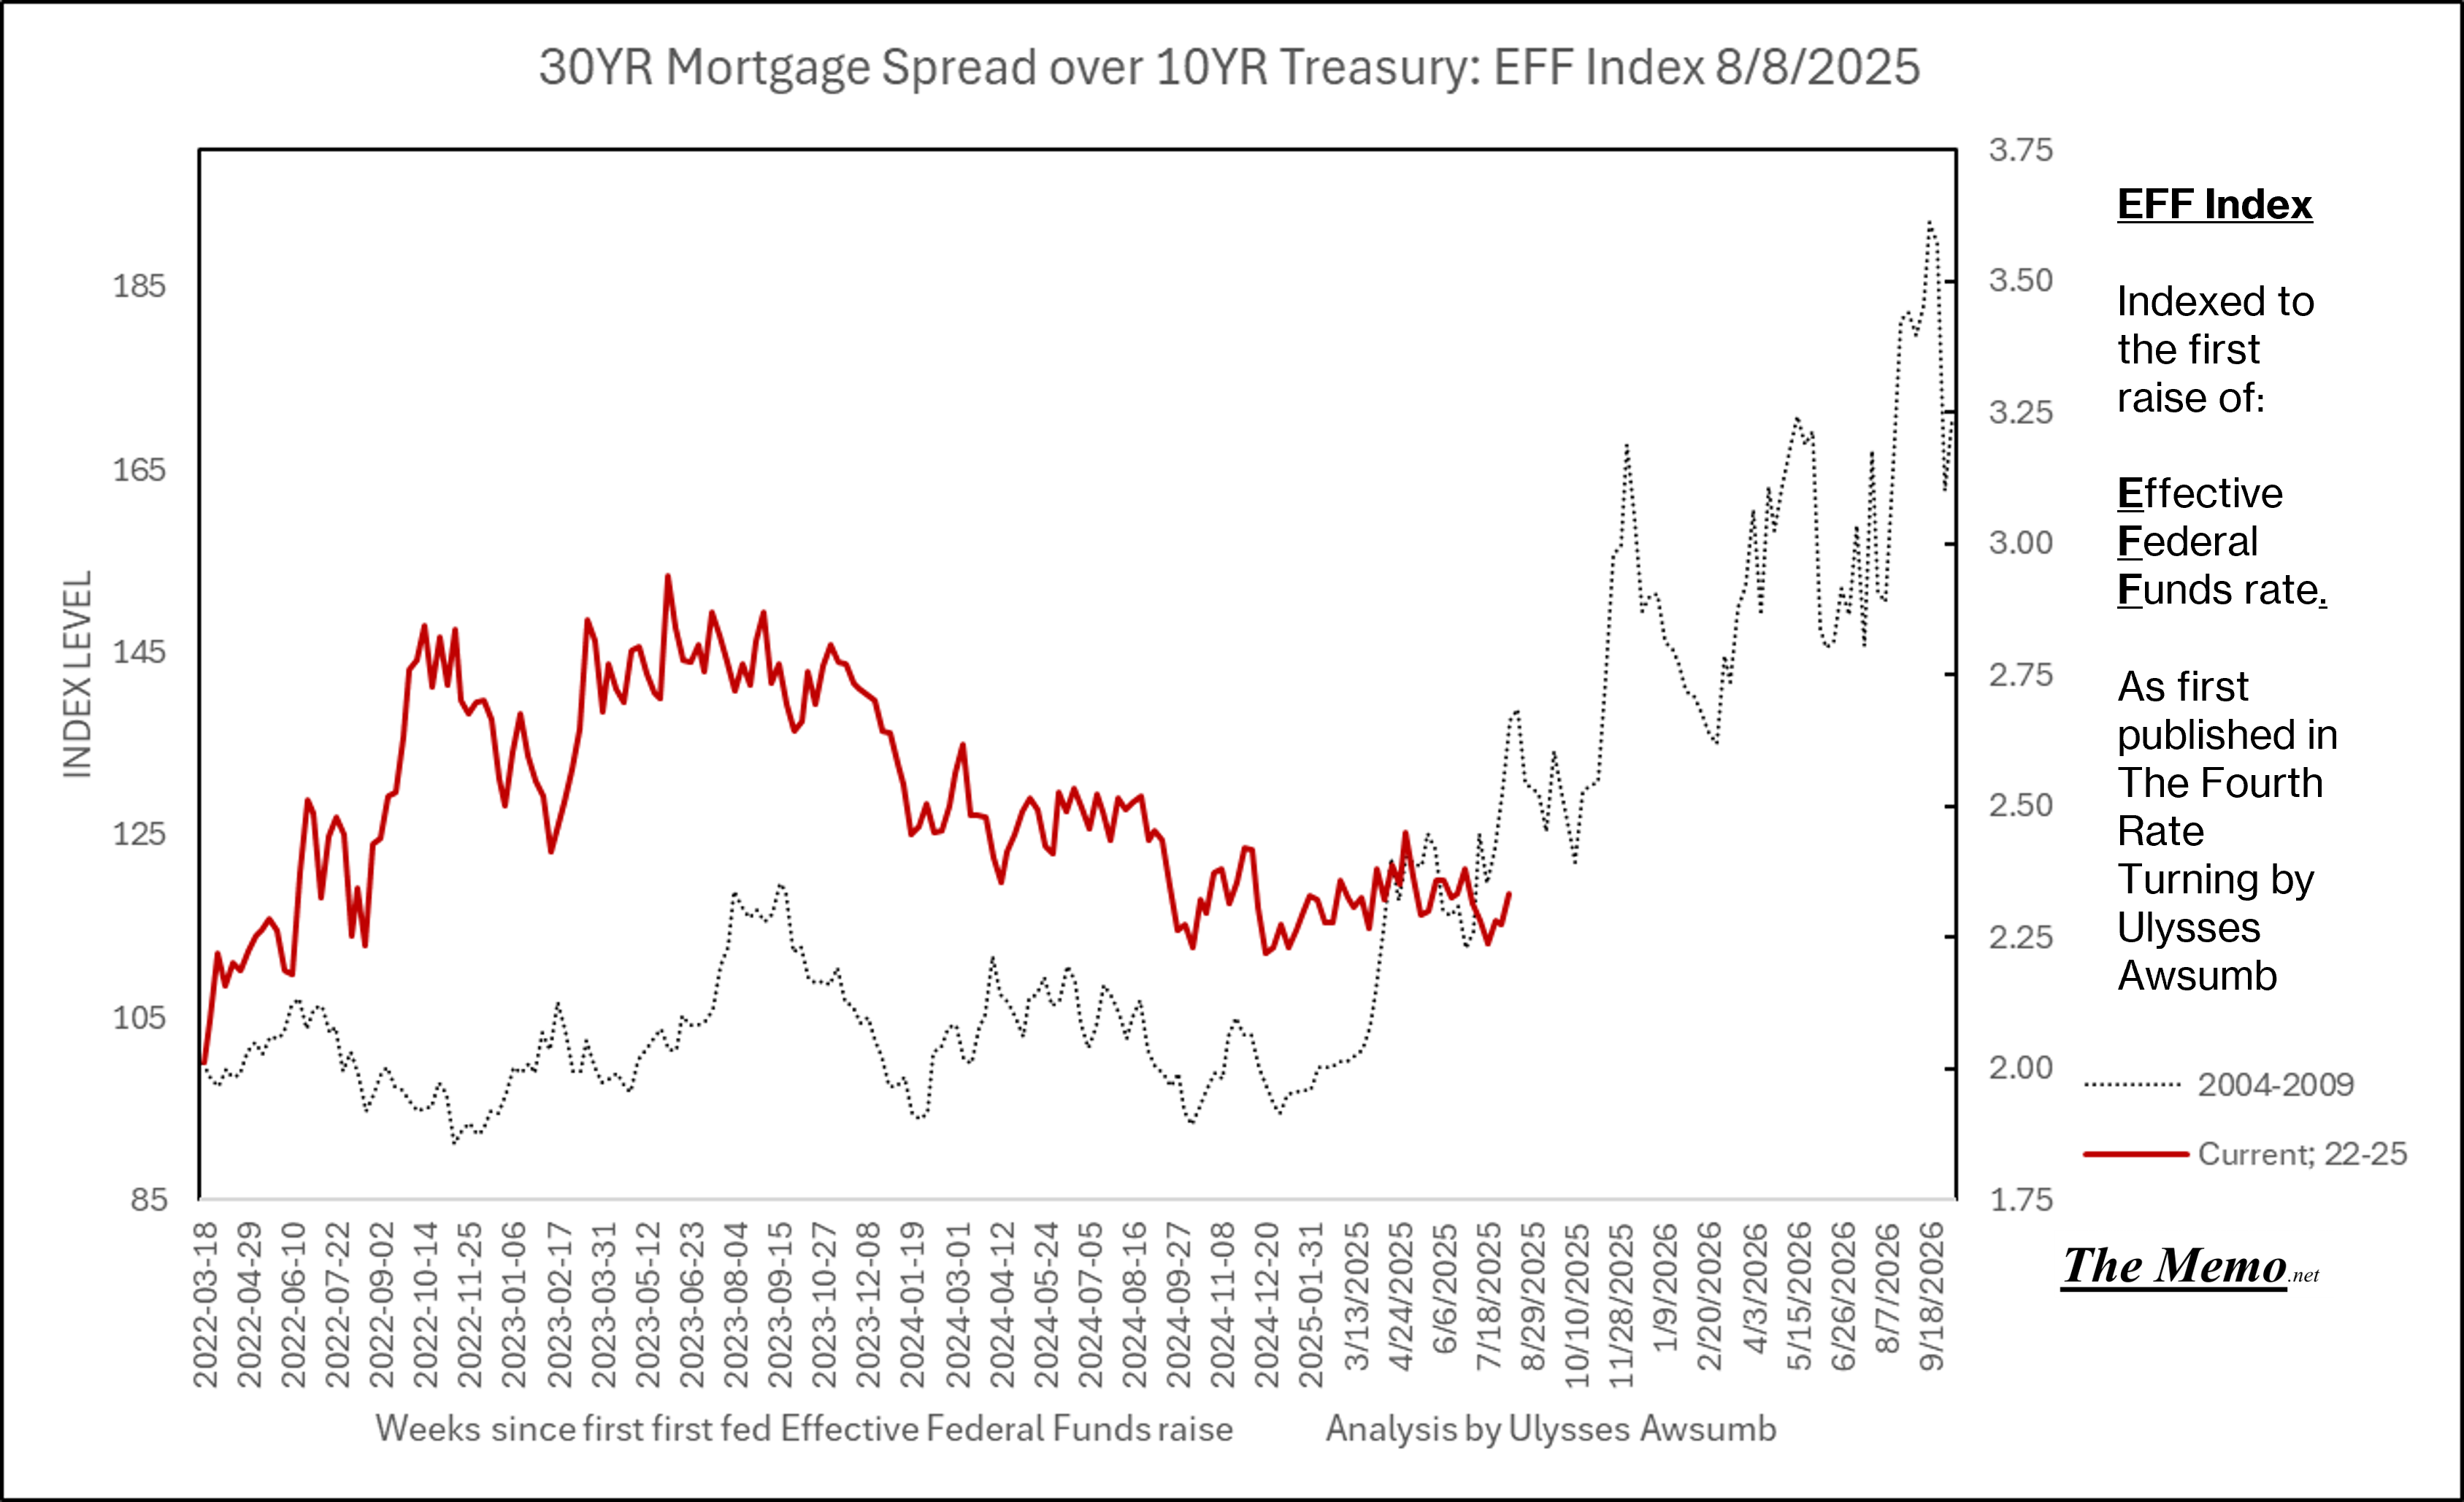
If you remember the last EFFing Memo, you’ll know this is the direction from here. Now adding the actual current timeline. (Green right Axis)
Yields
What goes up, must come down.
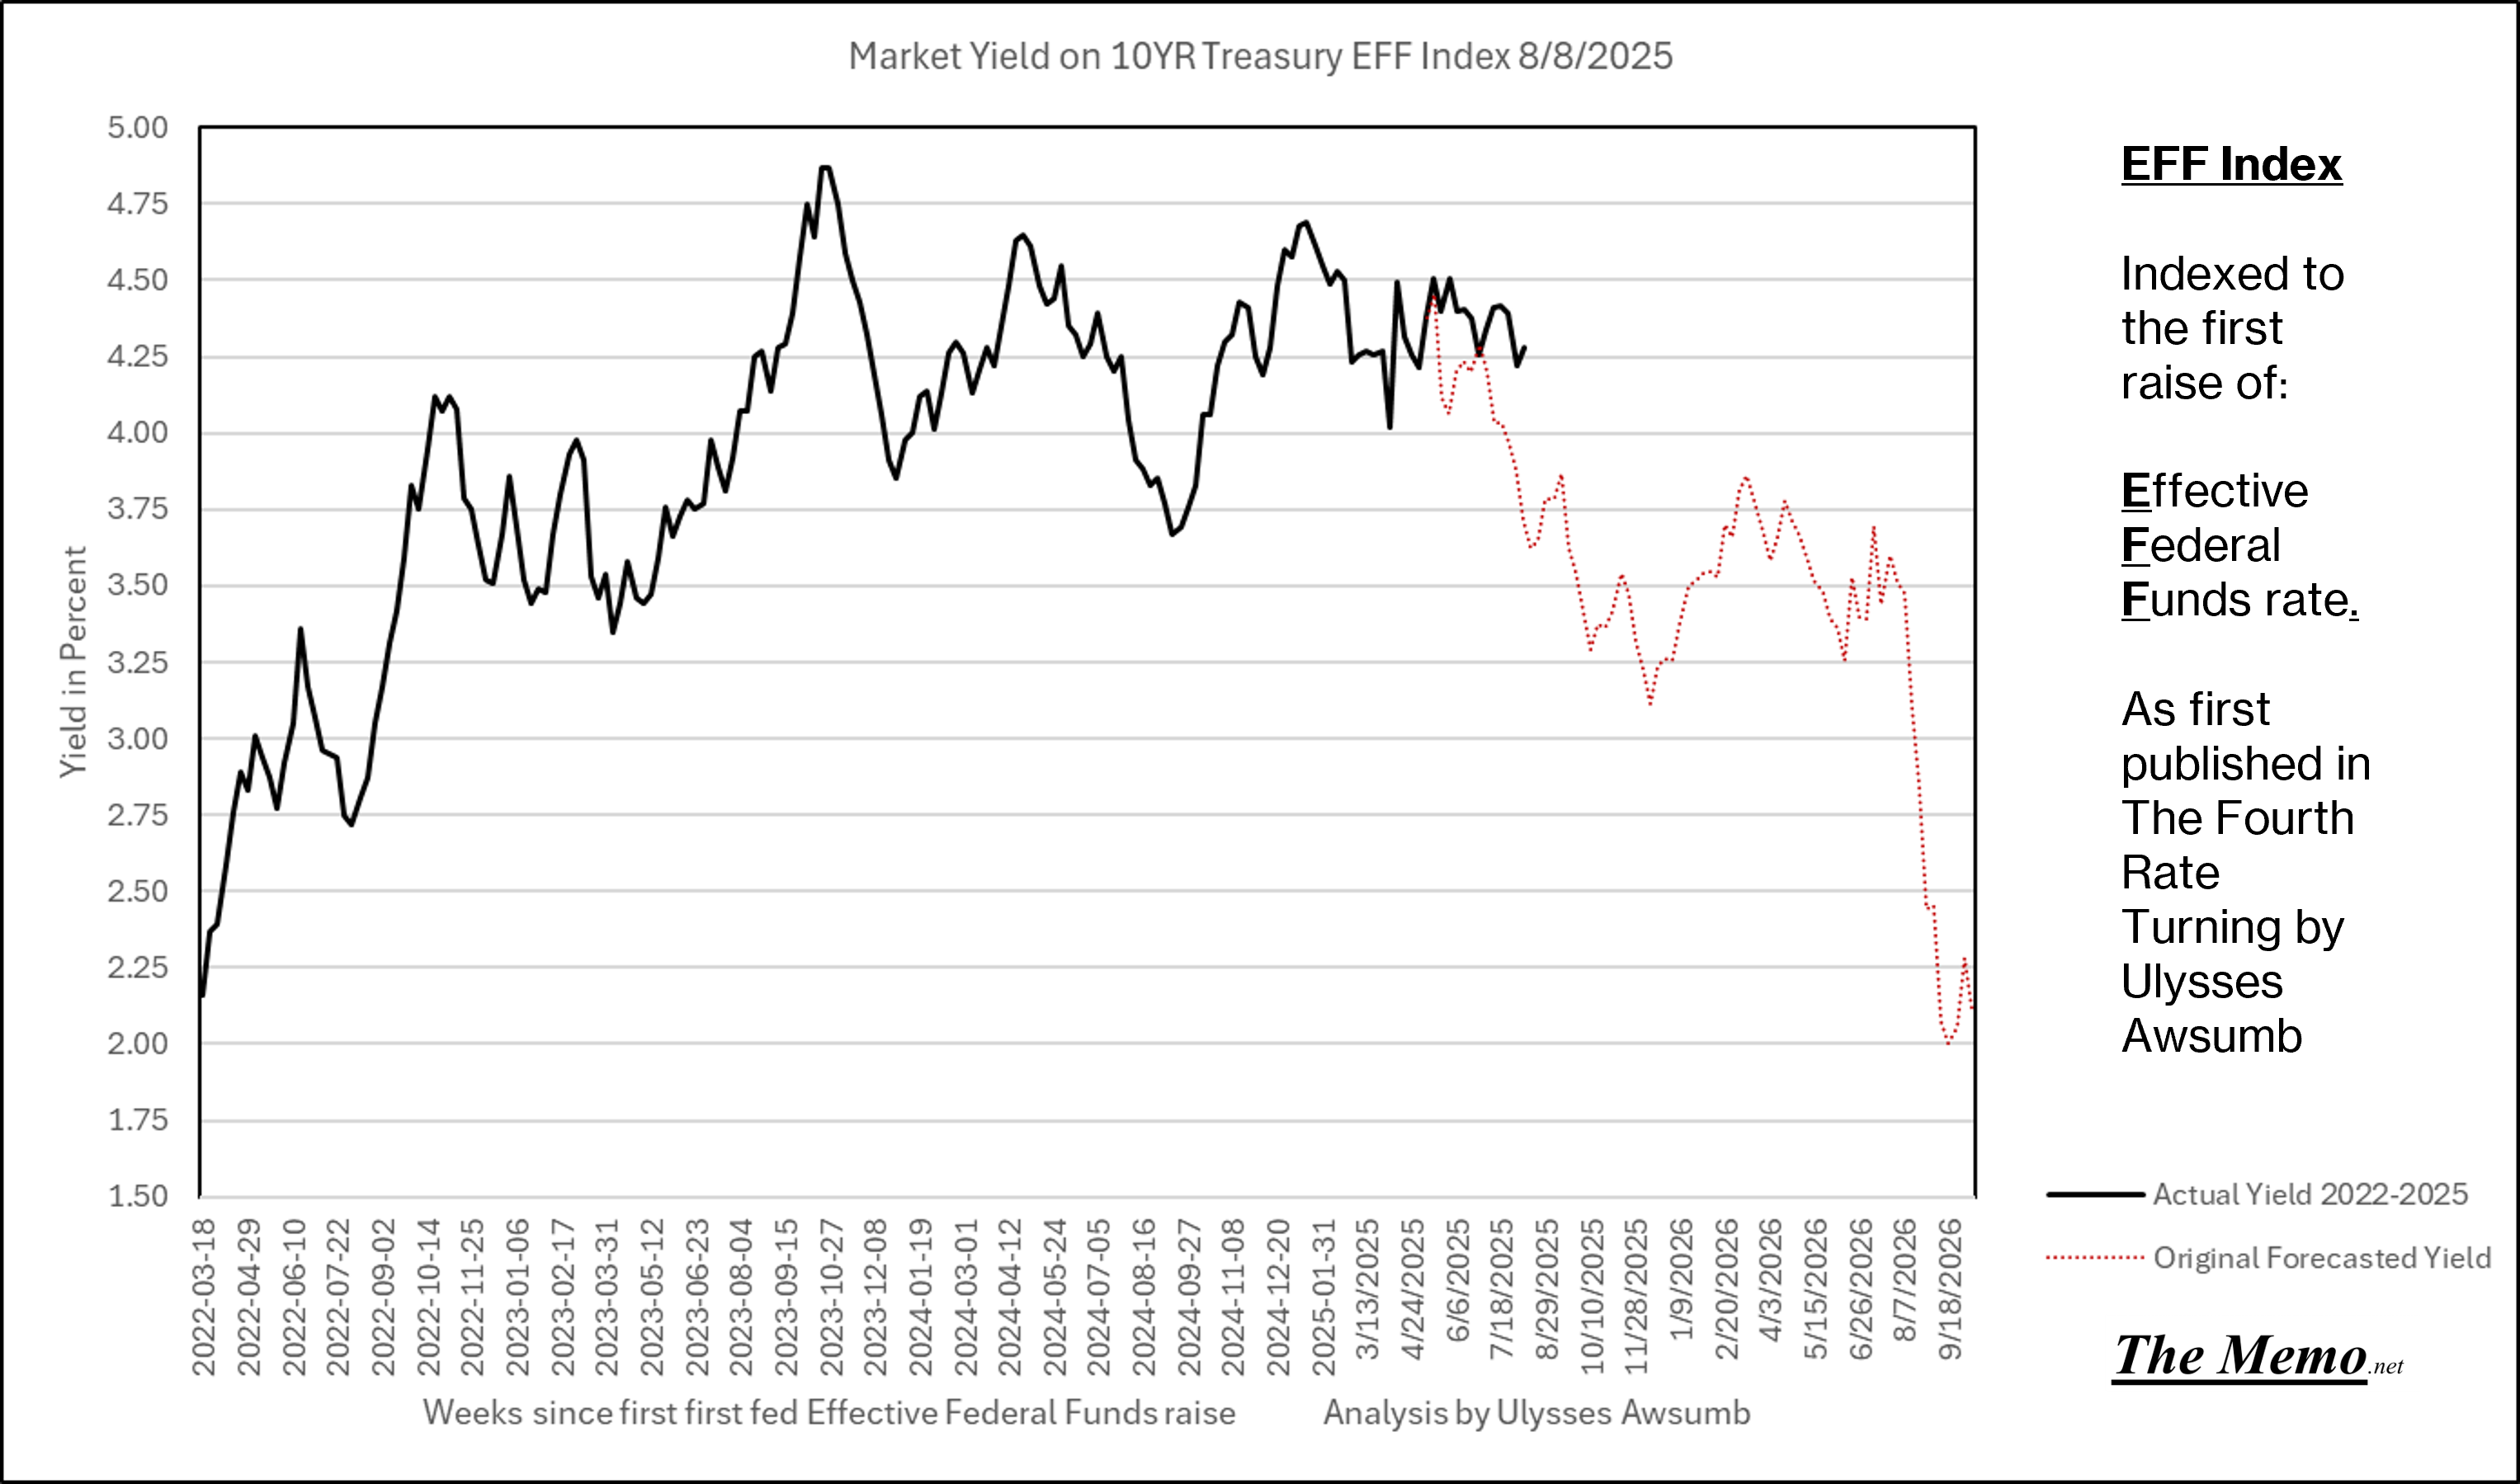
And on the others side of the see saw we get: spread thin.
Builders
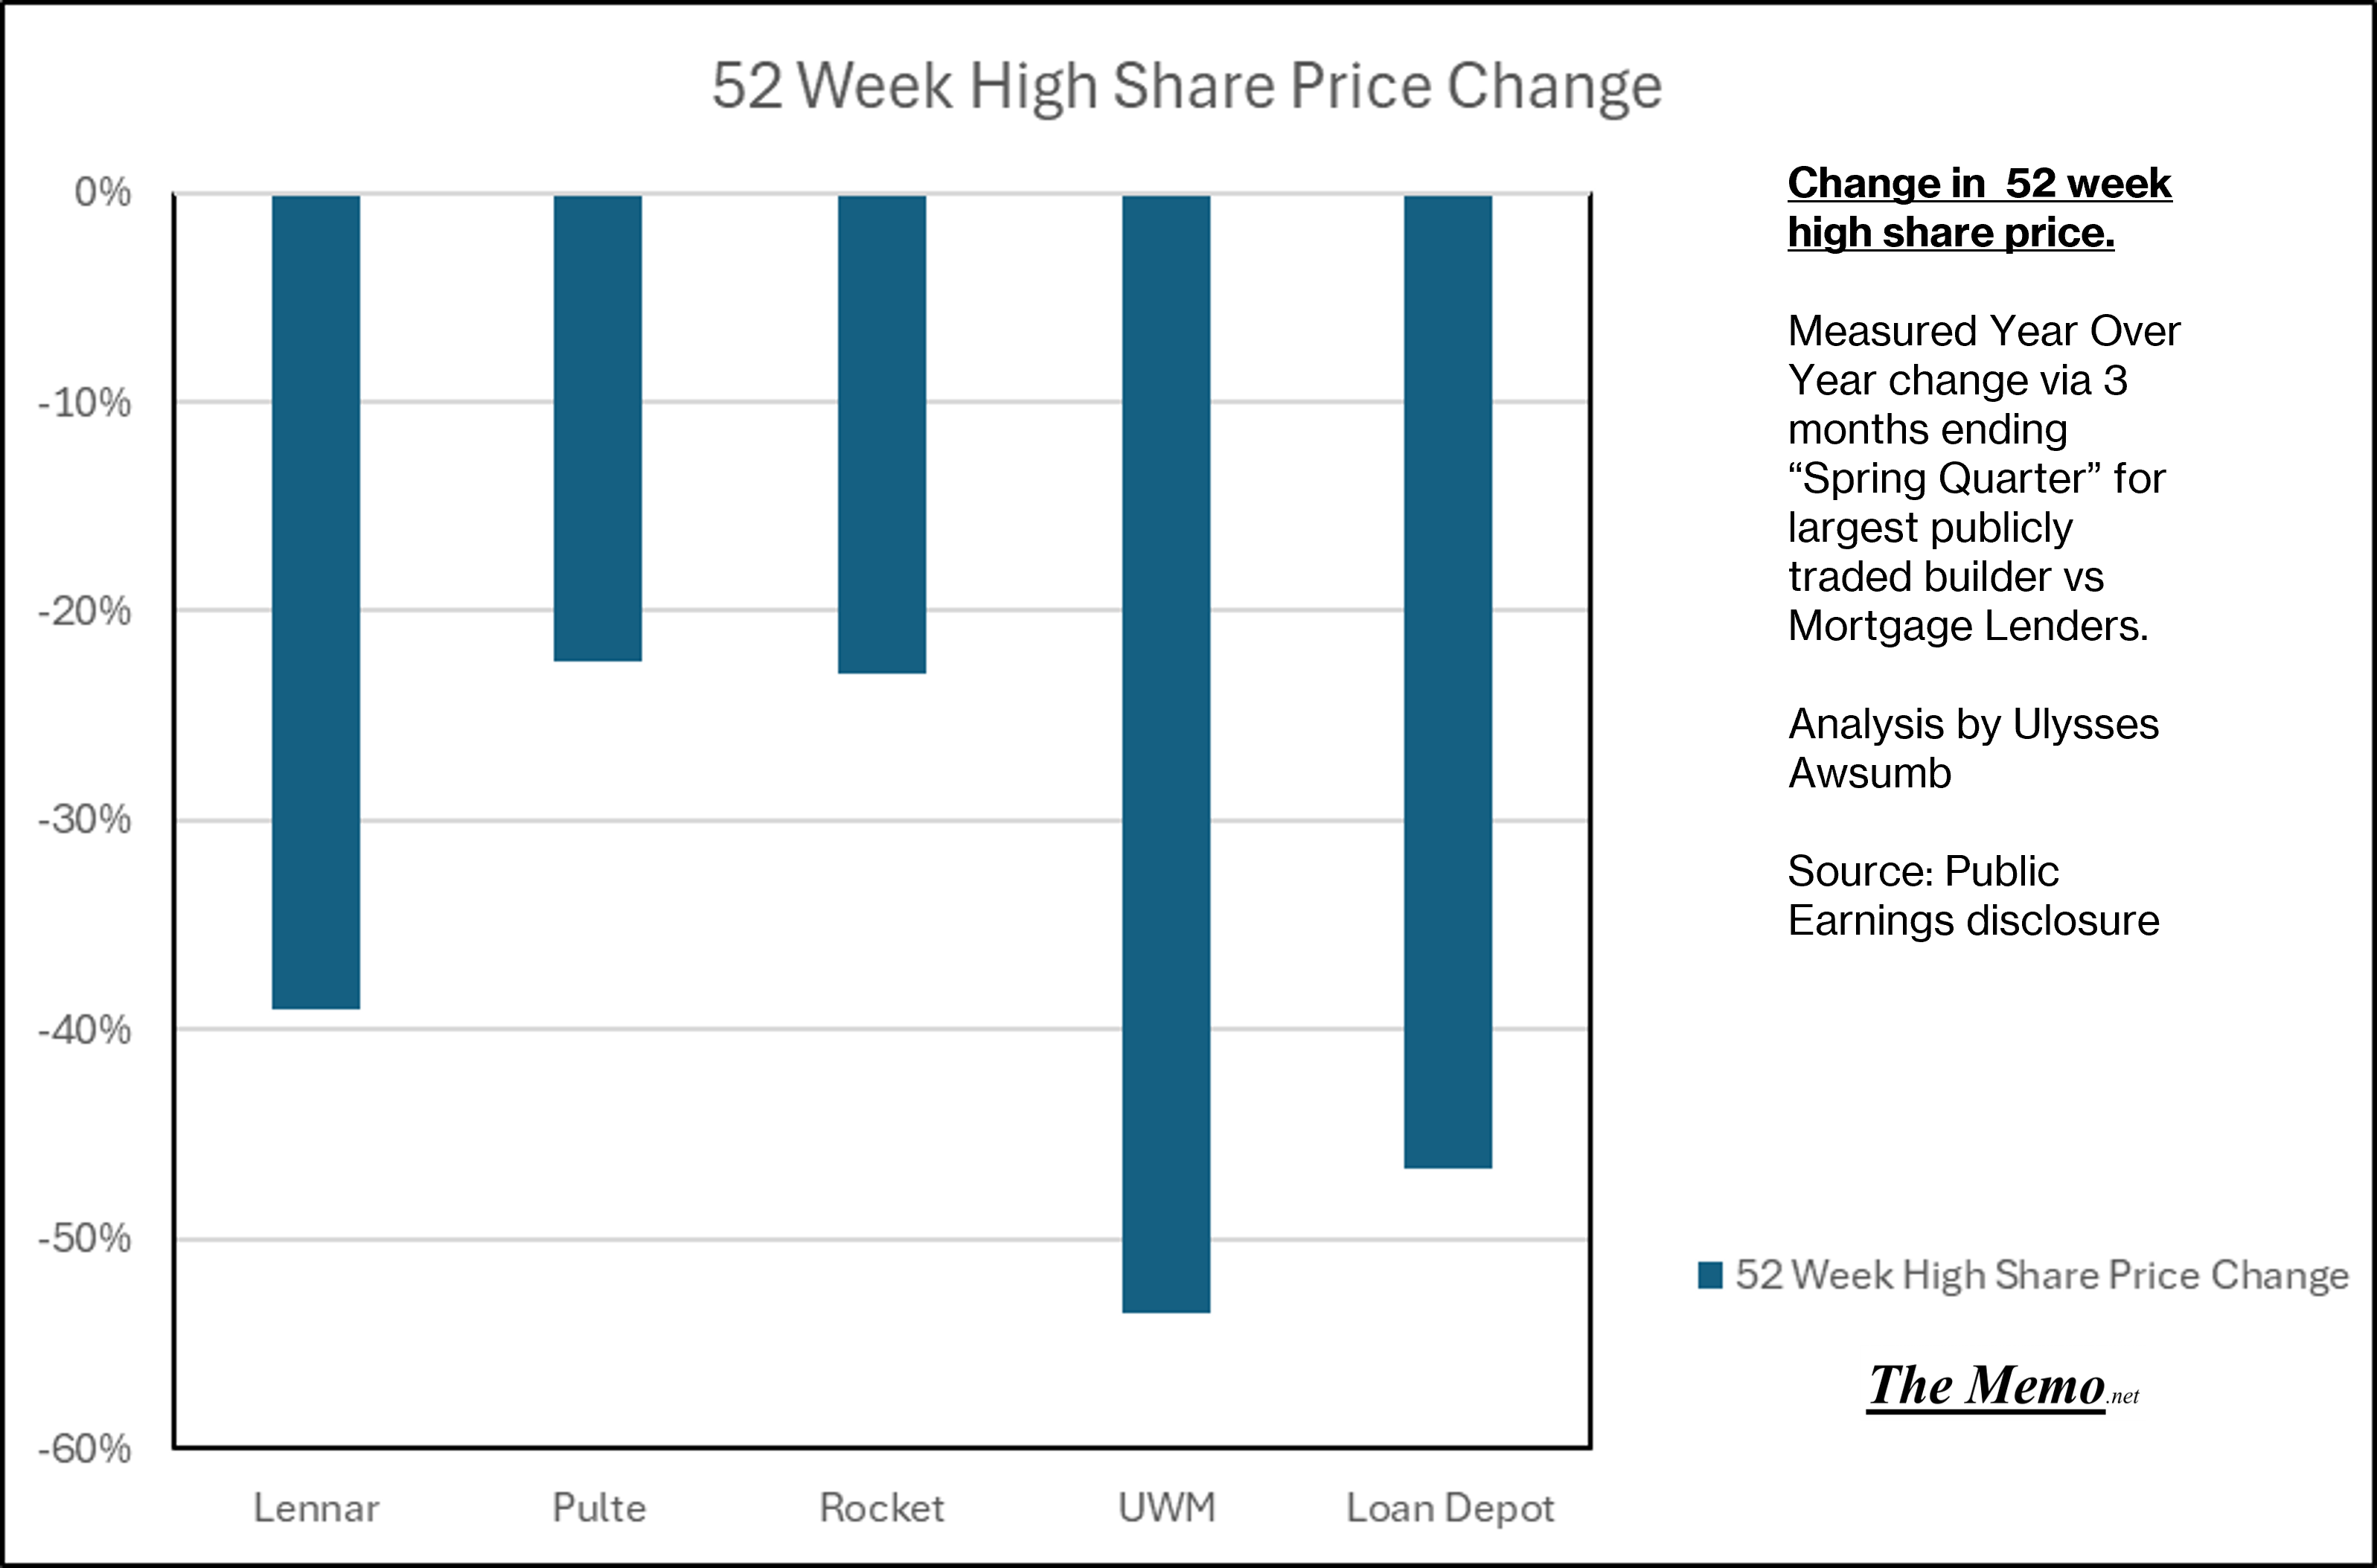
We’ve now got 14 of the largets pulbicly traded builders reporting Q2 or “Spring” quarter earnings. And the spring came in and left like a lion. While YOY share prices don’t seem too bad, when comparing 52 week highs, the same senitment becomes a ghost.
The best share price performance belongs to American Homes For Rent, at -15% while LGI Homes sits at the bottom having lost 54% of their per share value.
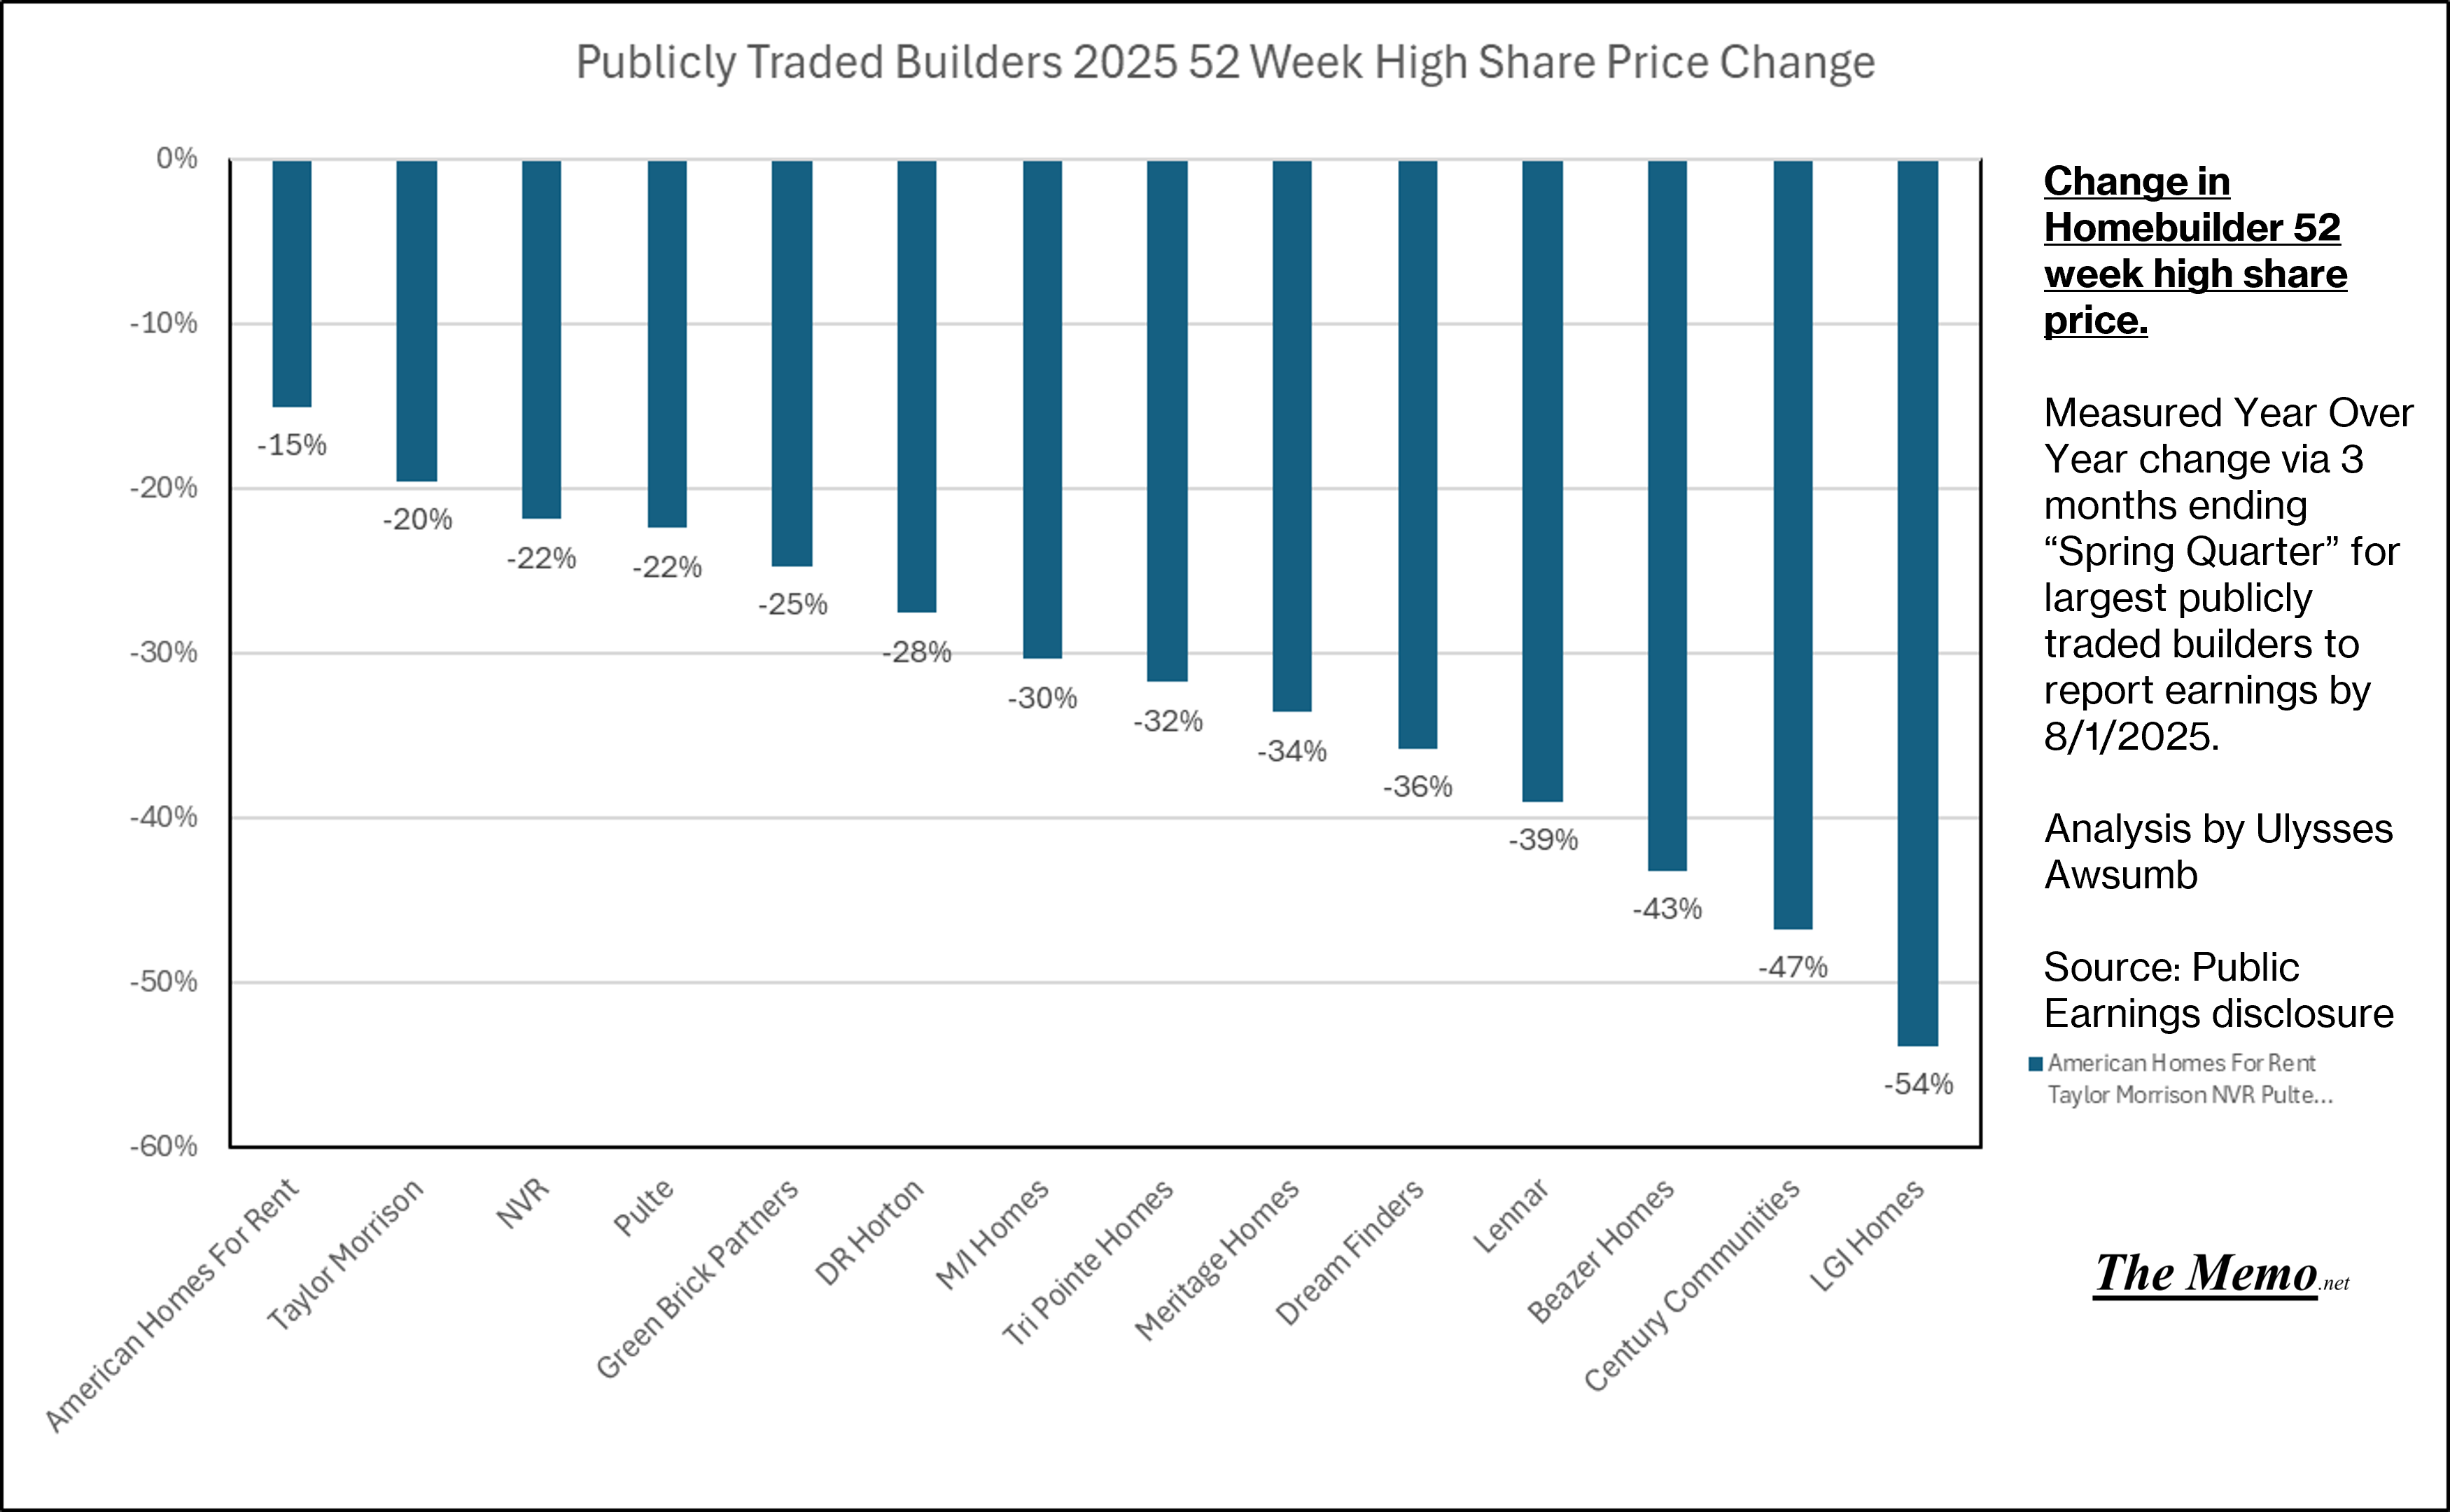
But stock prices are never the whole picture. Dot com should be lesson enough in that regard.
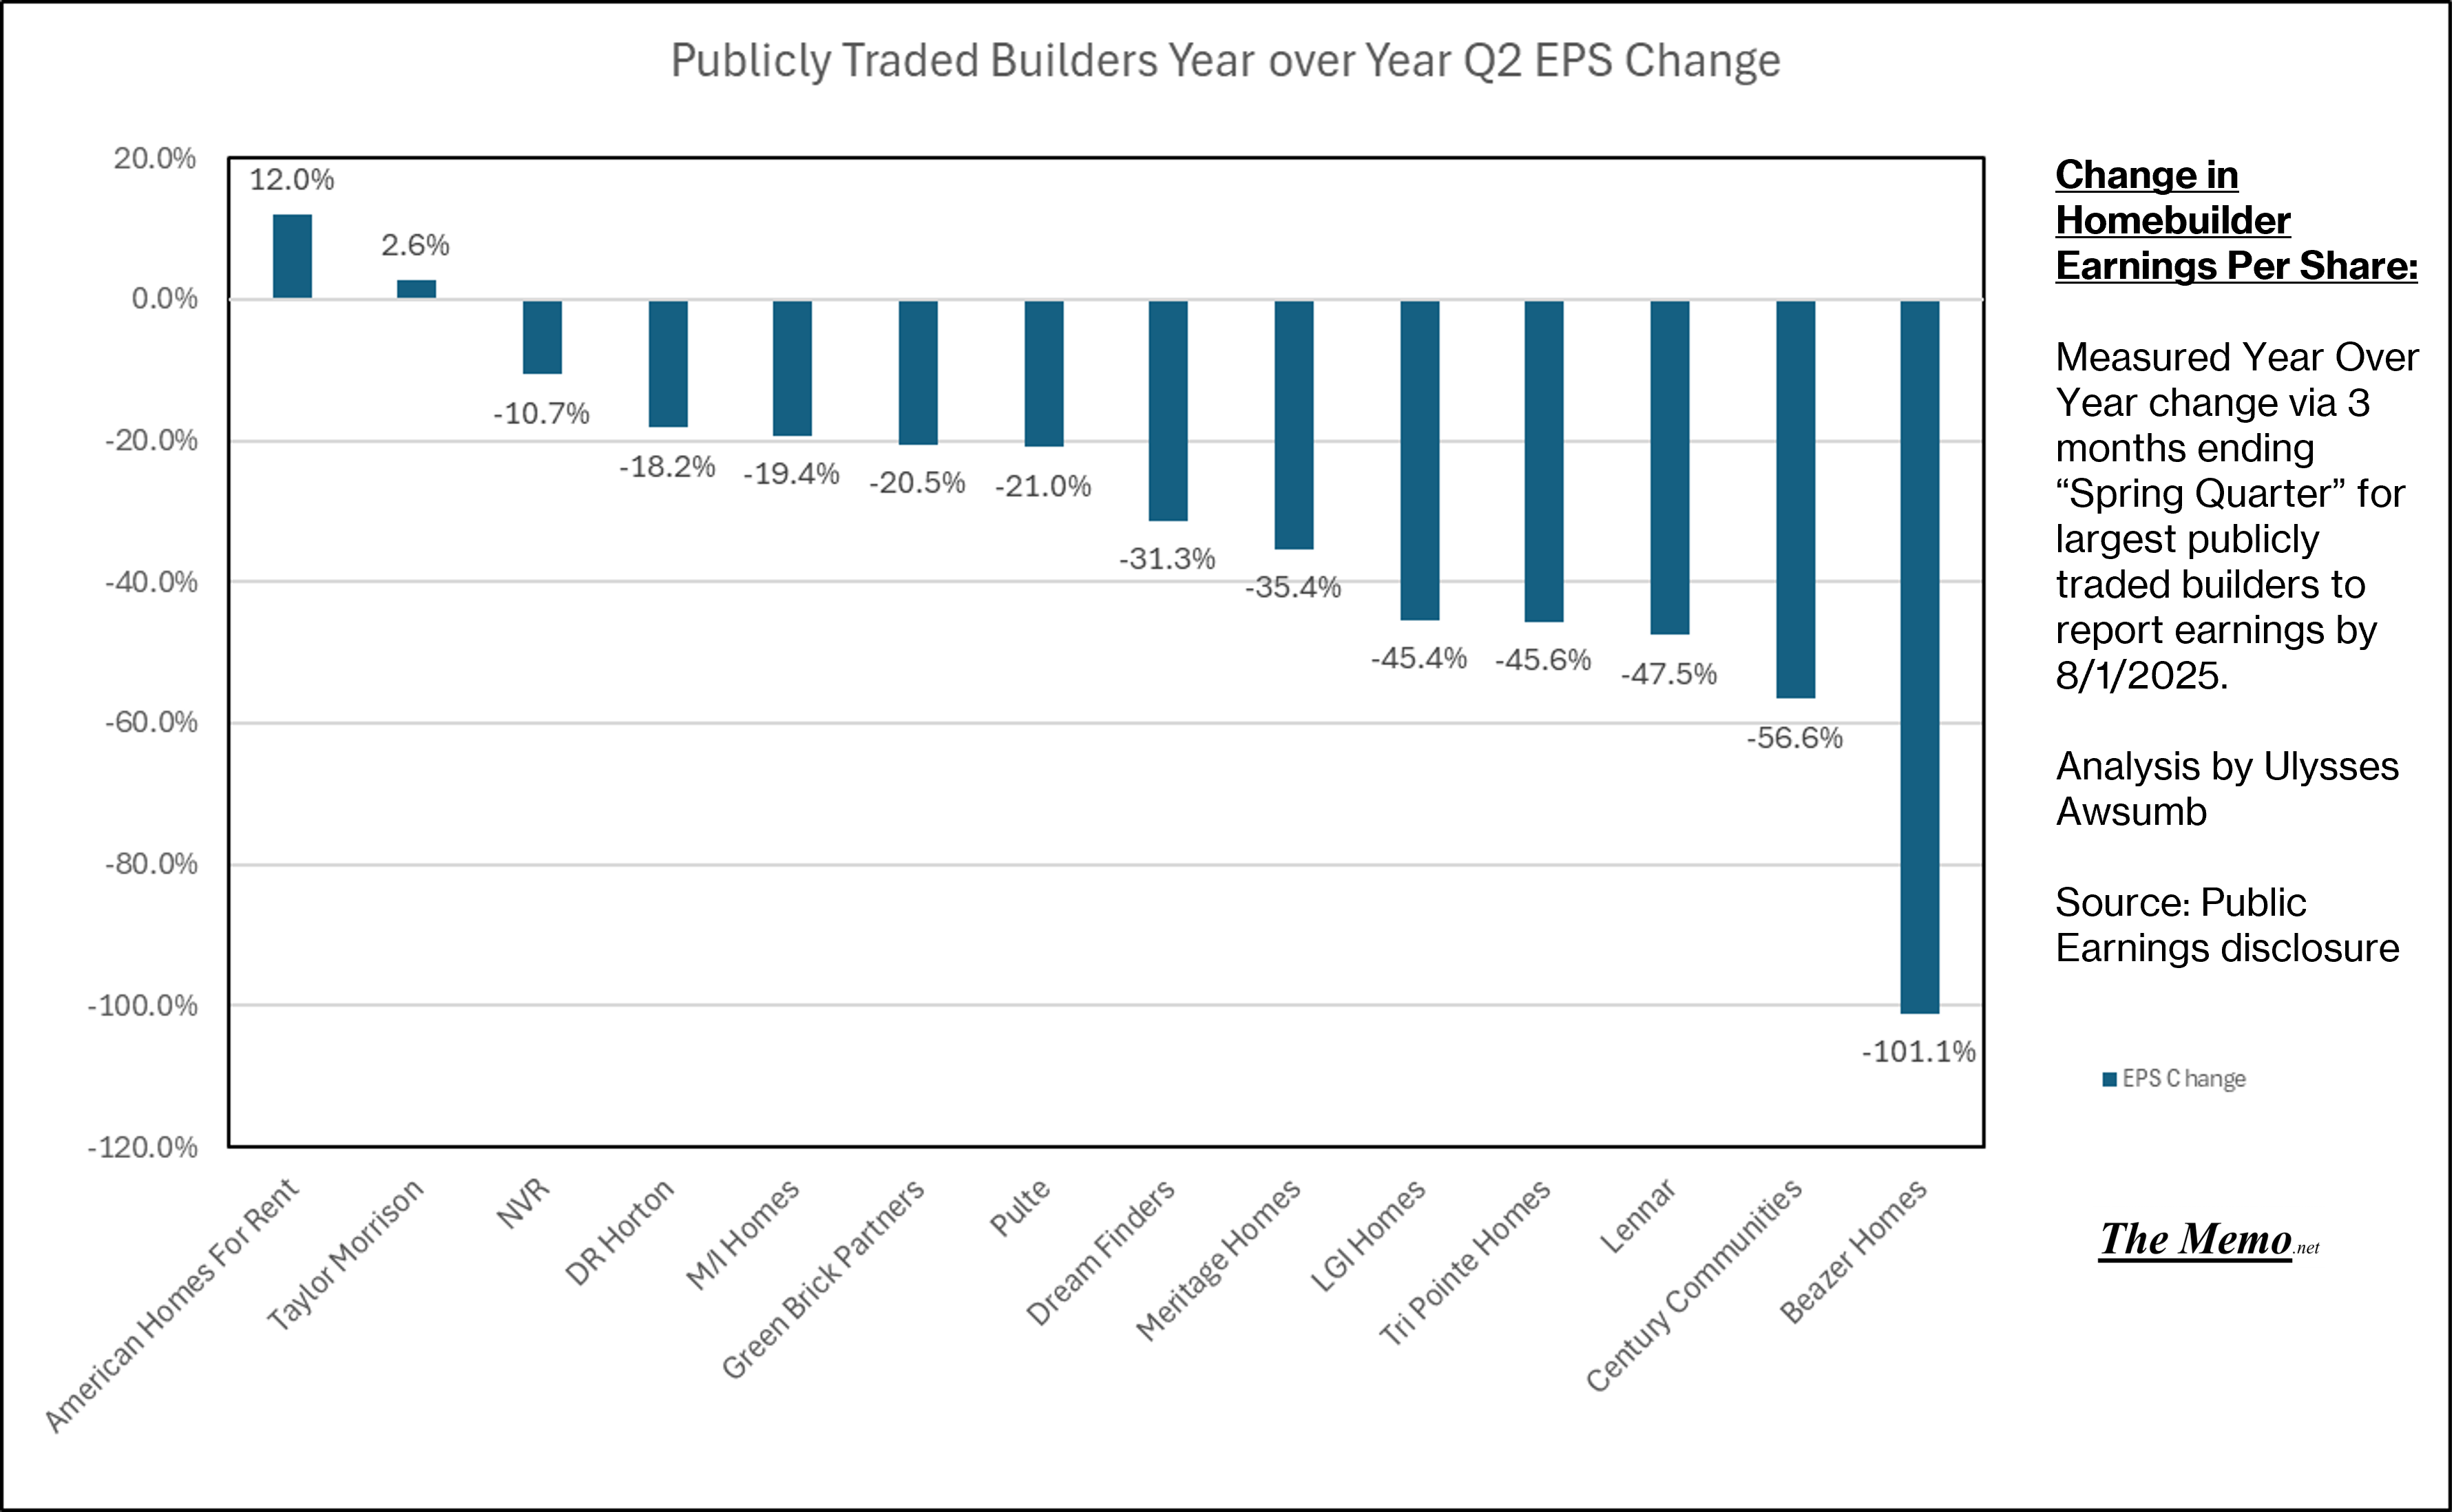
Spring Q year over year change in earnings per share is hardly any better. American Homes for Rent once again leads the pack at +12%, while Tayolor Morrison leads the For Sale bunch at a whopping +2.69% 3 months ending YOY EPS. Beazer Homes takes the cake at -101.1% and becomes the first publicly traded builder to report a loss (an actual loss) this cylce. Good job Eric et all at LGI. I had you penciled in for a loss this Q.
Net Income changes were no better than the other marks. AMH again at +12.1%. Every other builder saw negative YOY change in Net Income. The boom we heard was not liftoff.
Century Communites lead the way to the bottom, at -58.4% change in Net Income.
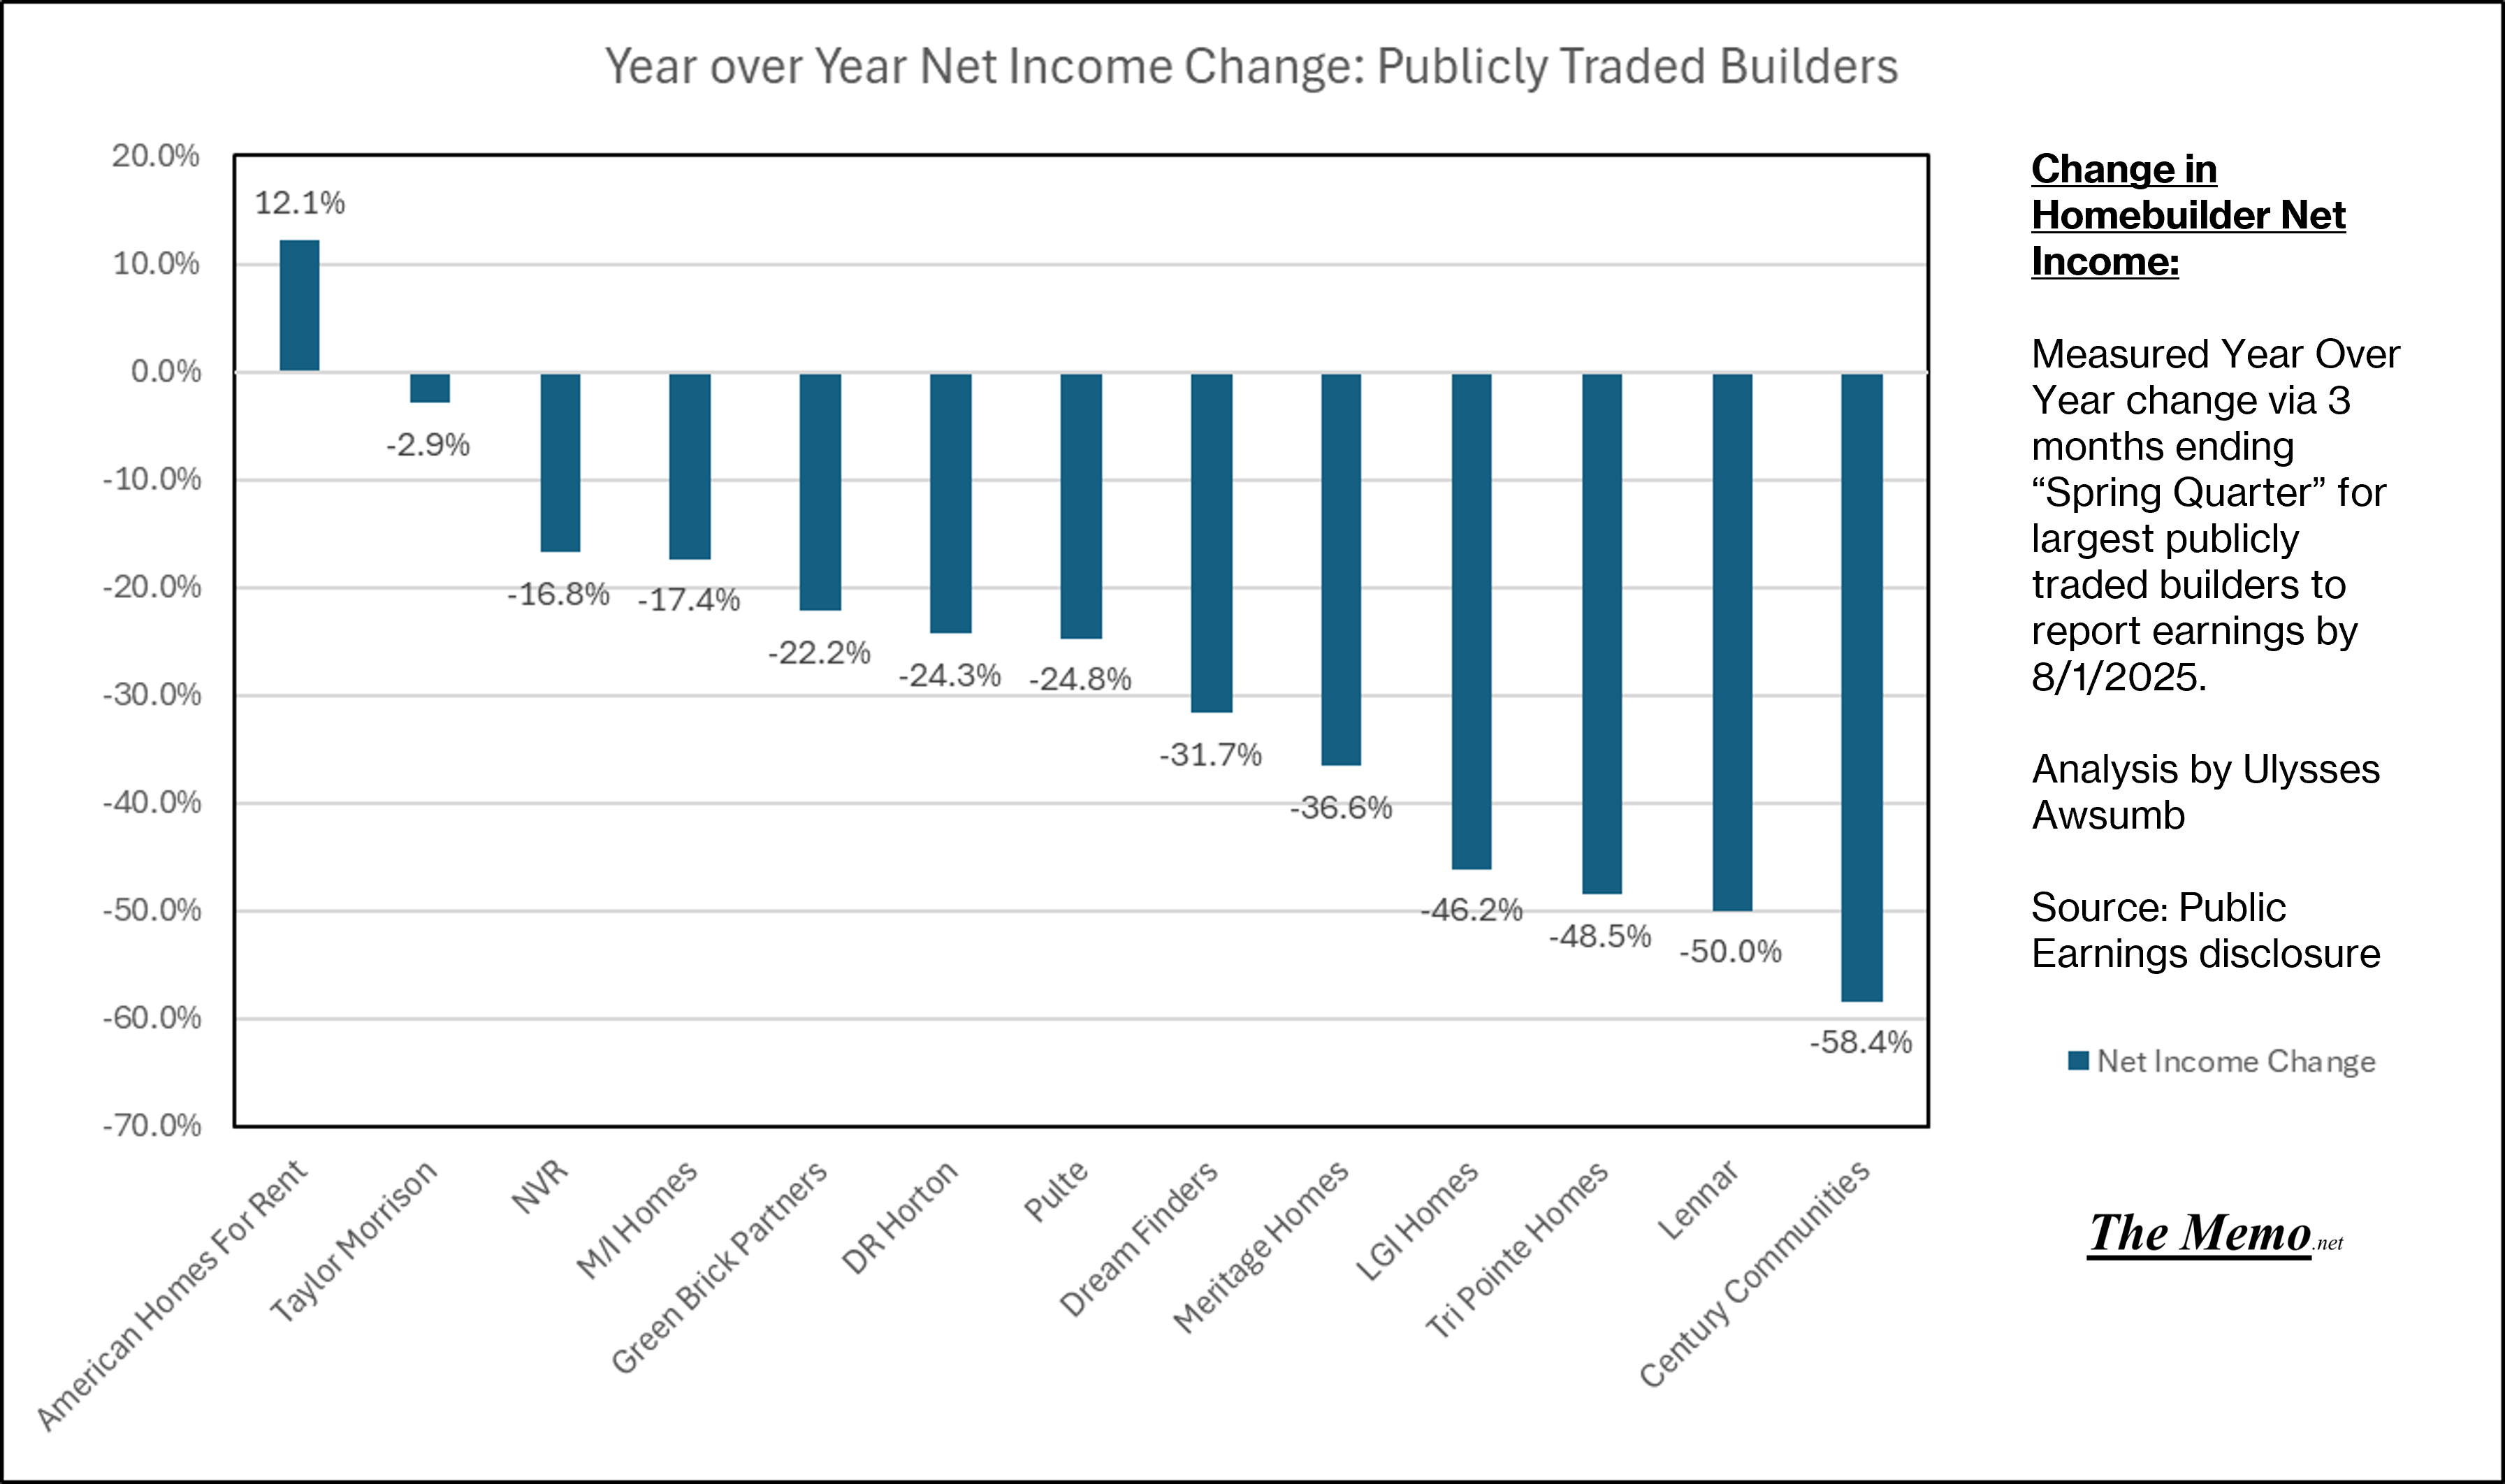
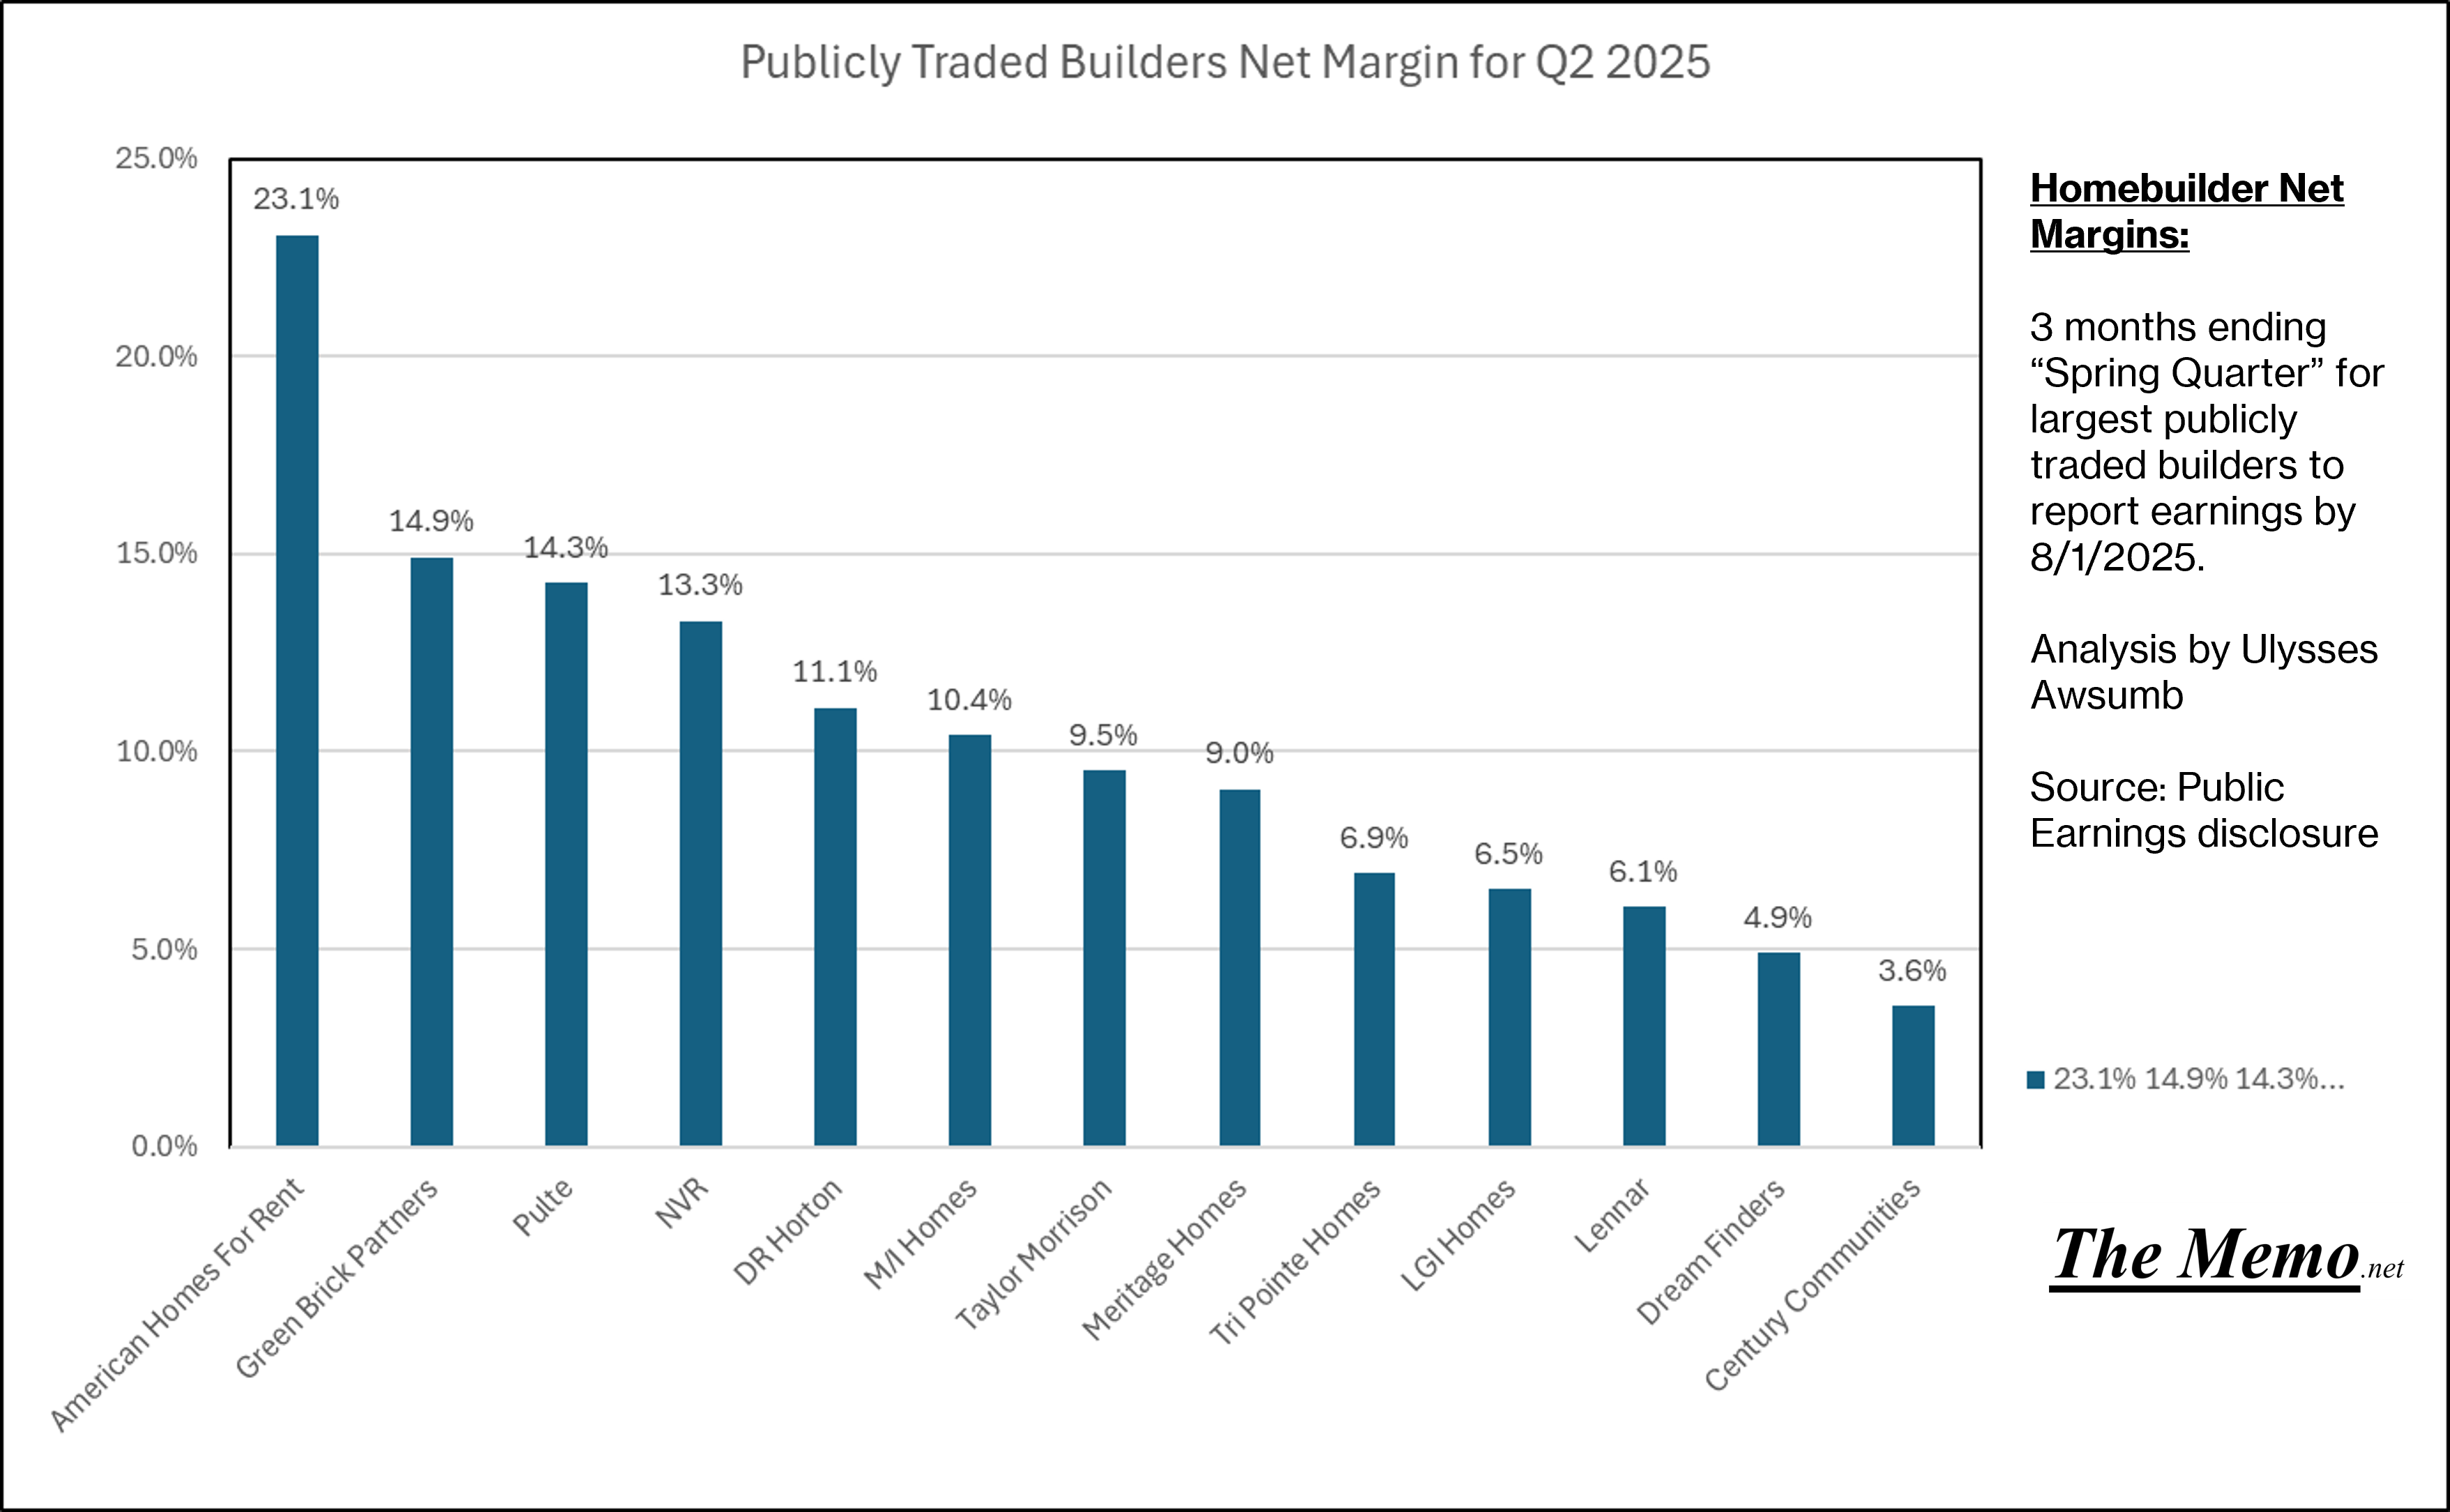
While other analysts keep talking about Gross Margins, the concept of Net seems to be lost enitirely. In case anyone thought builders were loving their “advantages over existing home sellers”, allow me to show you some Real(i)ty. AMH again tops Net Margins for the Q, while Green Brick Partners as a “For Sale” builder lead at 14.9% net margins. Century Communities brings up the back of the pack at 3.6% (for those who saw positive net margins). Beazer drops off here.
Loans
Now for a bit of a different perspective. Large lenders (mortgage originators) have had a wild year so far. So wild, that big builders are actually holding their own in regards to net income on loan origination business. DR Horton, “Americas Builder” and largest builder in the country, has stopped reporting thier gross/net, loan level data.
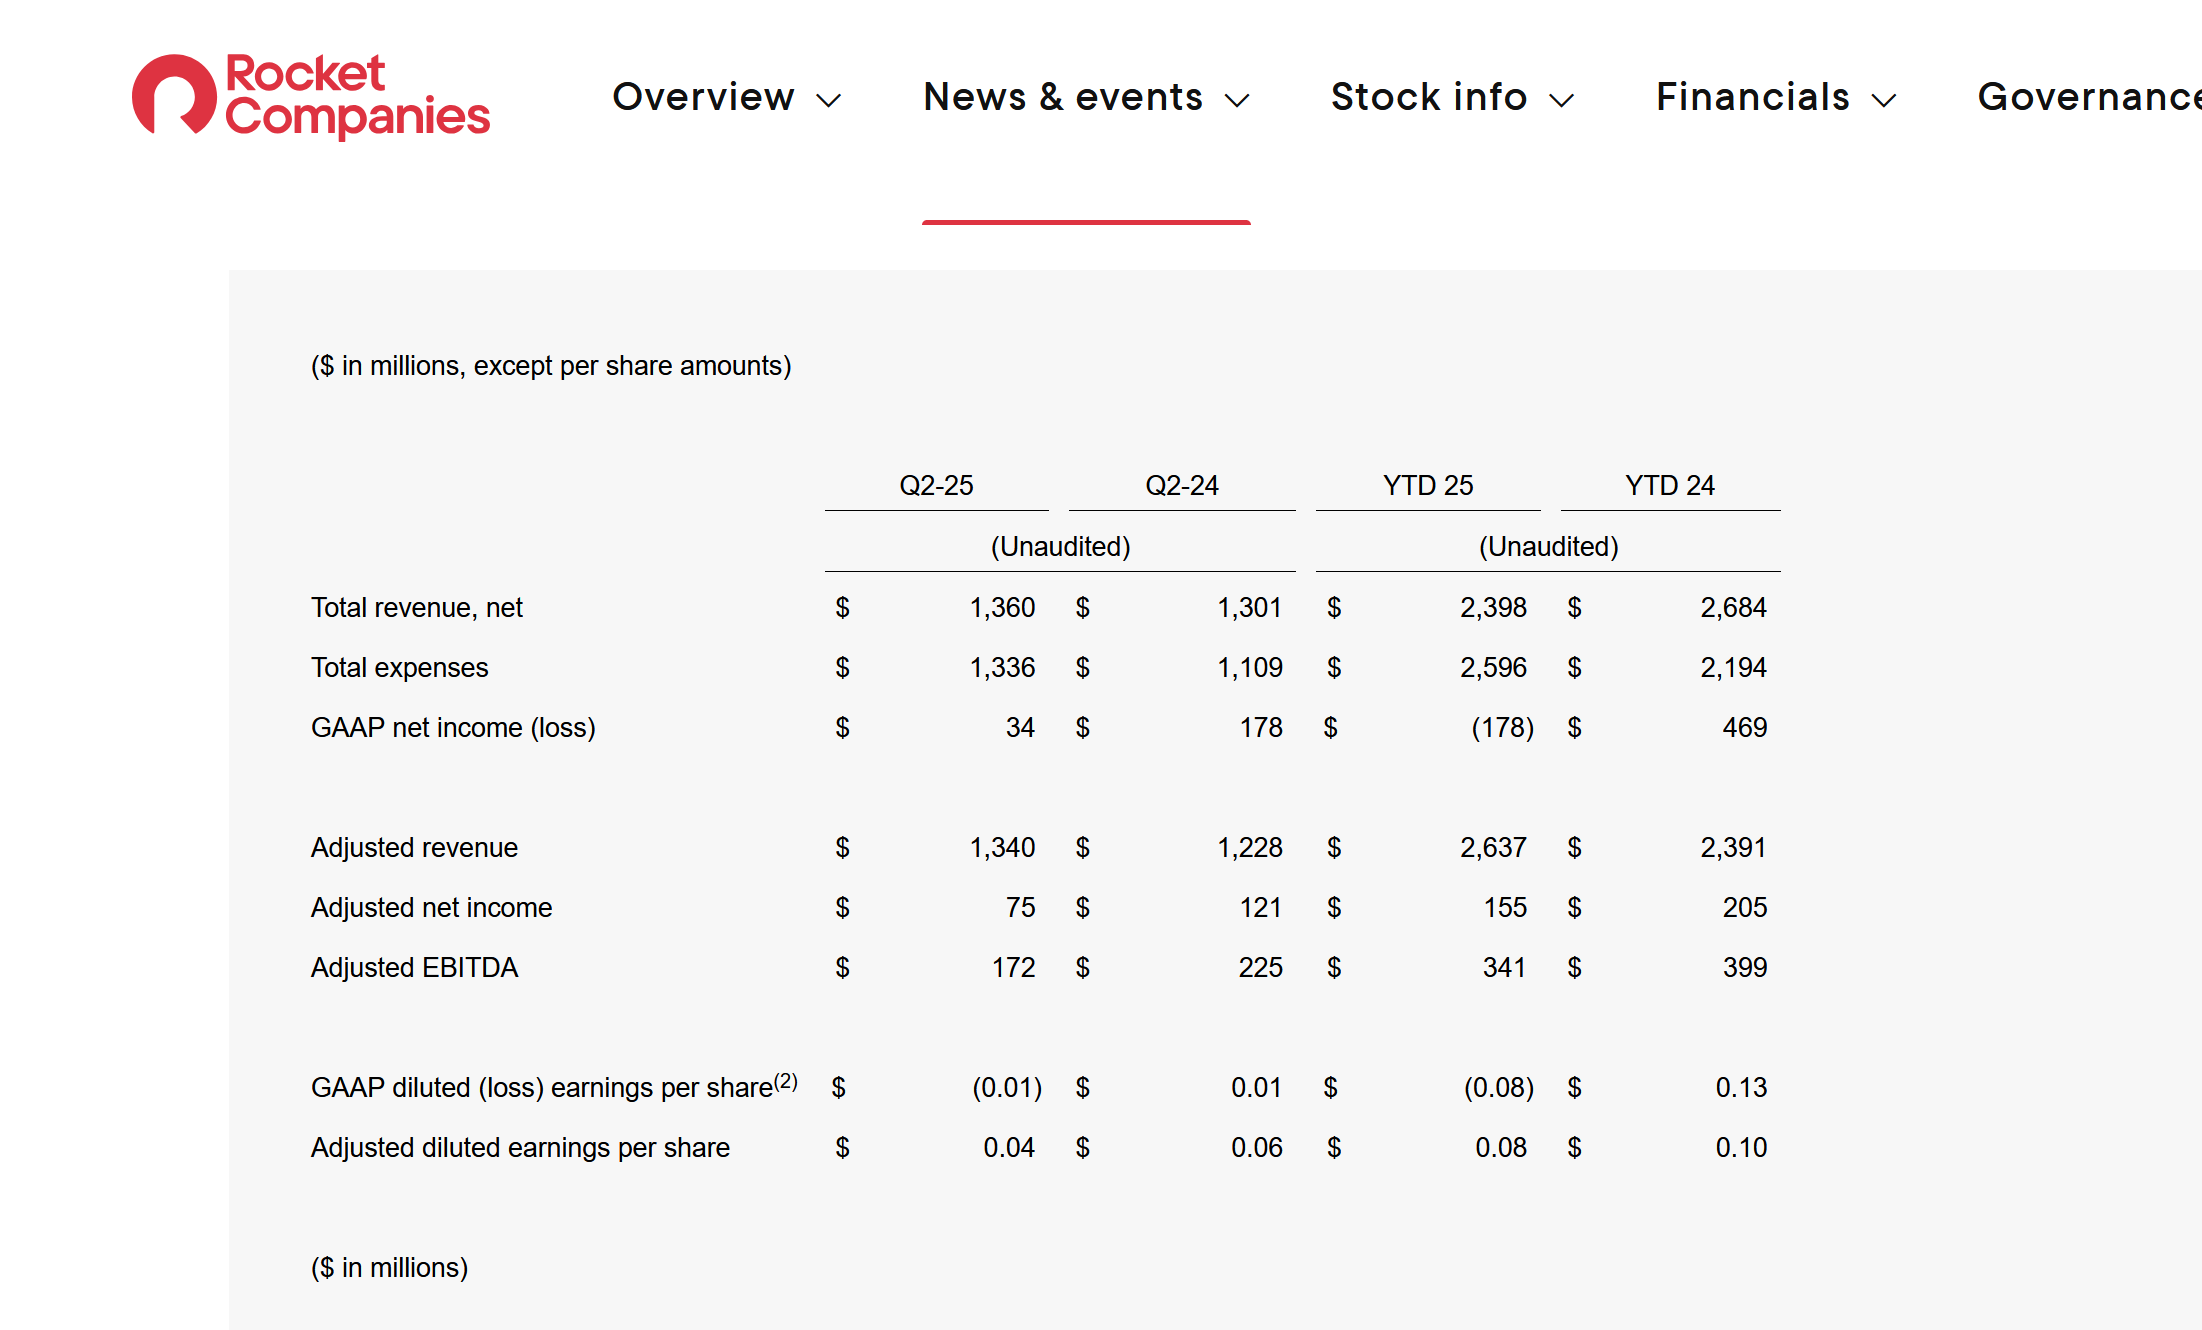
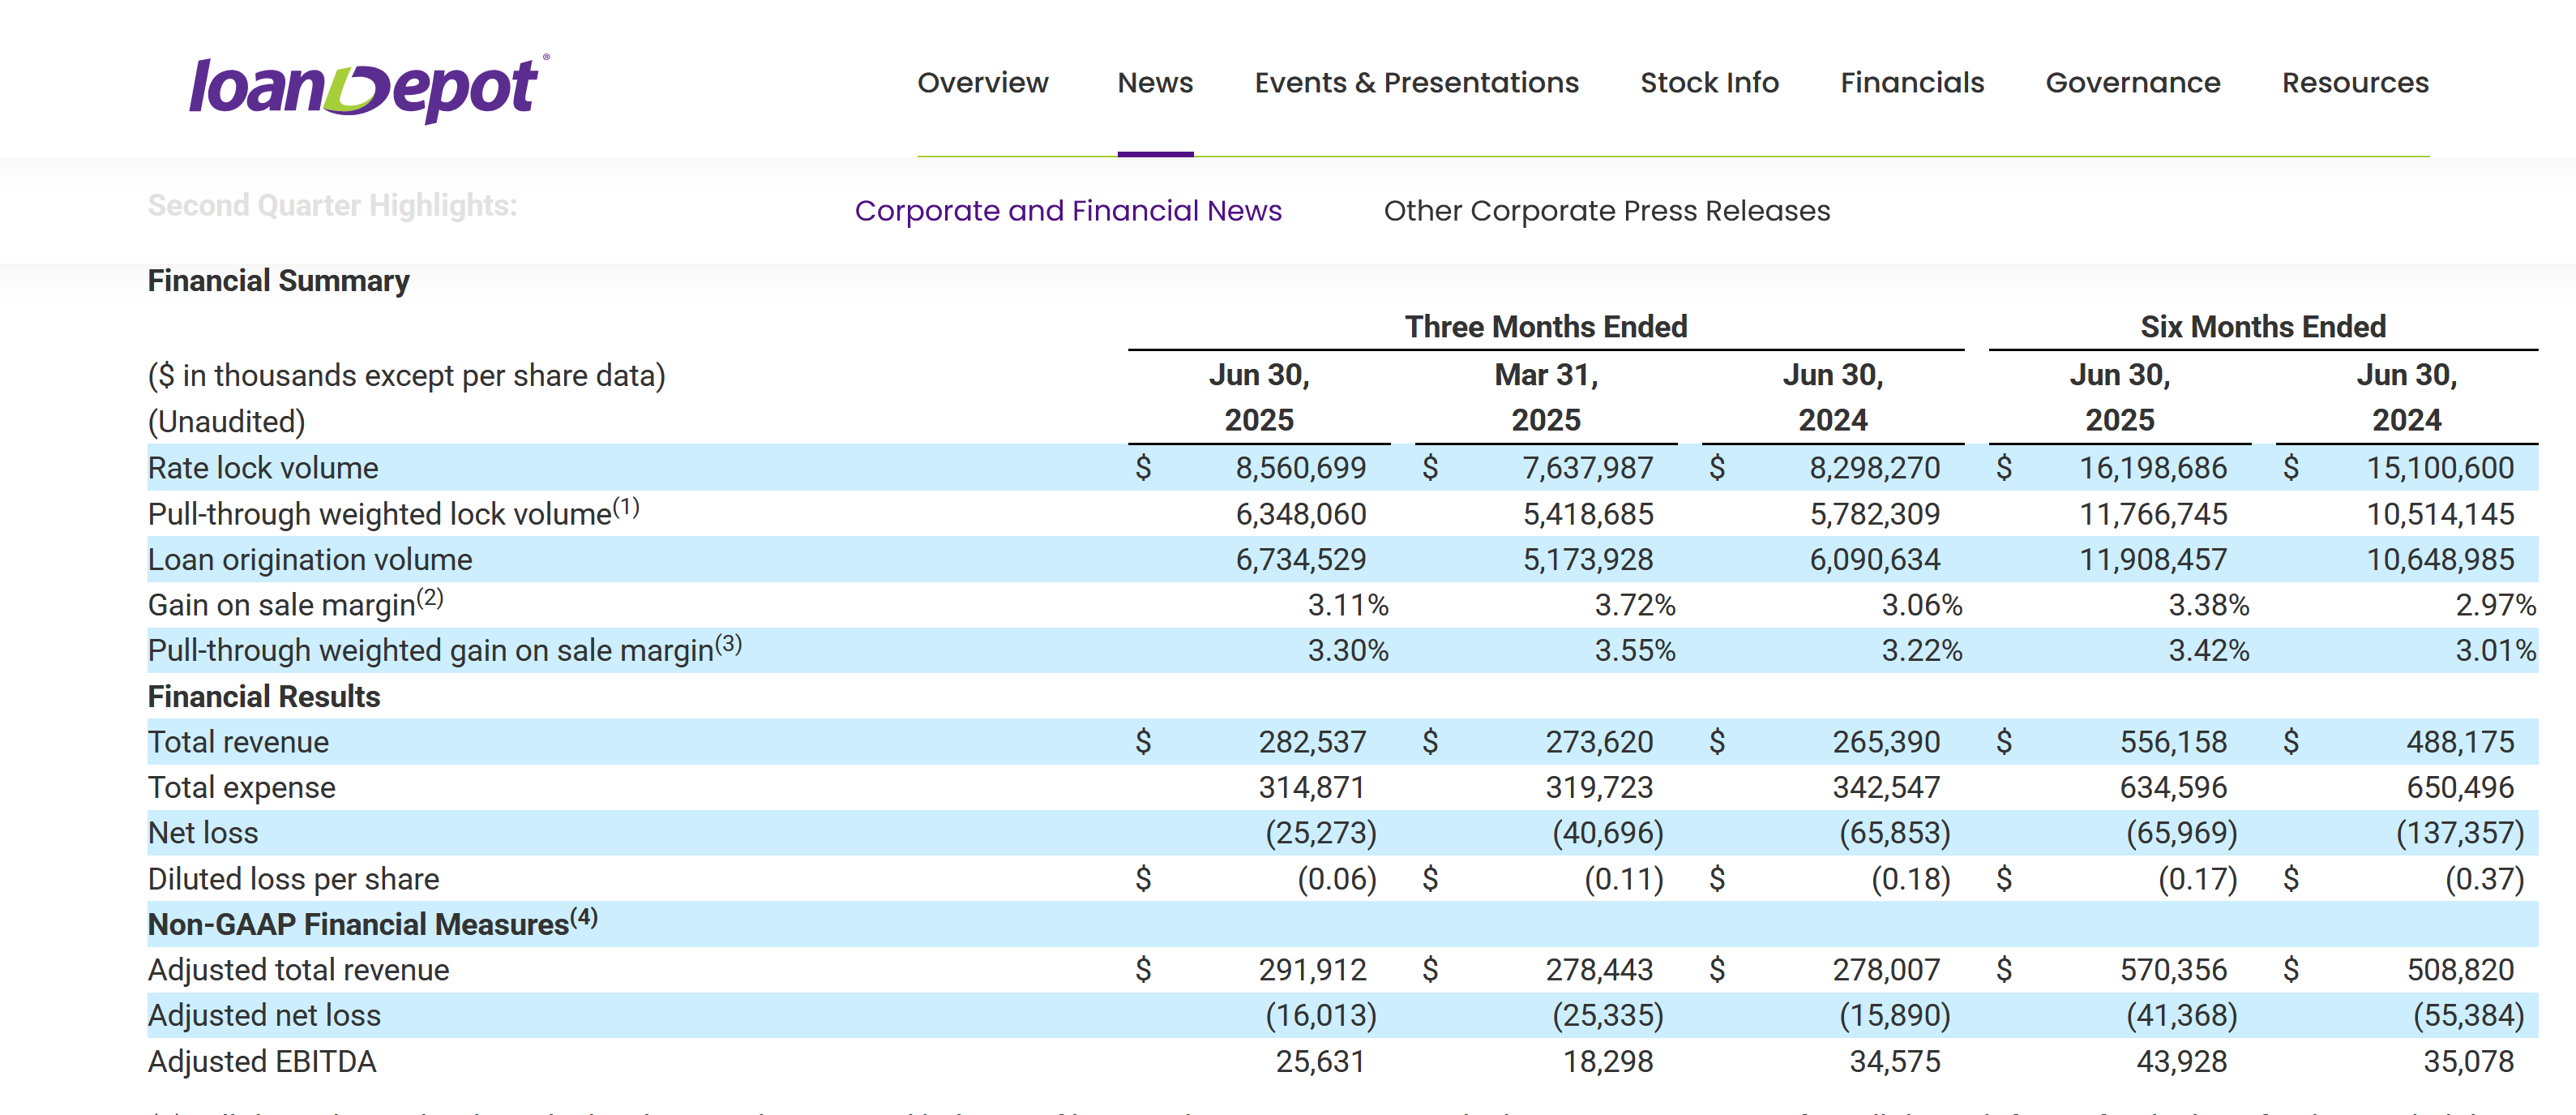
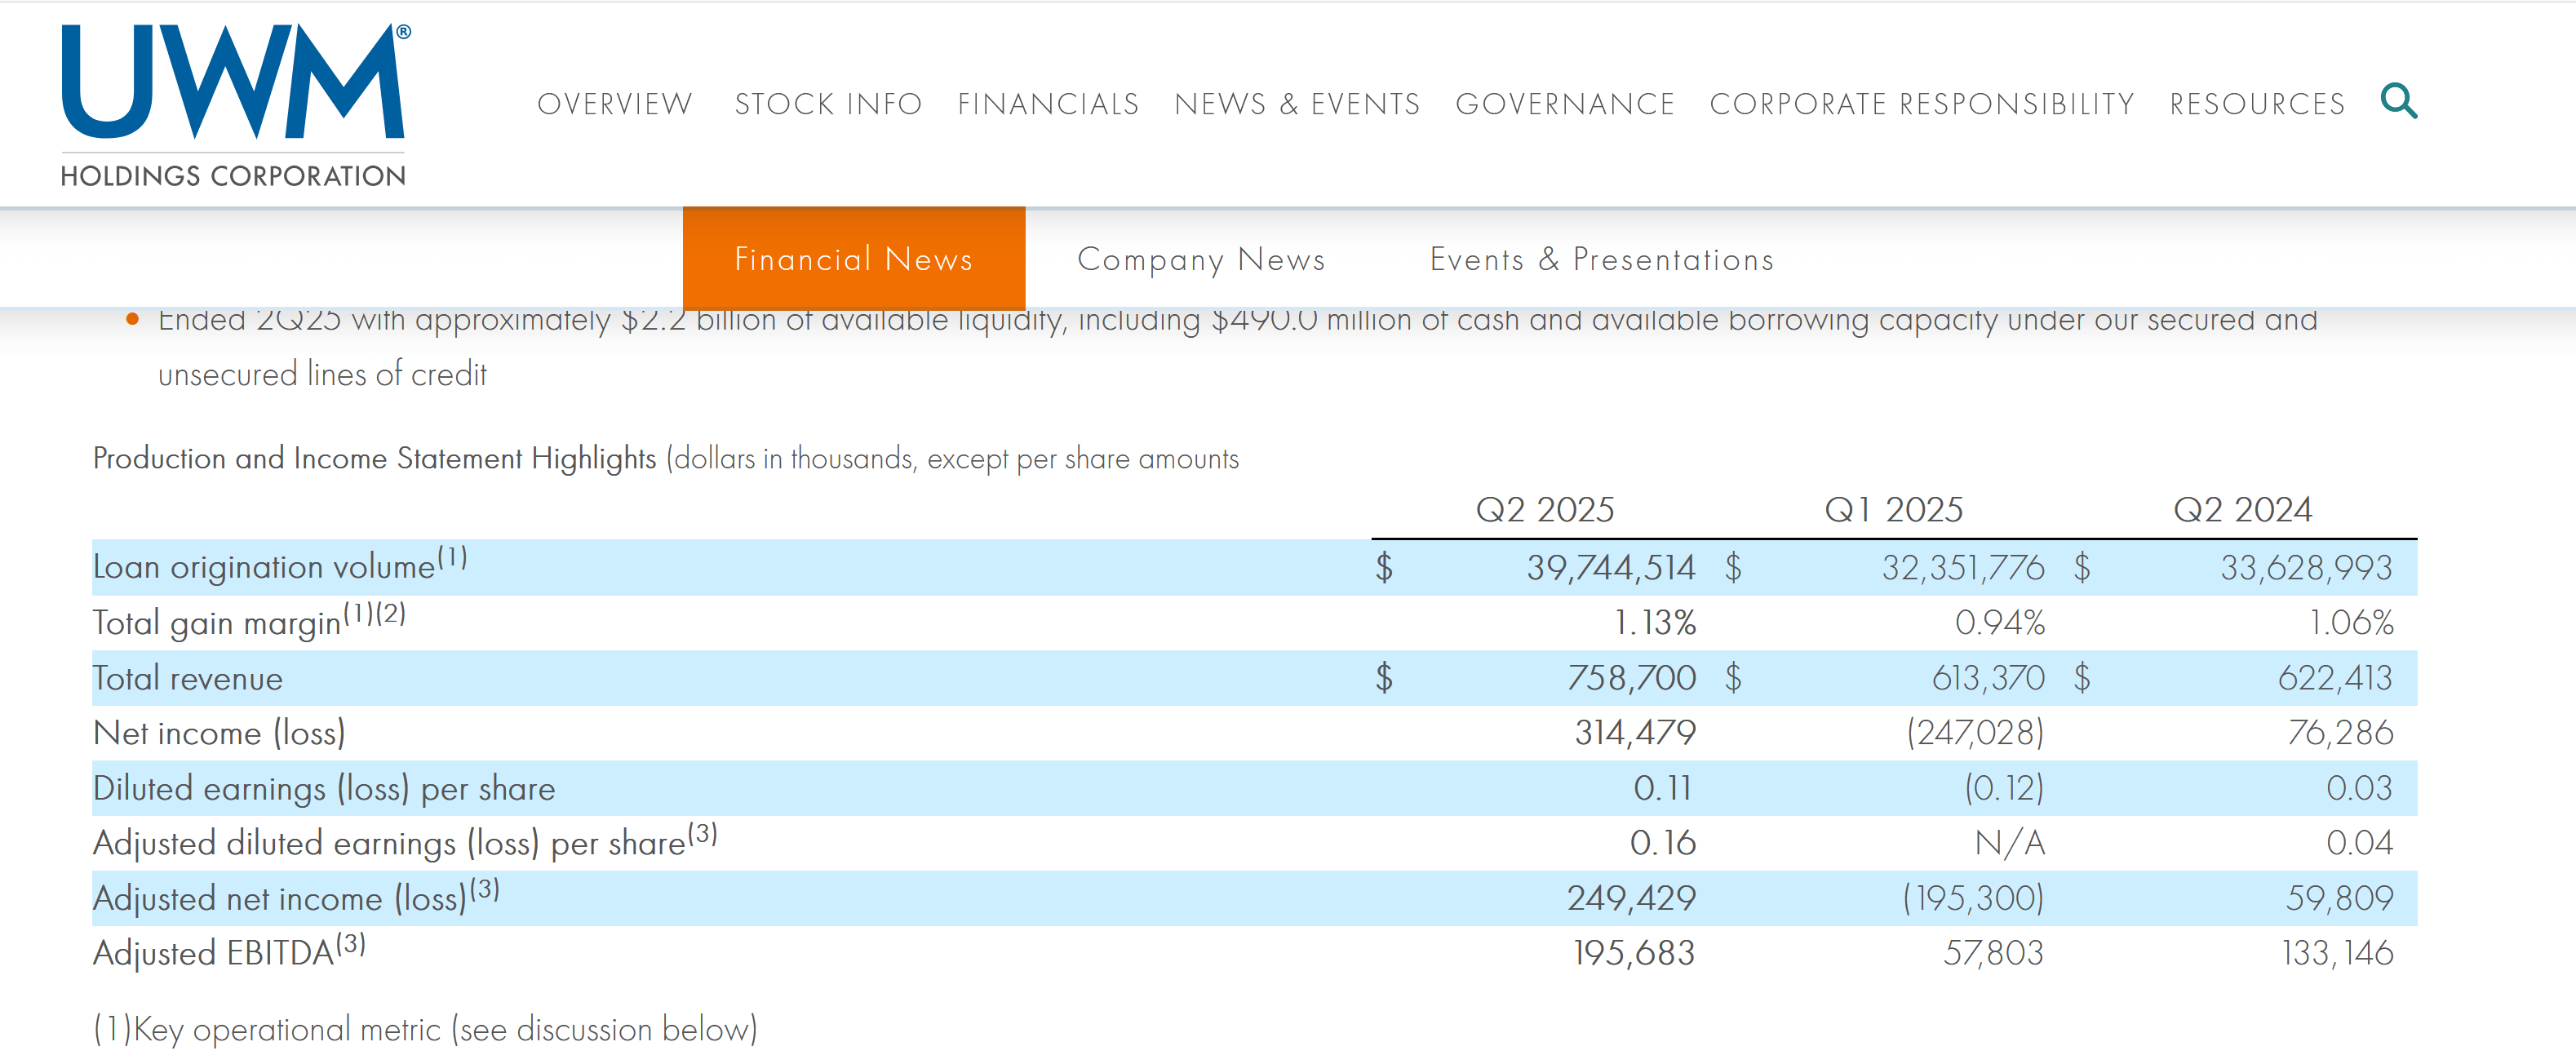
But we can compare #2, #3 builders: Lennar and Pulte Homes to: Rocket Mortgage, United Wholesale Mortgage and Loan Depot.
On a 52 week per share price change, the picture is as ugly as builder revenues.
On loan origination net income change, UWM and Loan Depot fared the best.
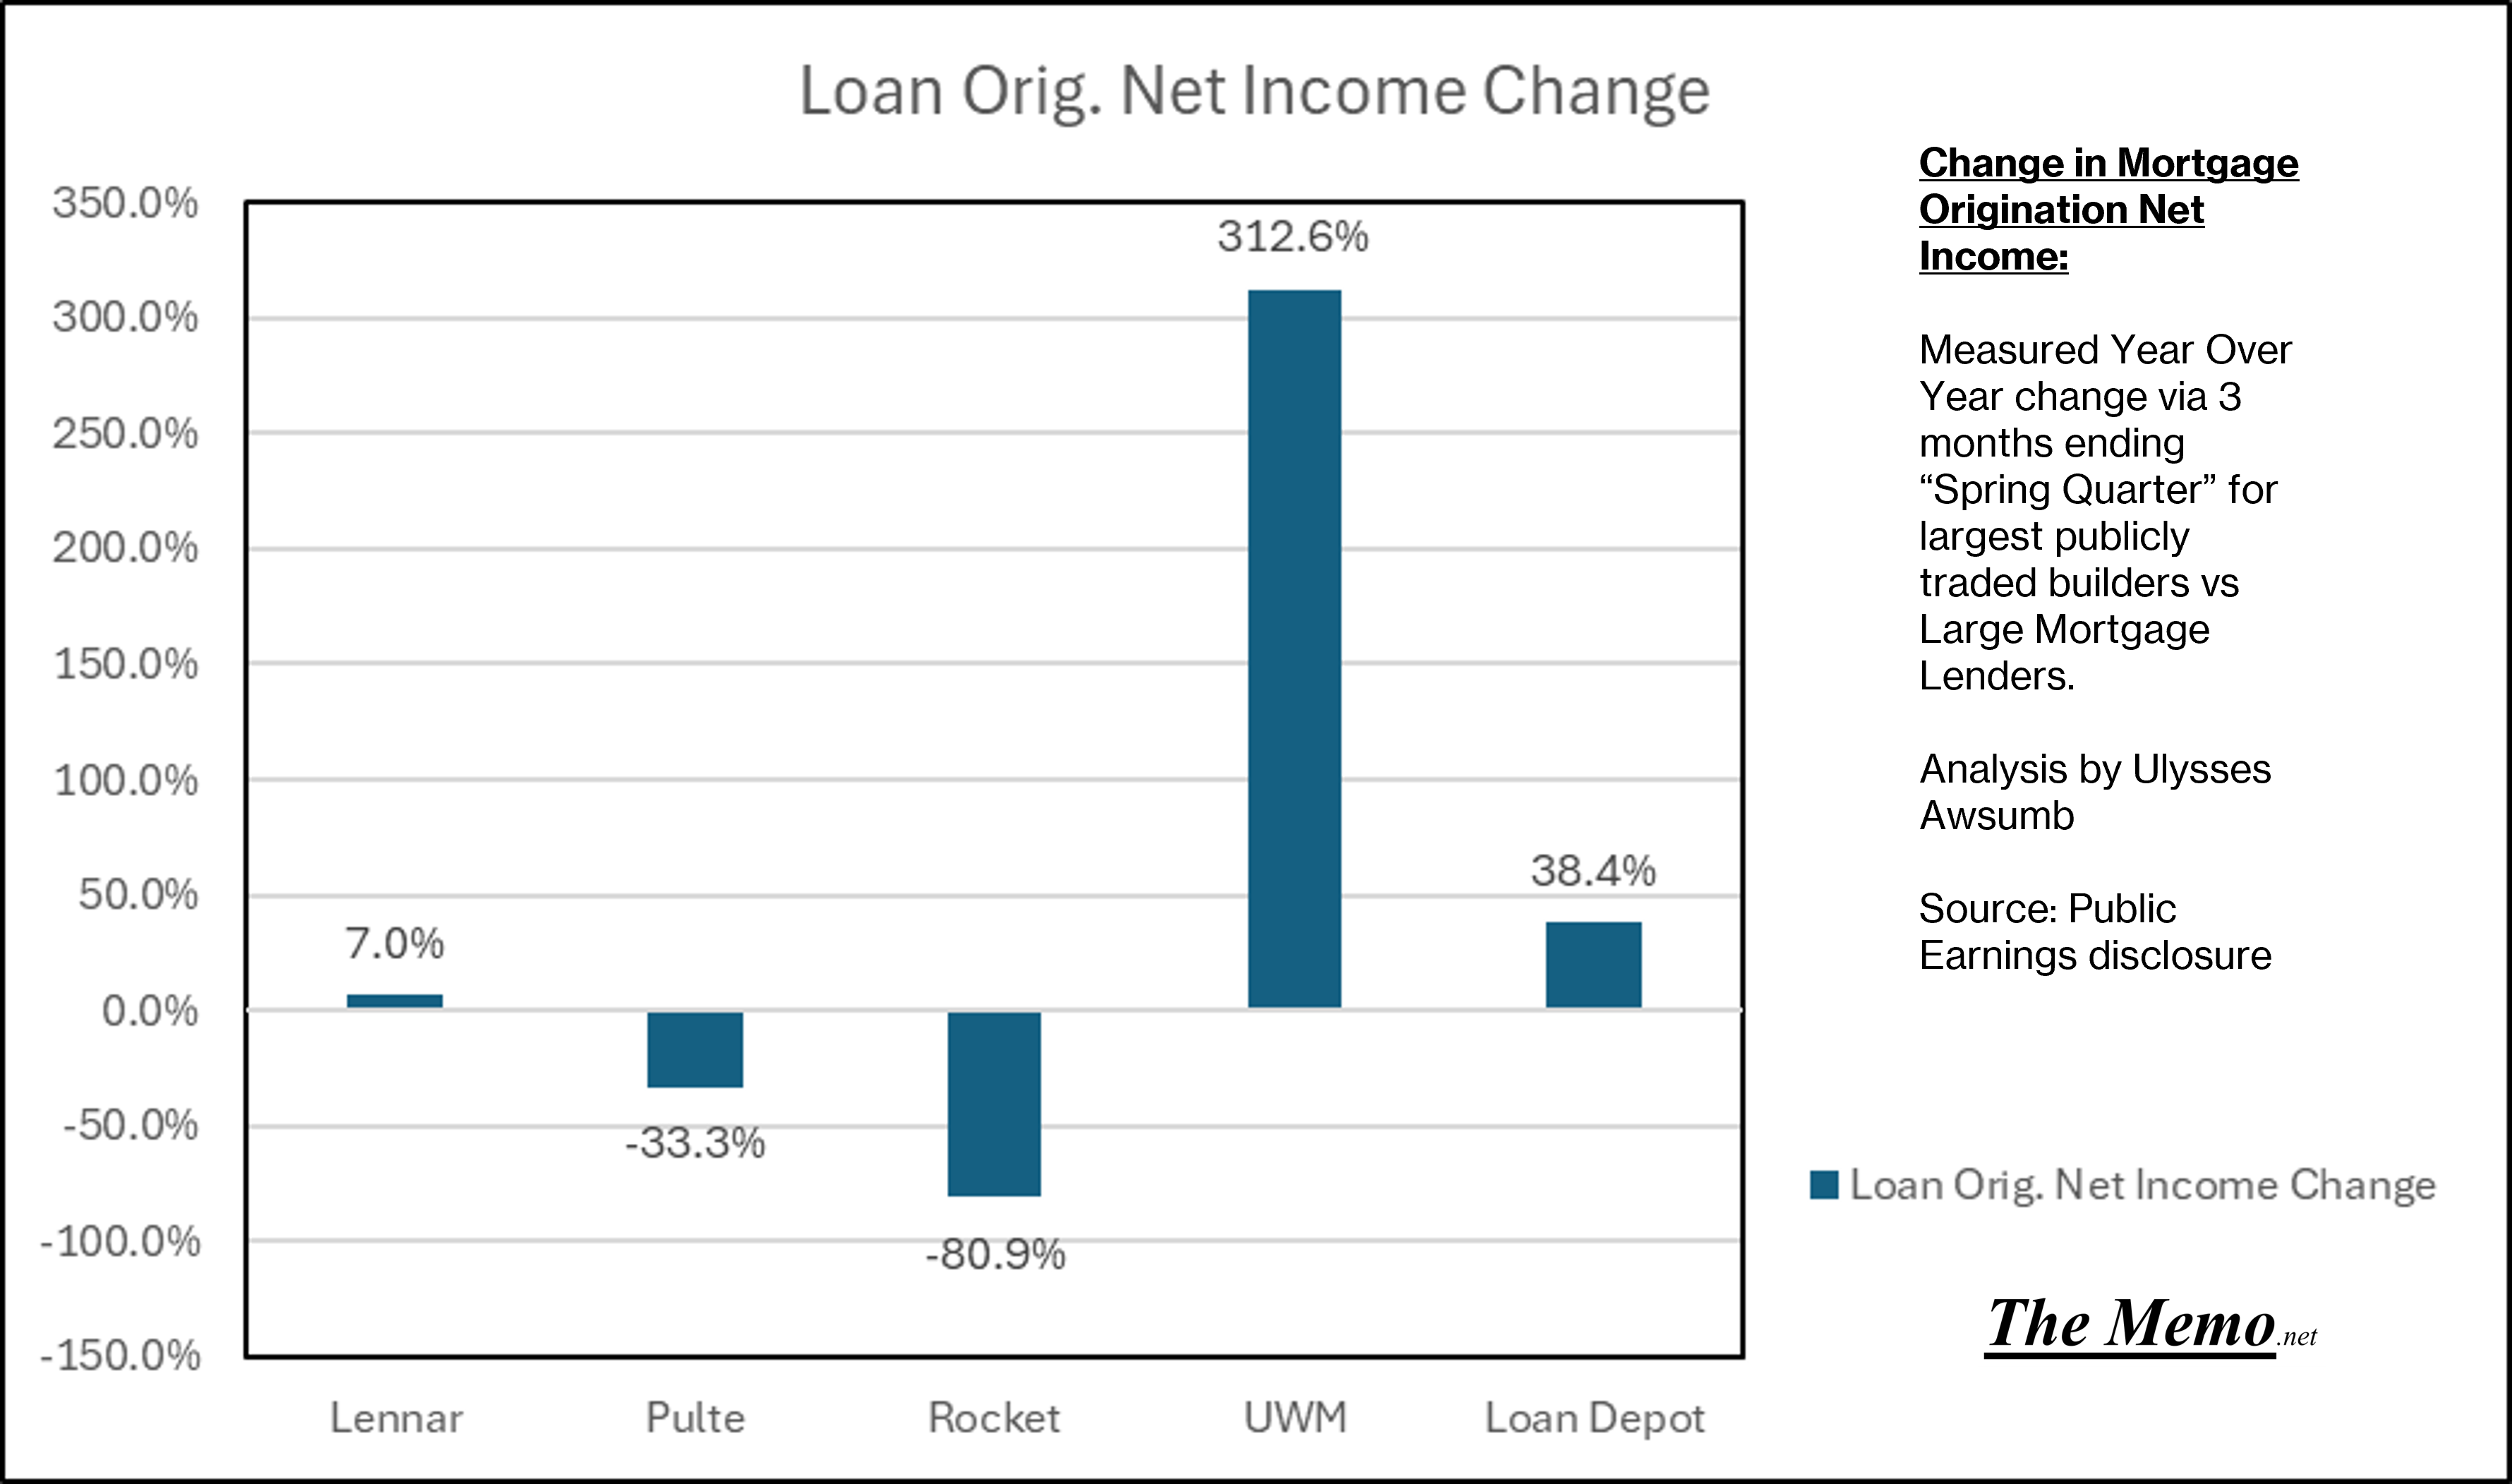
While Lennar and Pulte netted more income than all but UWM on the quarter in loan originations.
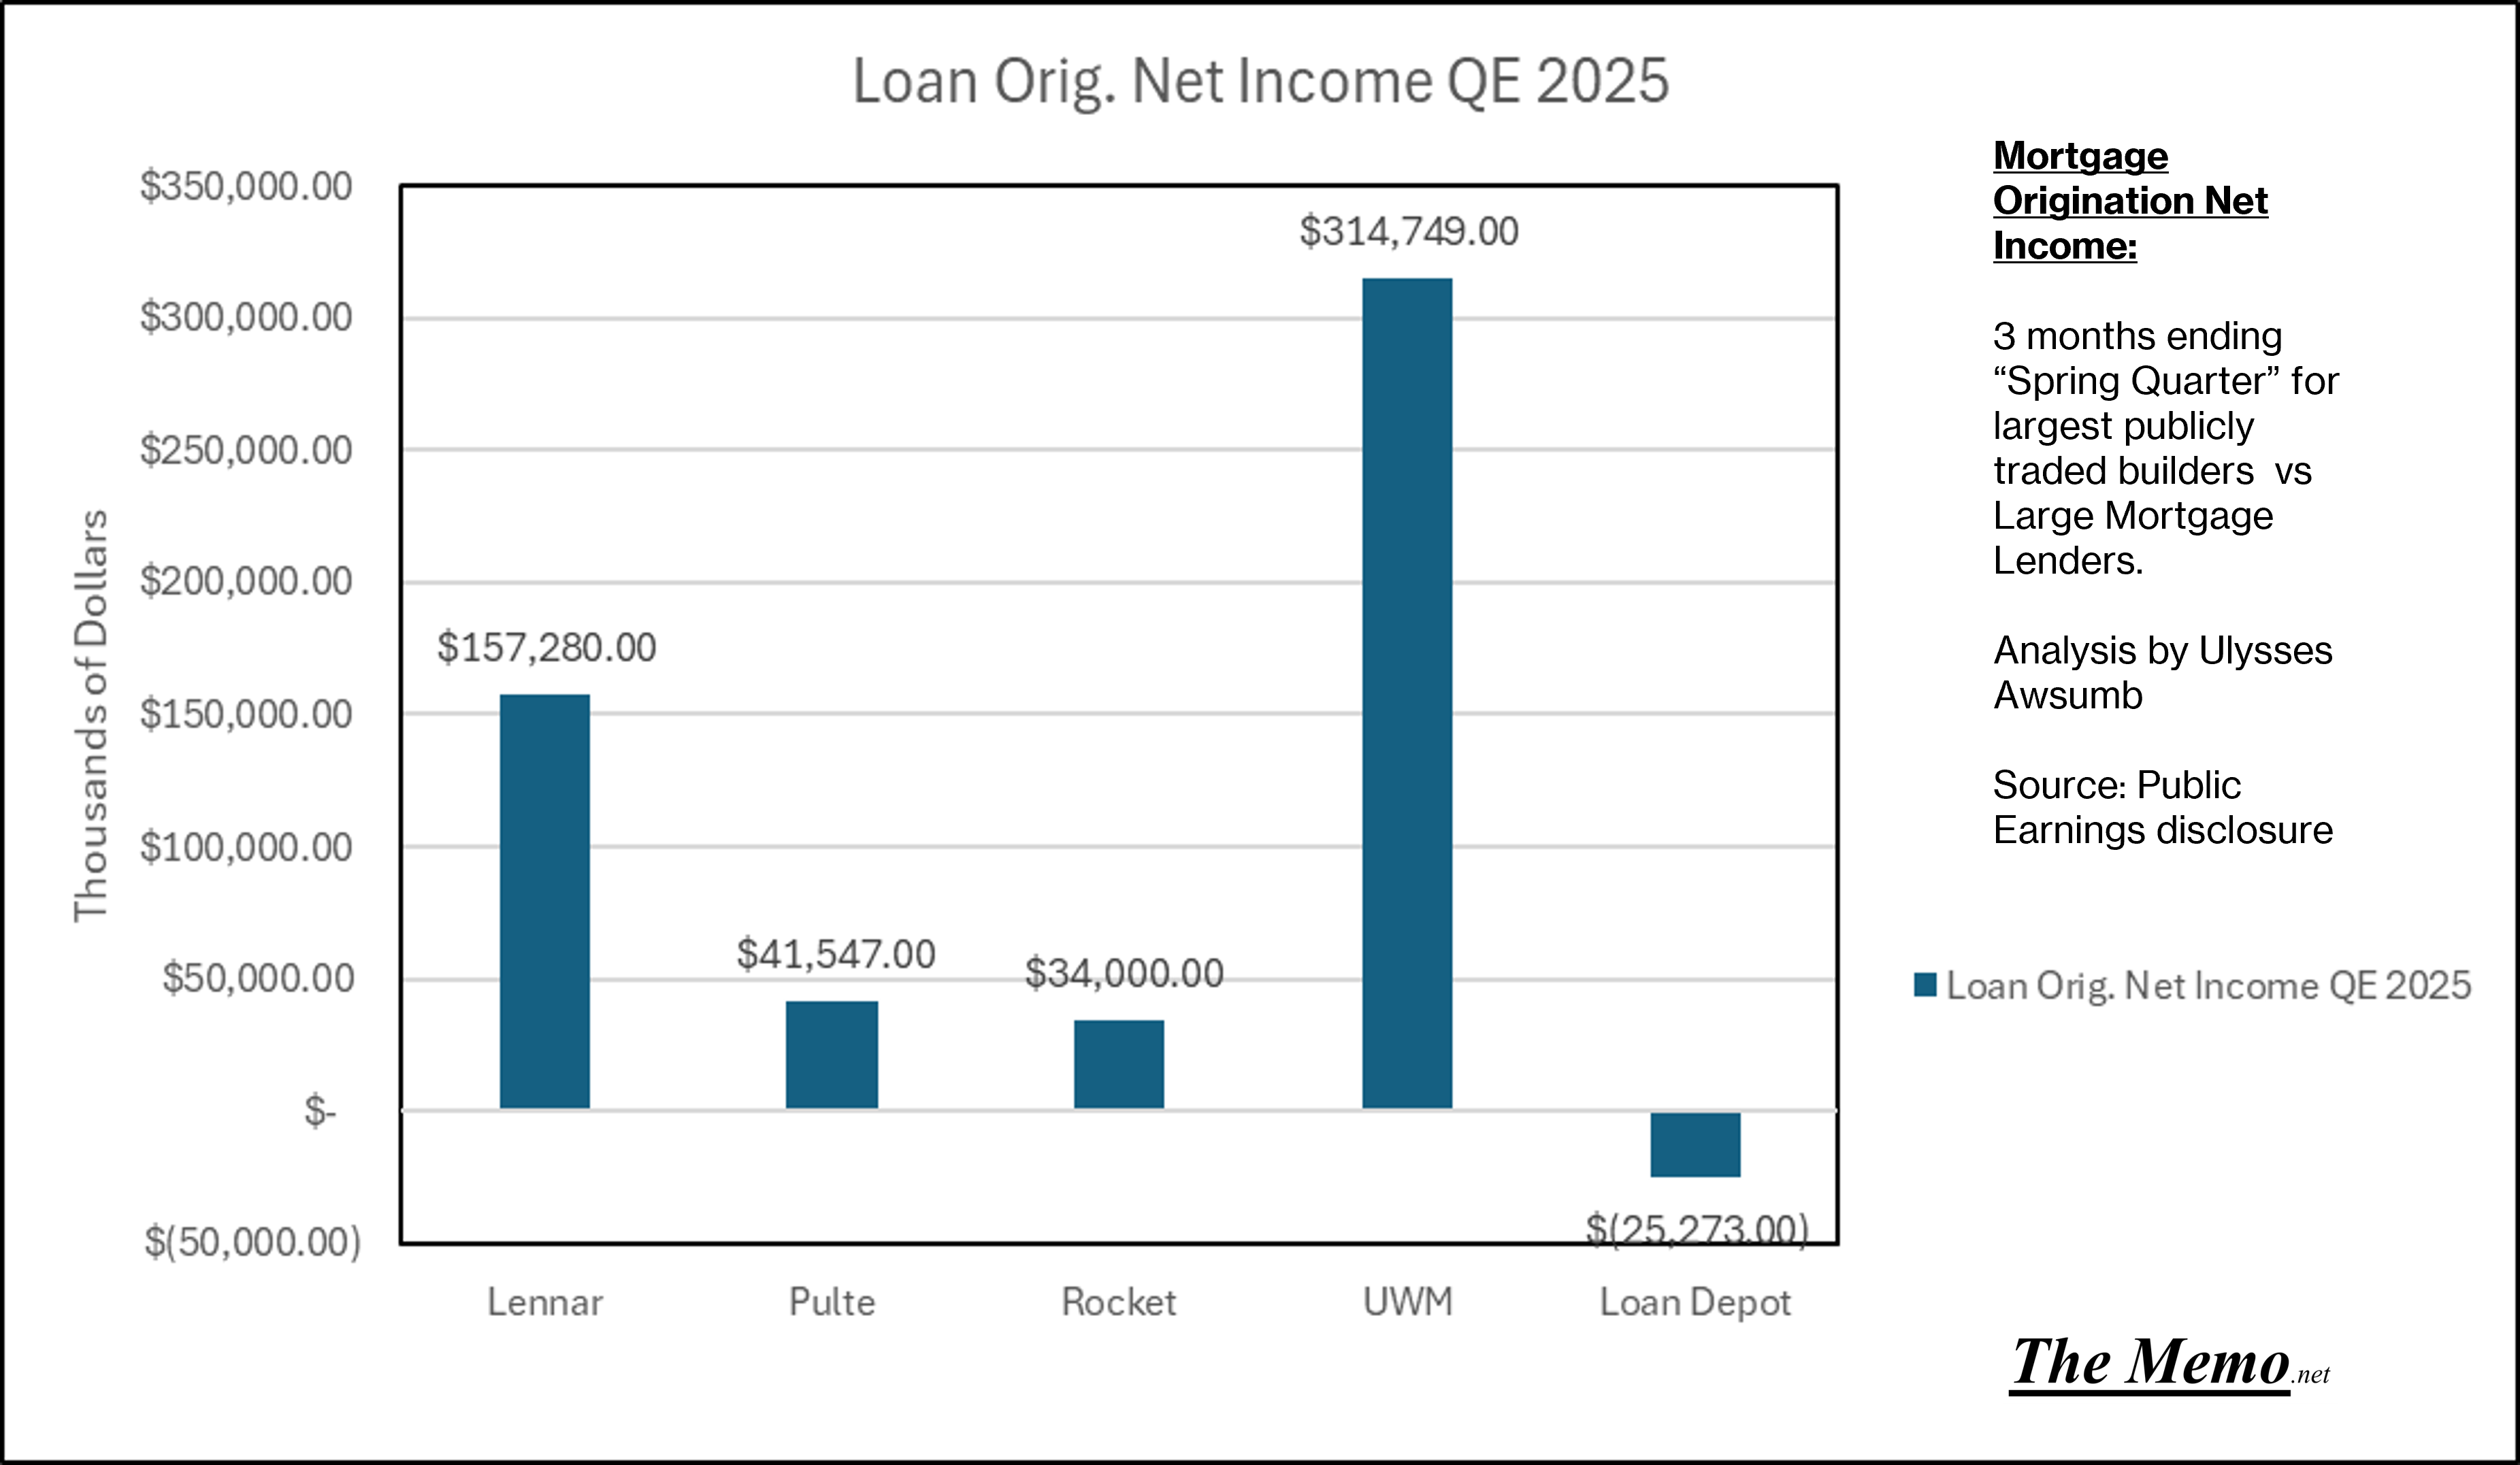
But it hasn’t been all roses for any of them.
Rocket is reporting YTD losses:
Loan Depot can’t seem to make money":
and UWM just came off a big loss in Q1.
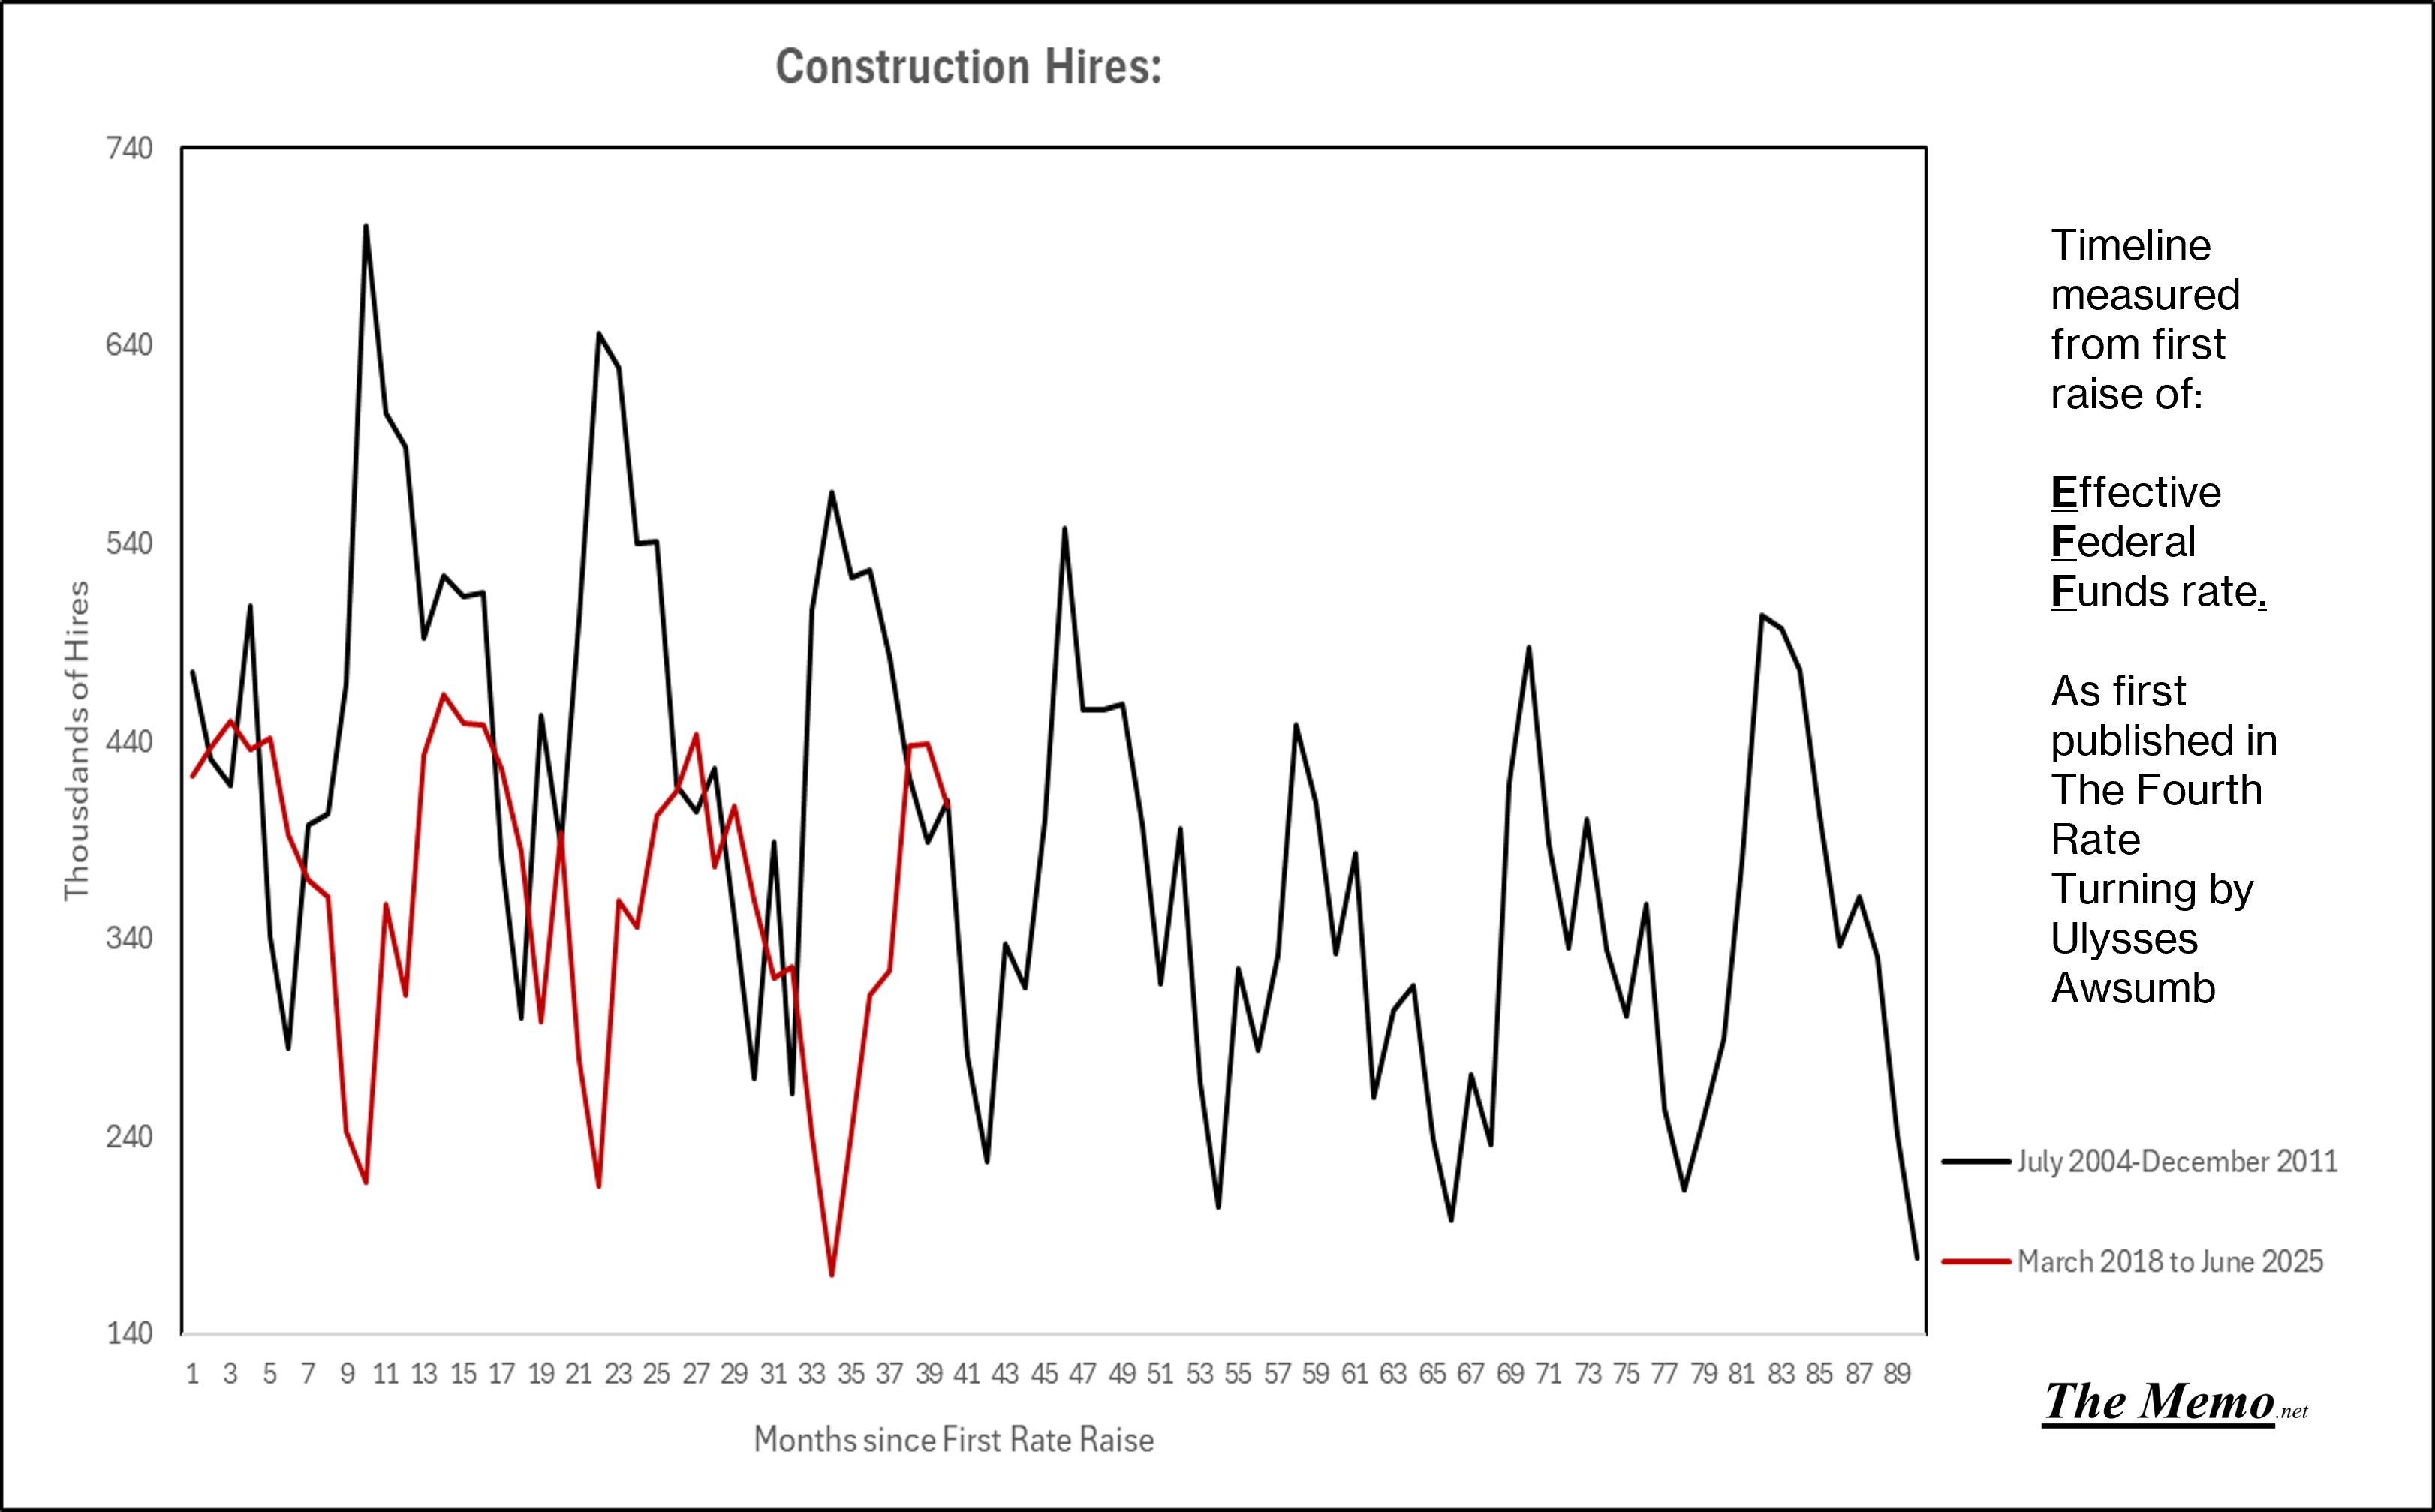
Jobs
Meanwhile construction hires continue to trend inline with 2004-2001.
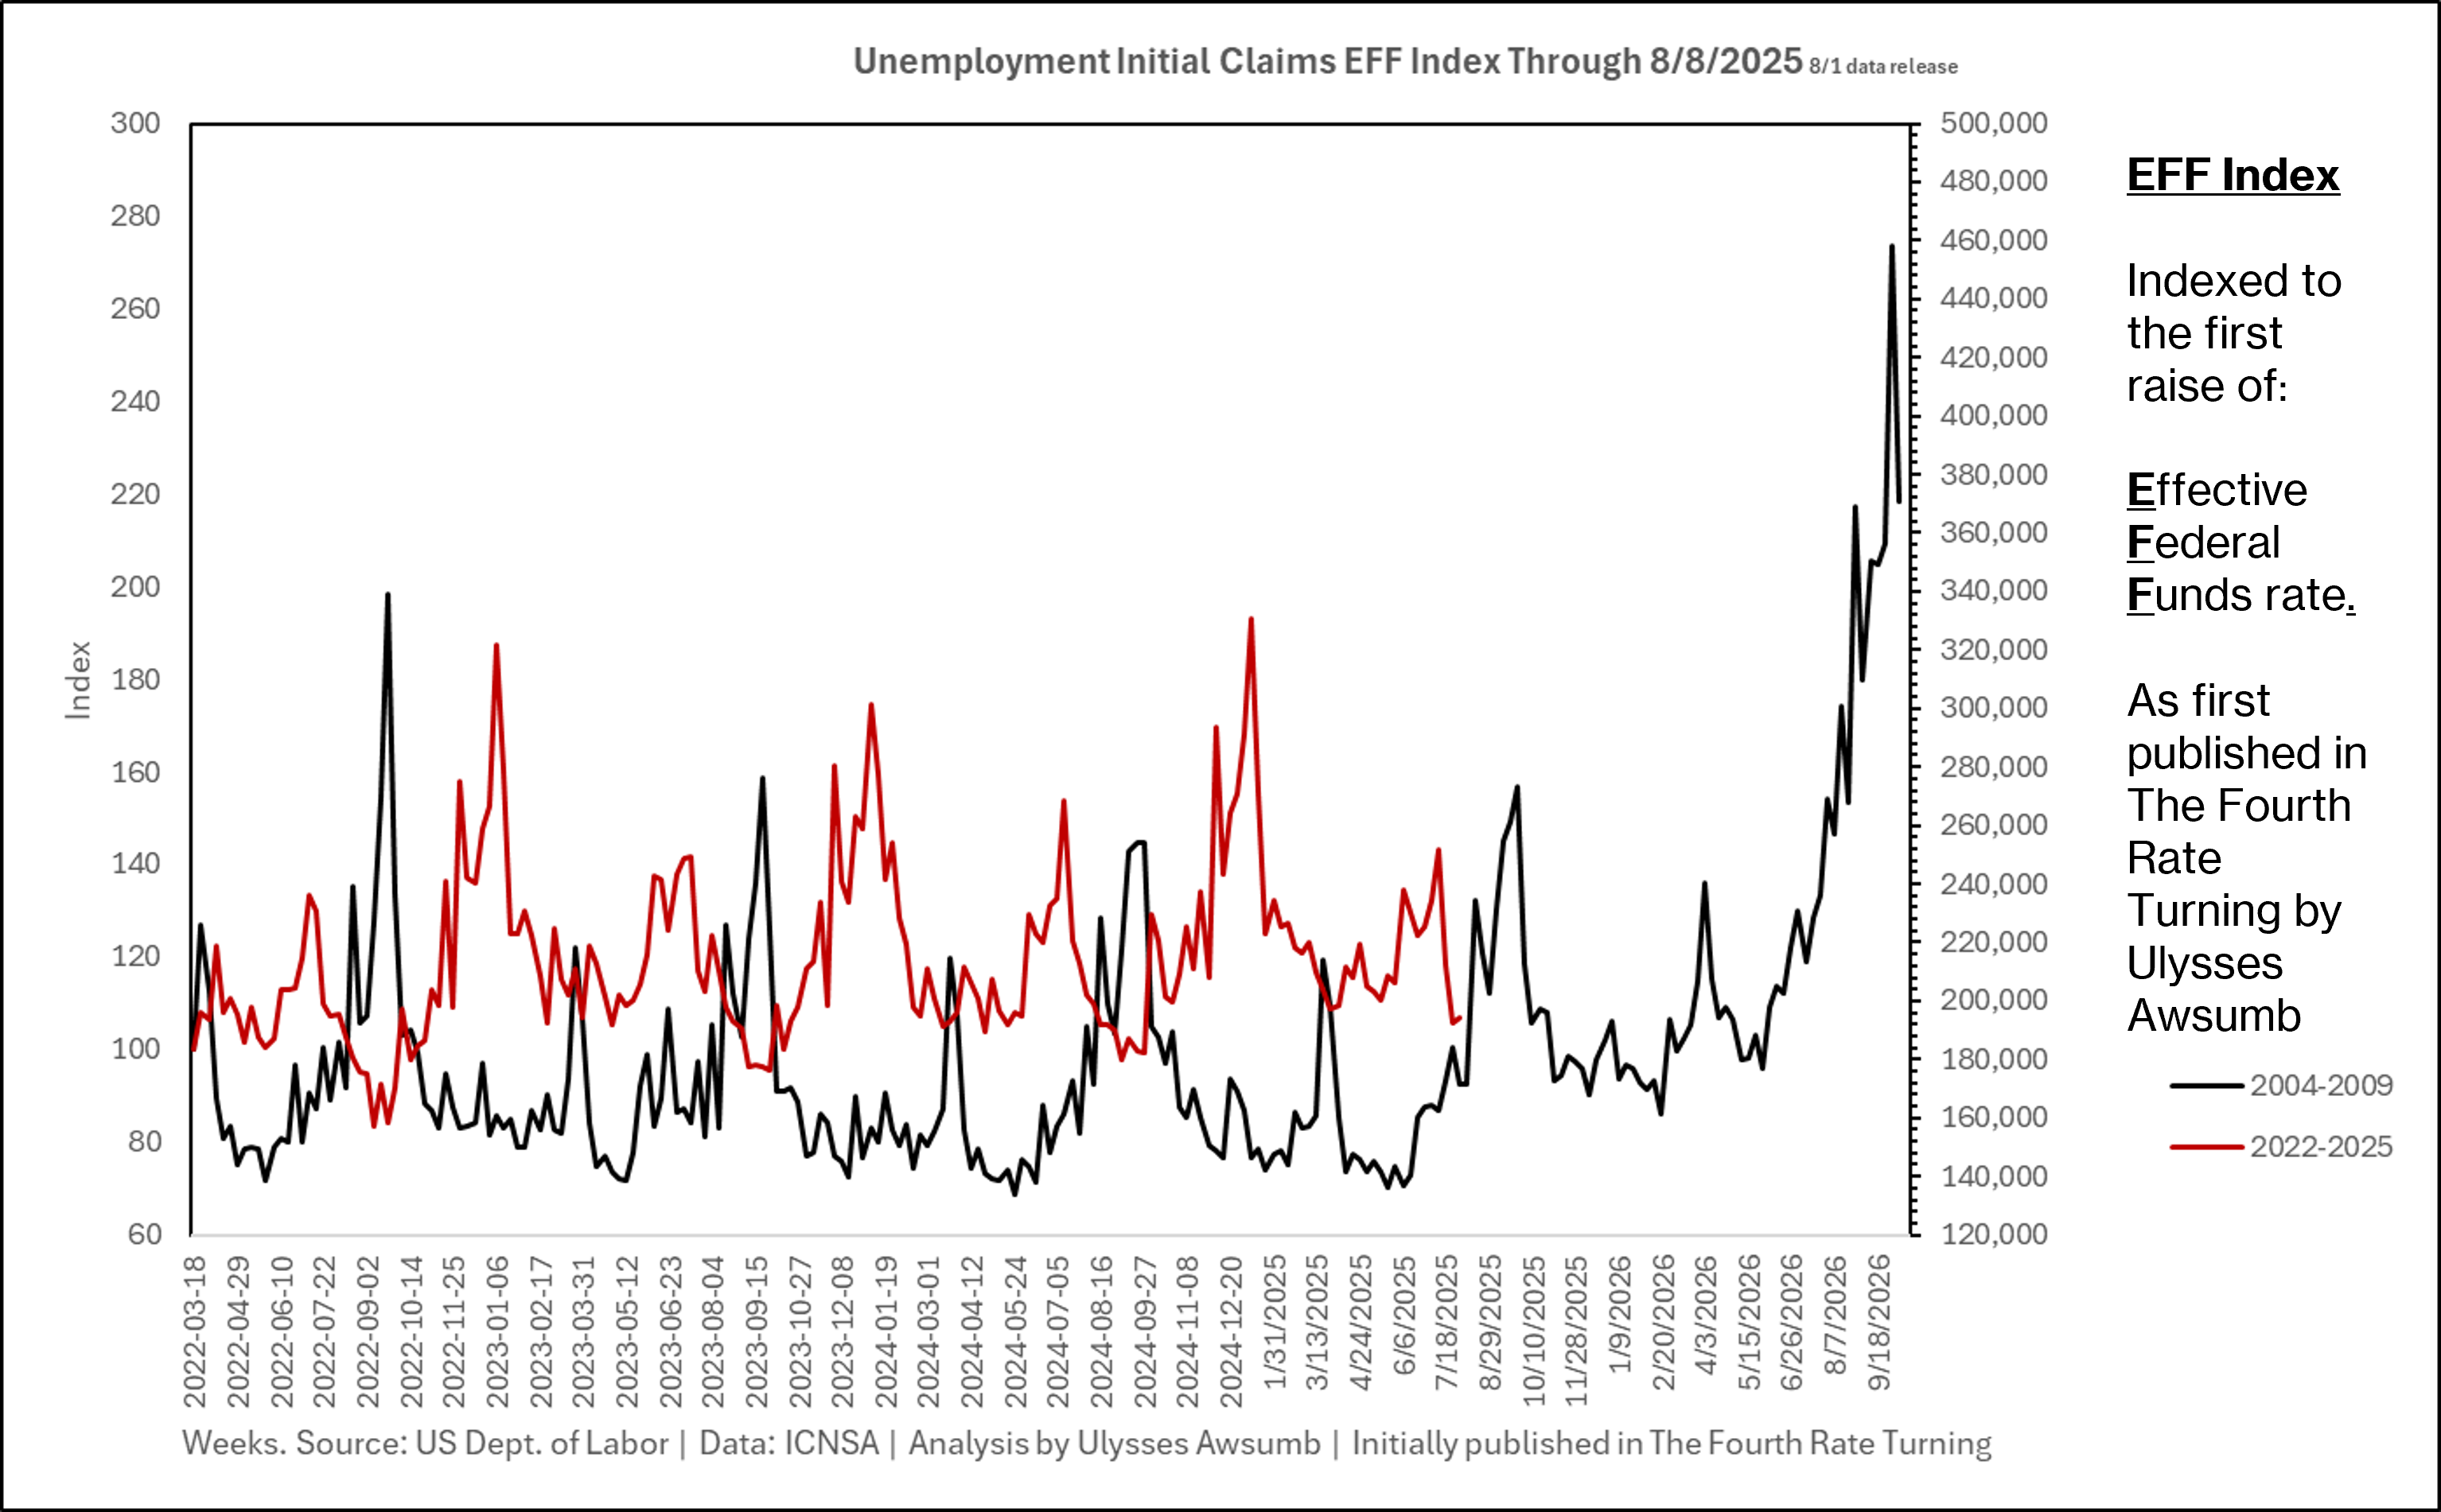
And Initial Unemployment Claims nearing it’s springboard.
Swiss Chocola…gold
Come Mr. Tarrif Man Tariff me banana
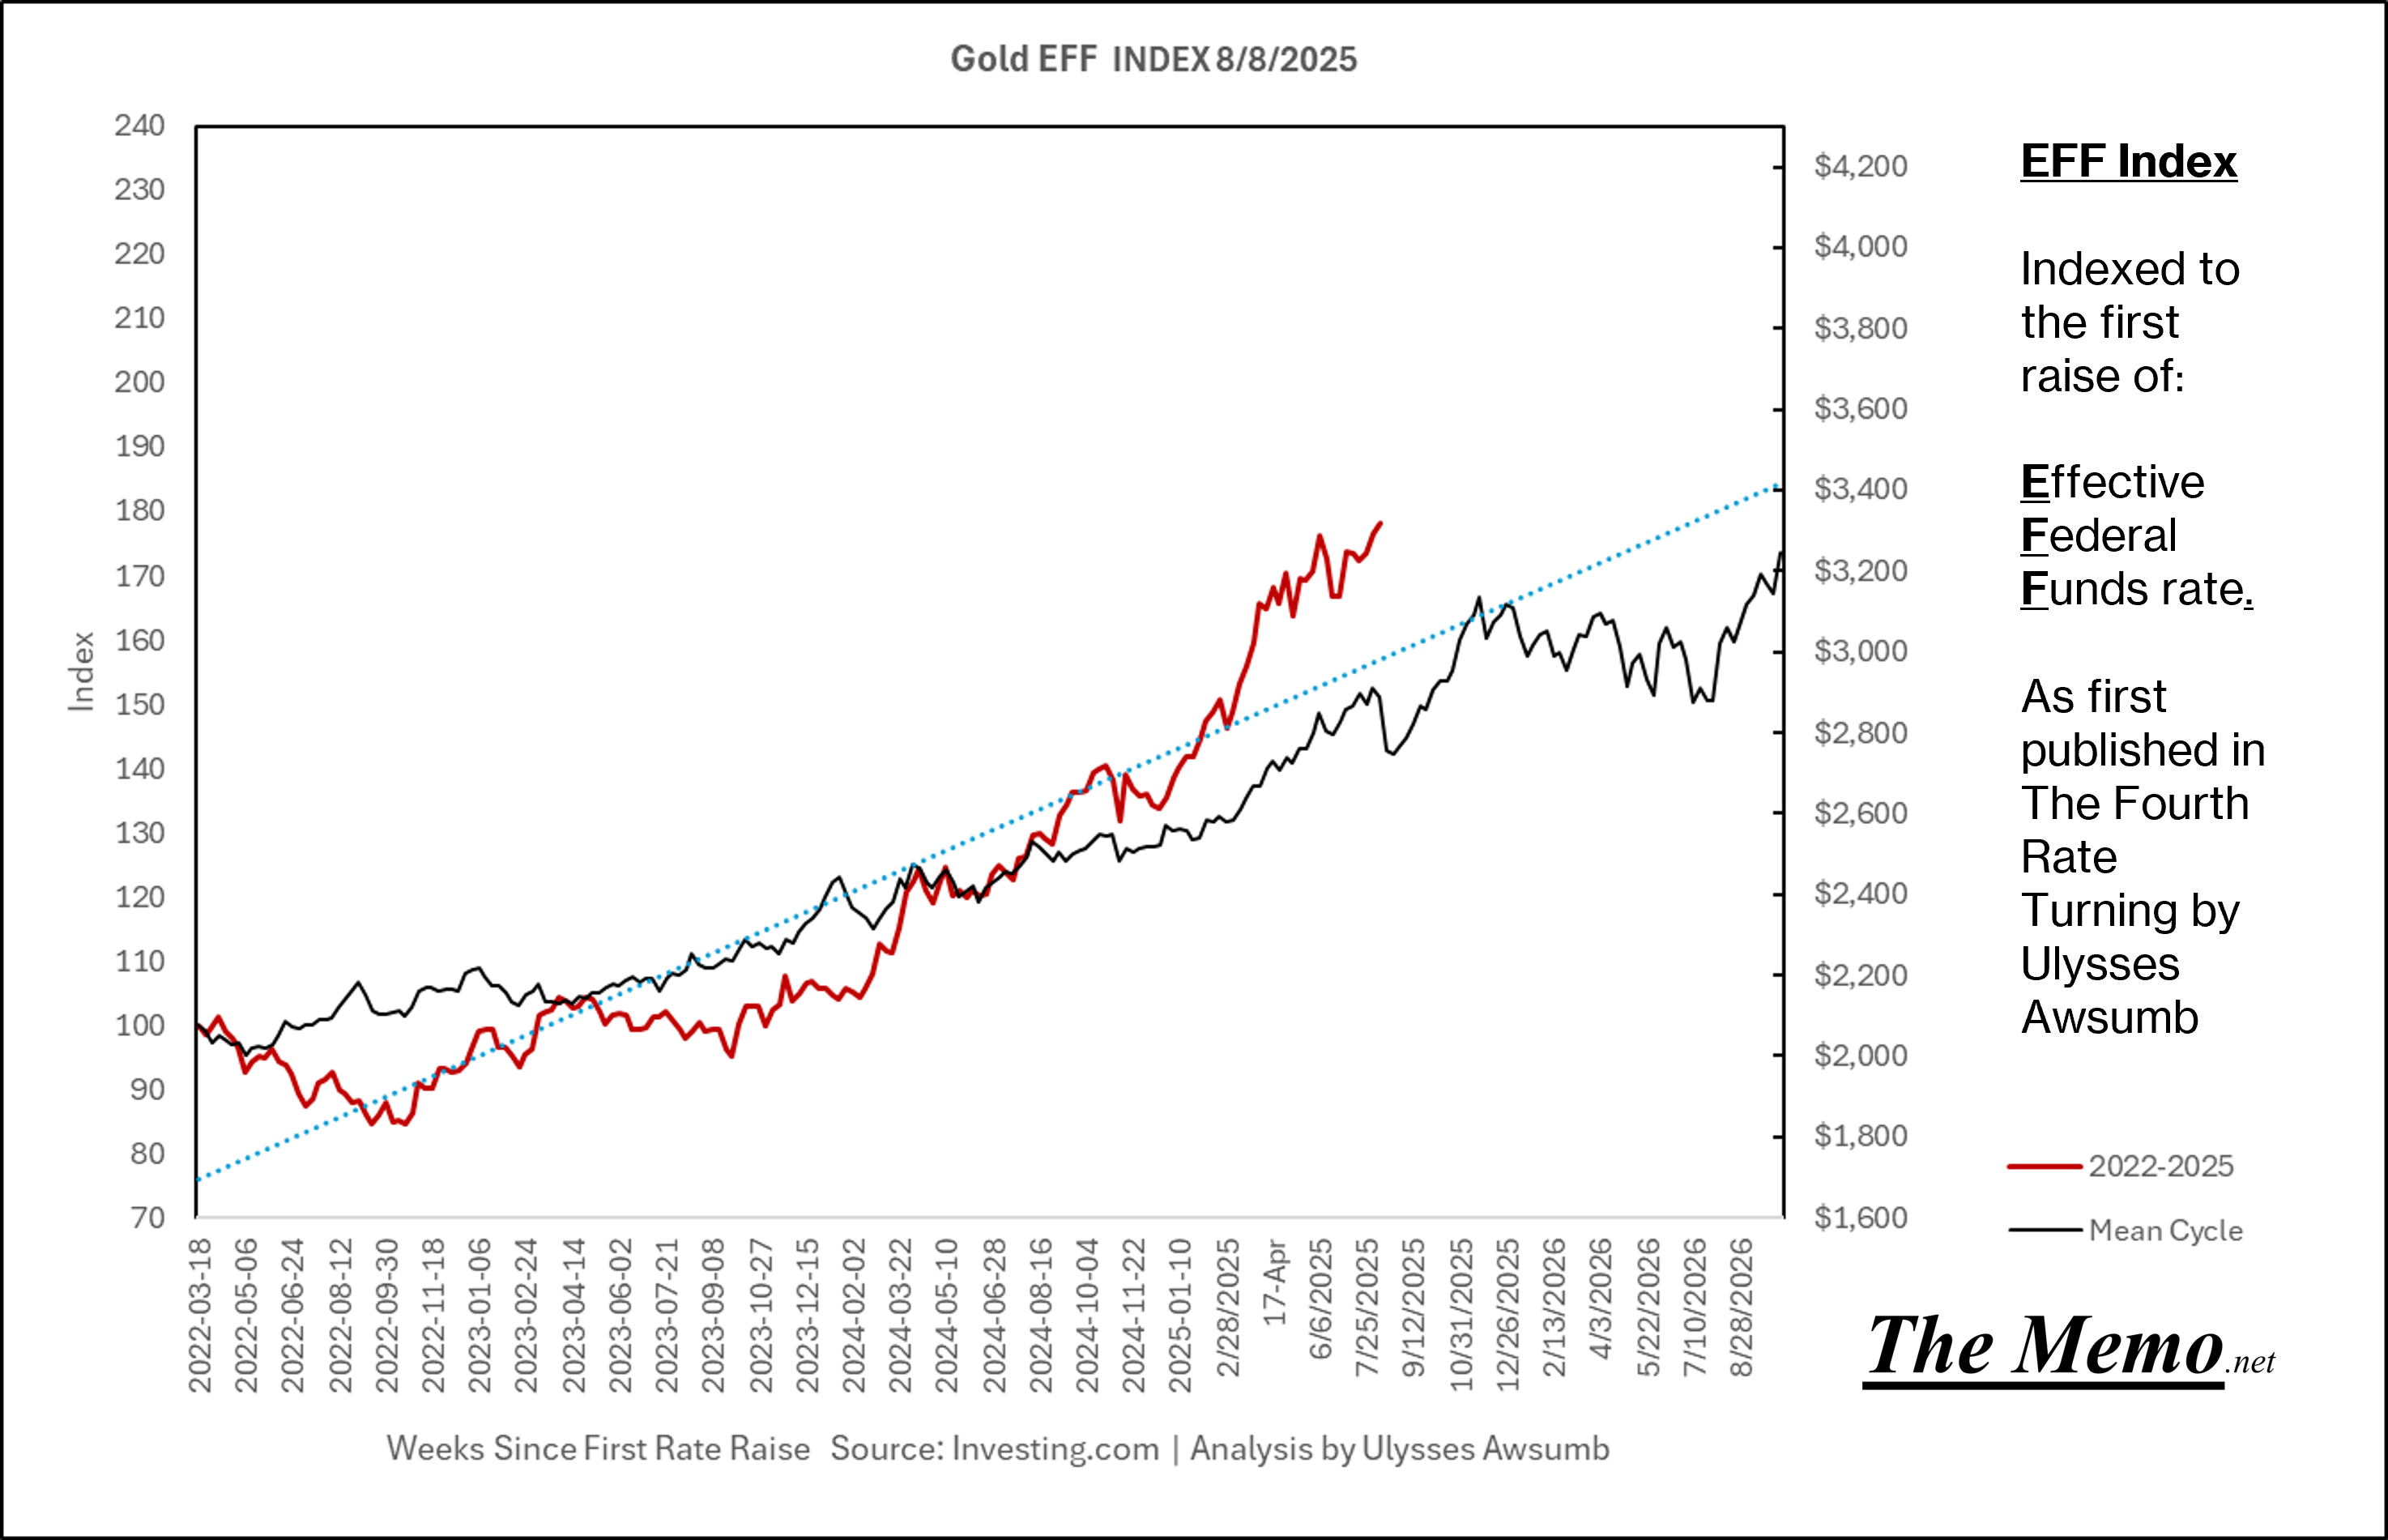
Daylight come and me wanna go home.

Making money
Someone needs to start offering to take builder inventory off their hands at a healthy discount. August will likely be a decent month as it typical is, seeing closings before school years kick off. After that, ask for all the goodies, and discounts.
Today in EFFing time it is:
"Okay, campers, rise and shine, and don't forget your booties 'cause it's cold out there!"
"It's cold out there every day. What is this, Miami Beach?"

Thank you for posting this! I think PE is starting to buy that inventory as a build to rent model and even control the HOA.