

Friday EFFing Memo
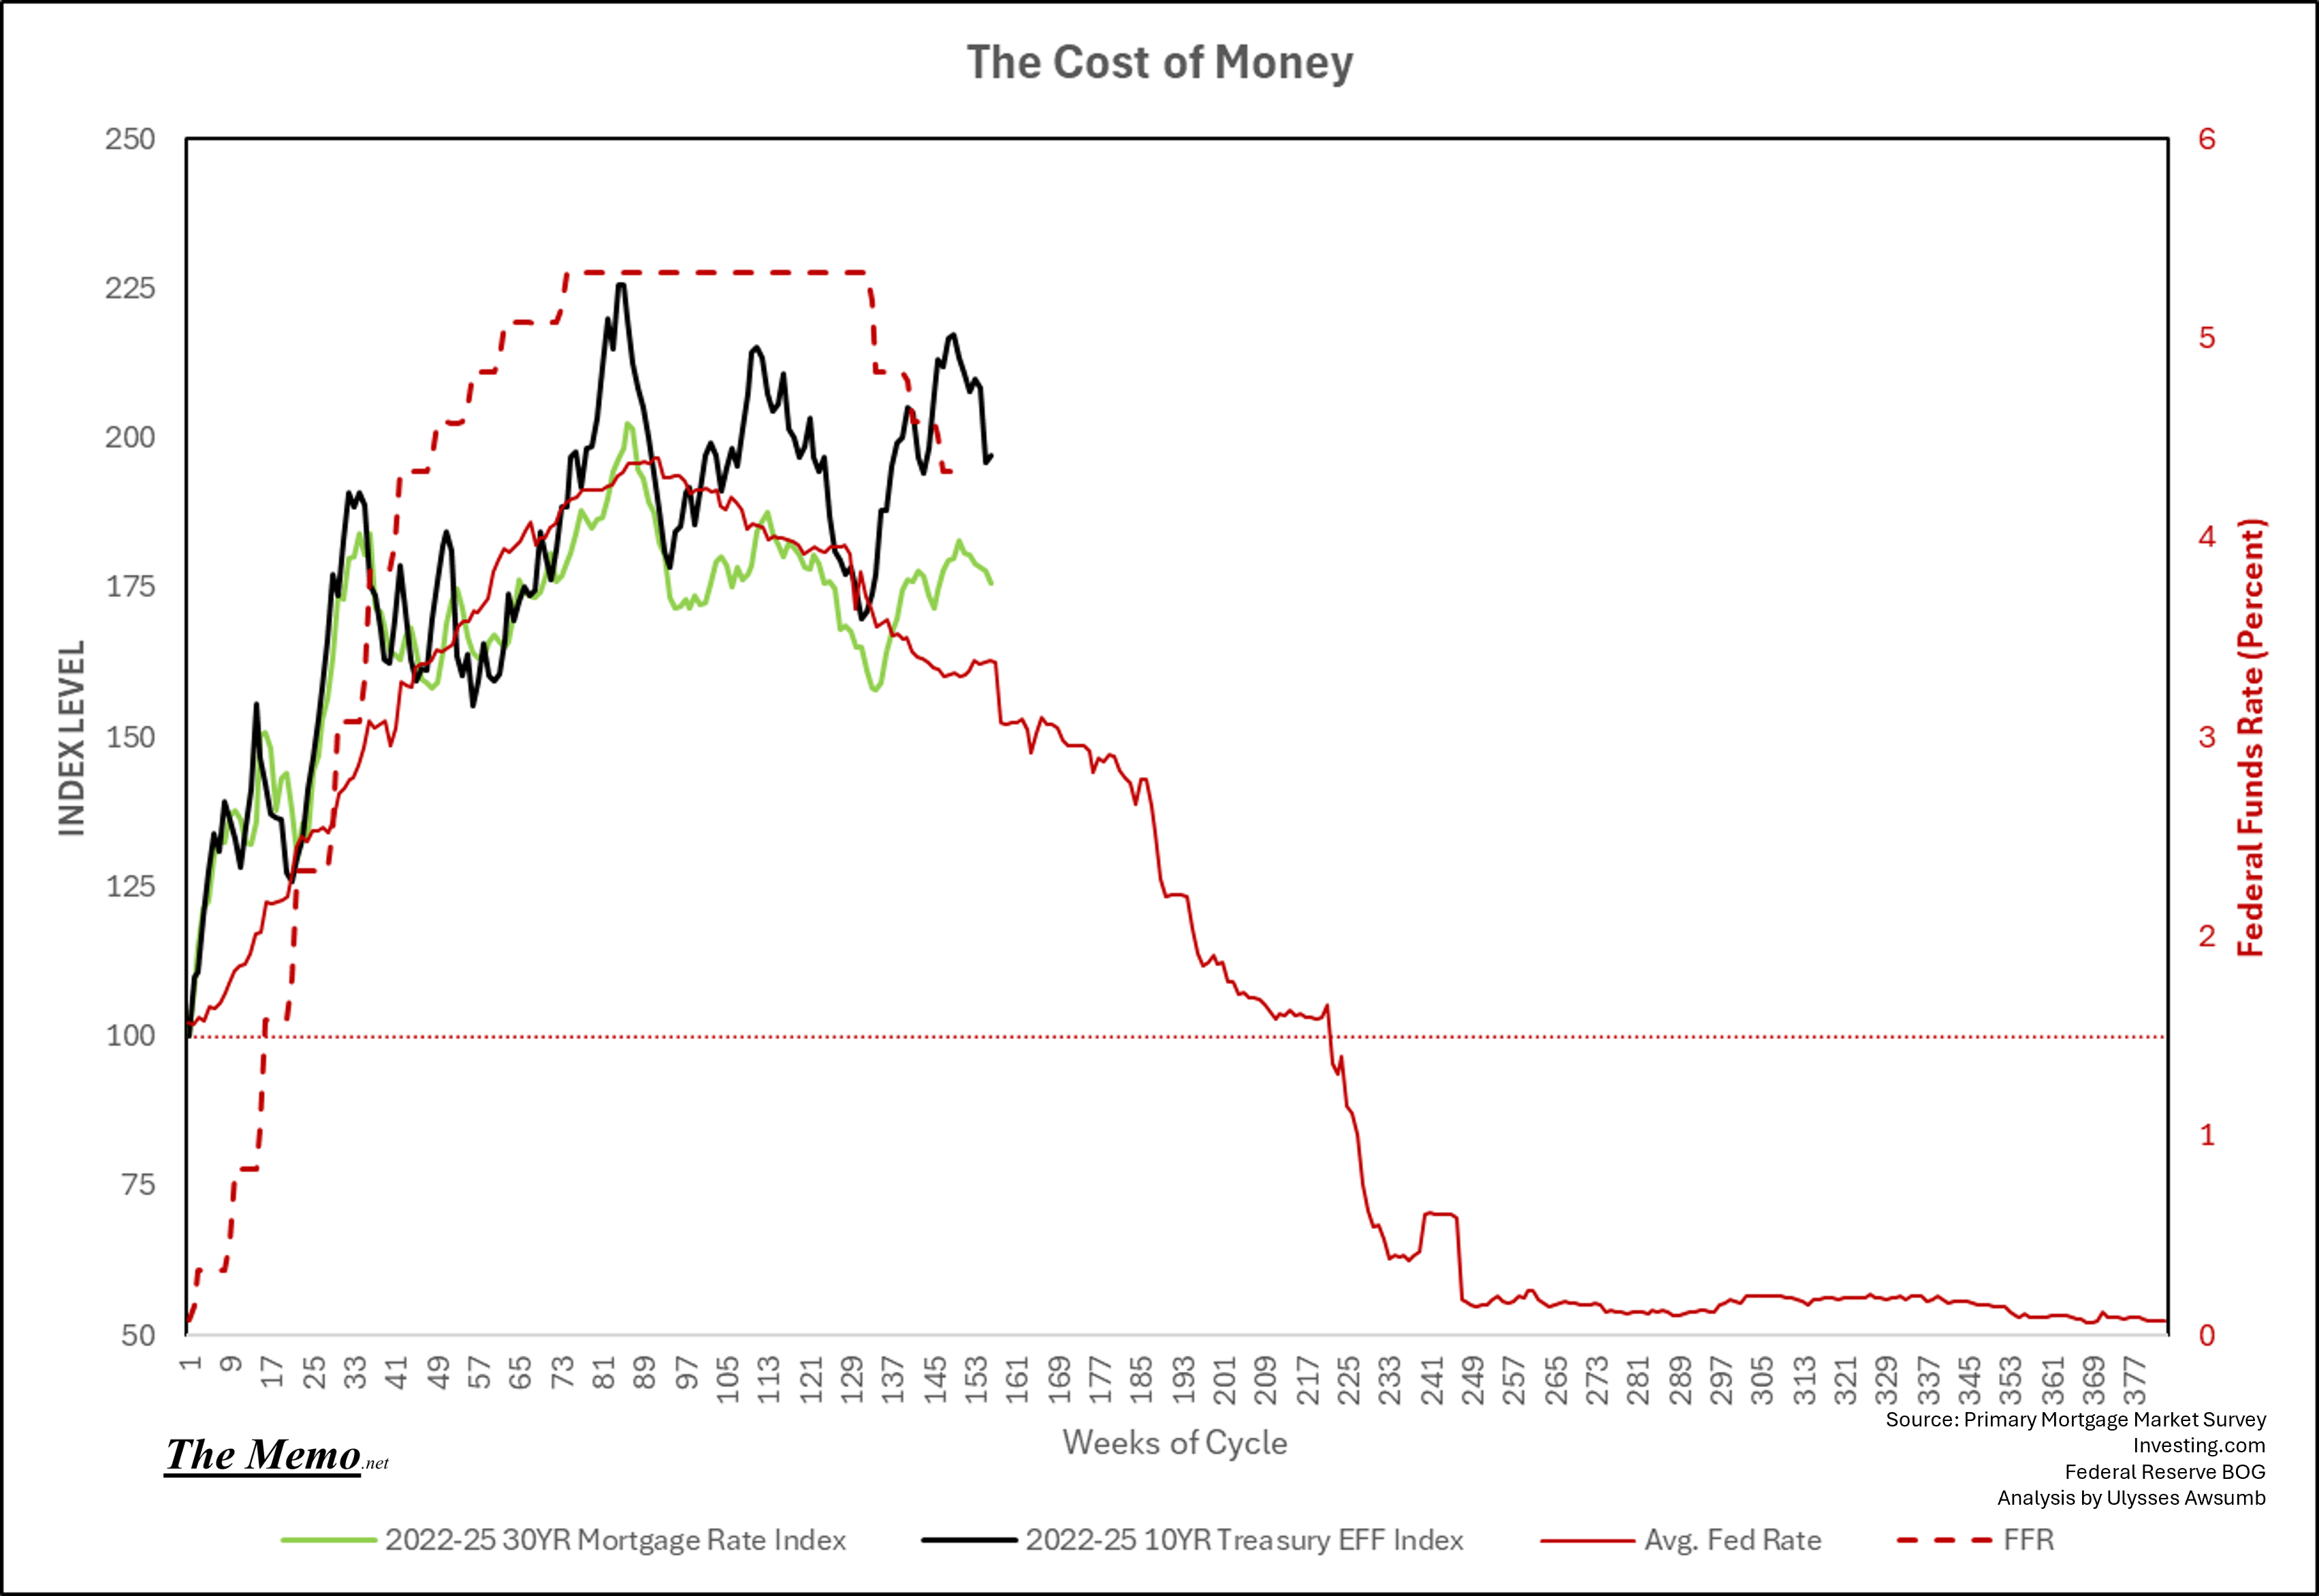
The Cost of Money

The Memo:
To:
Everyone
Re:
Mortgage Rates and Treasury Yields
Equities
Diesel/Gasoline/Natural Gas
Currencies
A very important discovery
Comments:
The Days are long but the years are short. This simple phrase is profoundly true. We can all look back in amazement at how quickly the years have passed from a fond memory we have, while at the same time, weeks like the last two can seem an eternity, waiting to see what happens in markets, economics or government.
Einstein’s Theory of Relativity rations that the rate at which time passes depends on your frame of reference. The notion being you can actually speed up or slow down time based on how fast one travels. The effect is called time dilation.
I point it out because our main objective here, is time as a tool. That measure of time, or our “frame of reference” is the the periods between the first raise of Federal Funds Rates by the Fed. Reserve, and the period at which they hit their lowest afterwards.
First, this is important, as the days are long and go by, we are immersed in our daily lives, and we forget the proverbial Cthulhu as we go about our business. But that misses the point. The entire stated goal of setting “monetary policy” through raising or lowering “rates” is to slow the economy, by actually slowing the creation of money and credit.
The Fed is literally changing the COST of Money. For banks to lend to one another, who then adjust their cost of money to lend to us. Oh yeah, have you heard anyone talking about “targeting the 10 year treasury yield” lately?

I hope you didn’t think that was actually to benefit you getting lower mortgage rates.
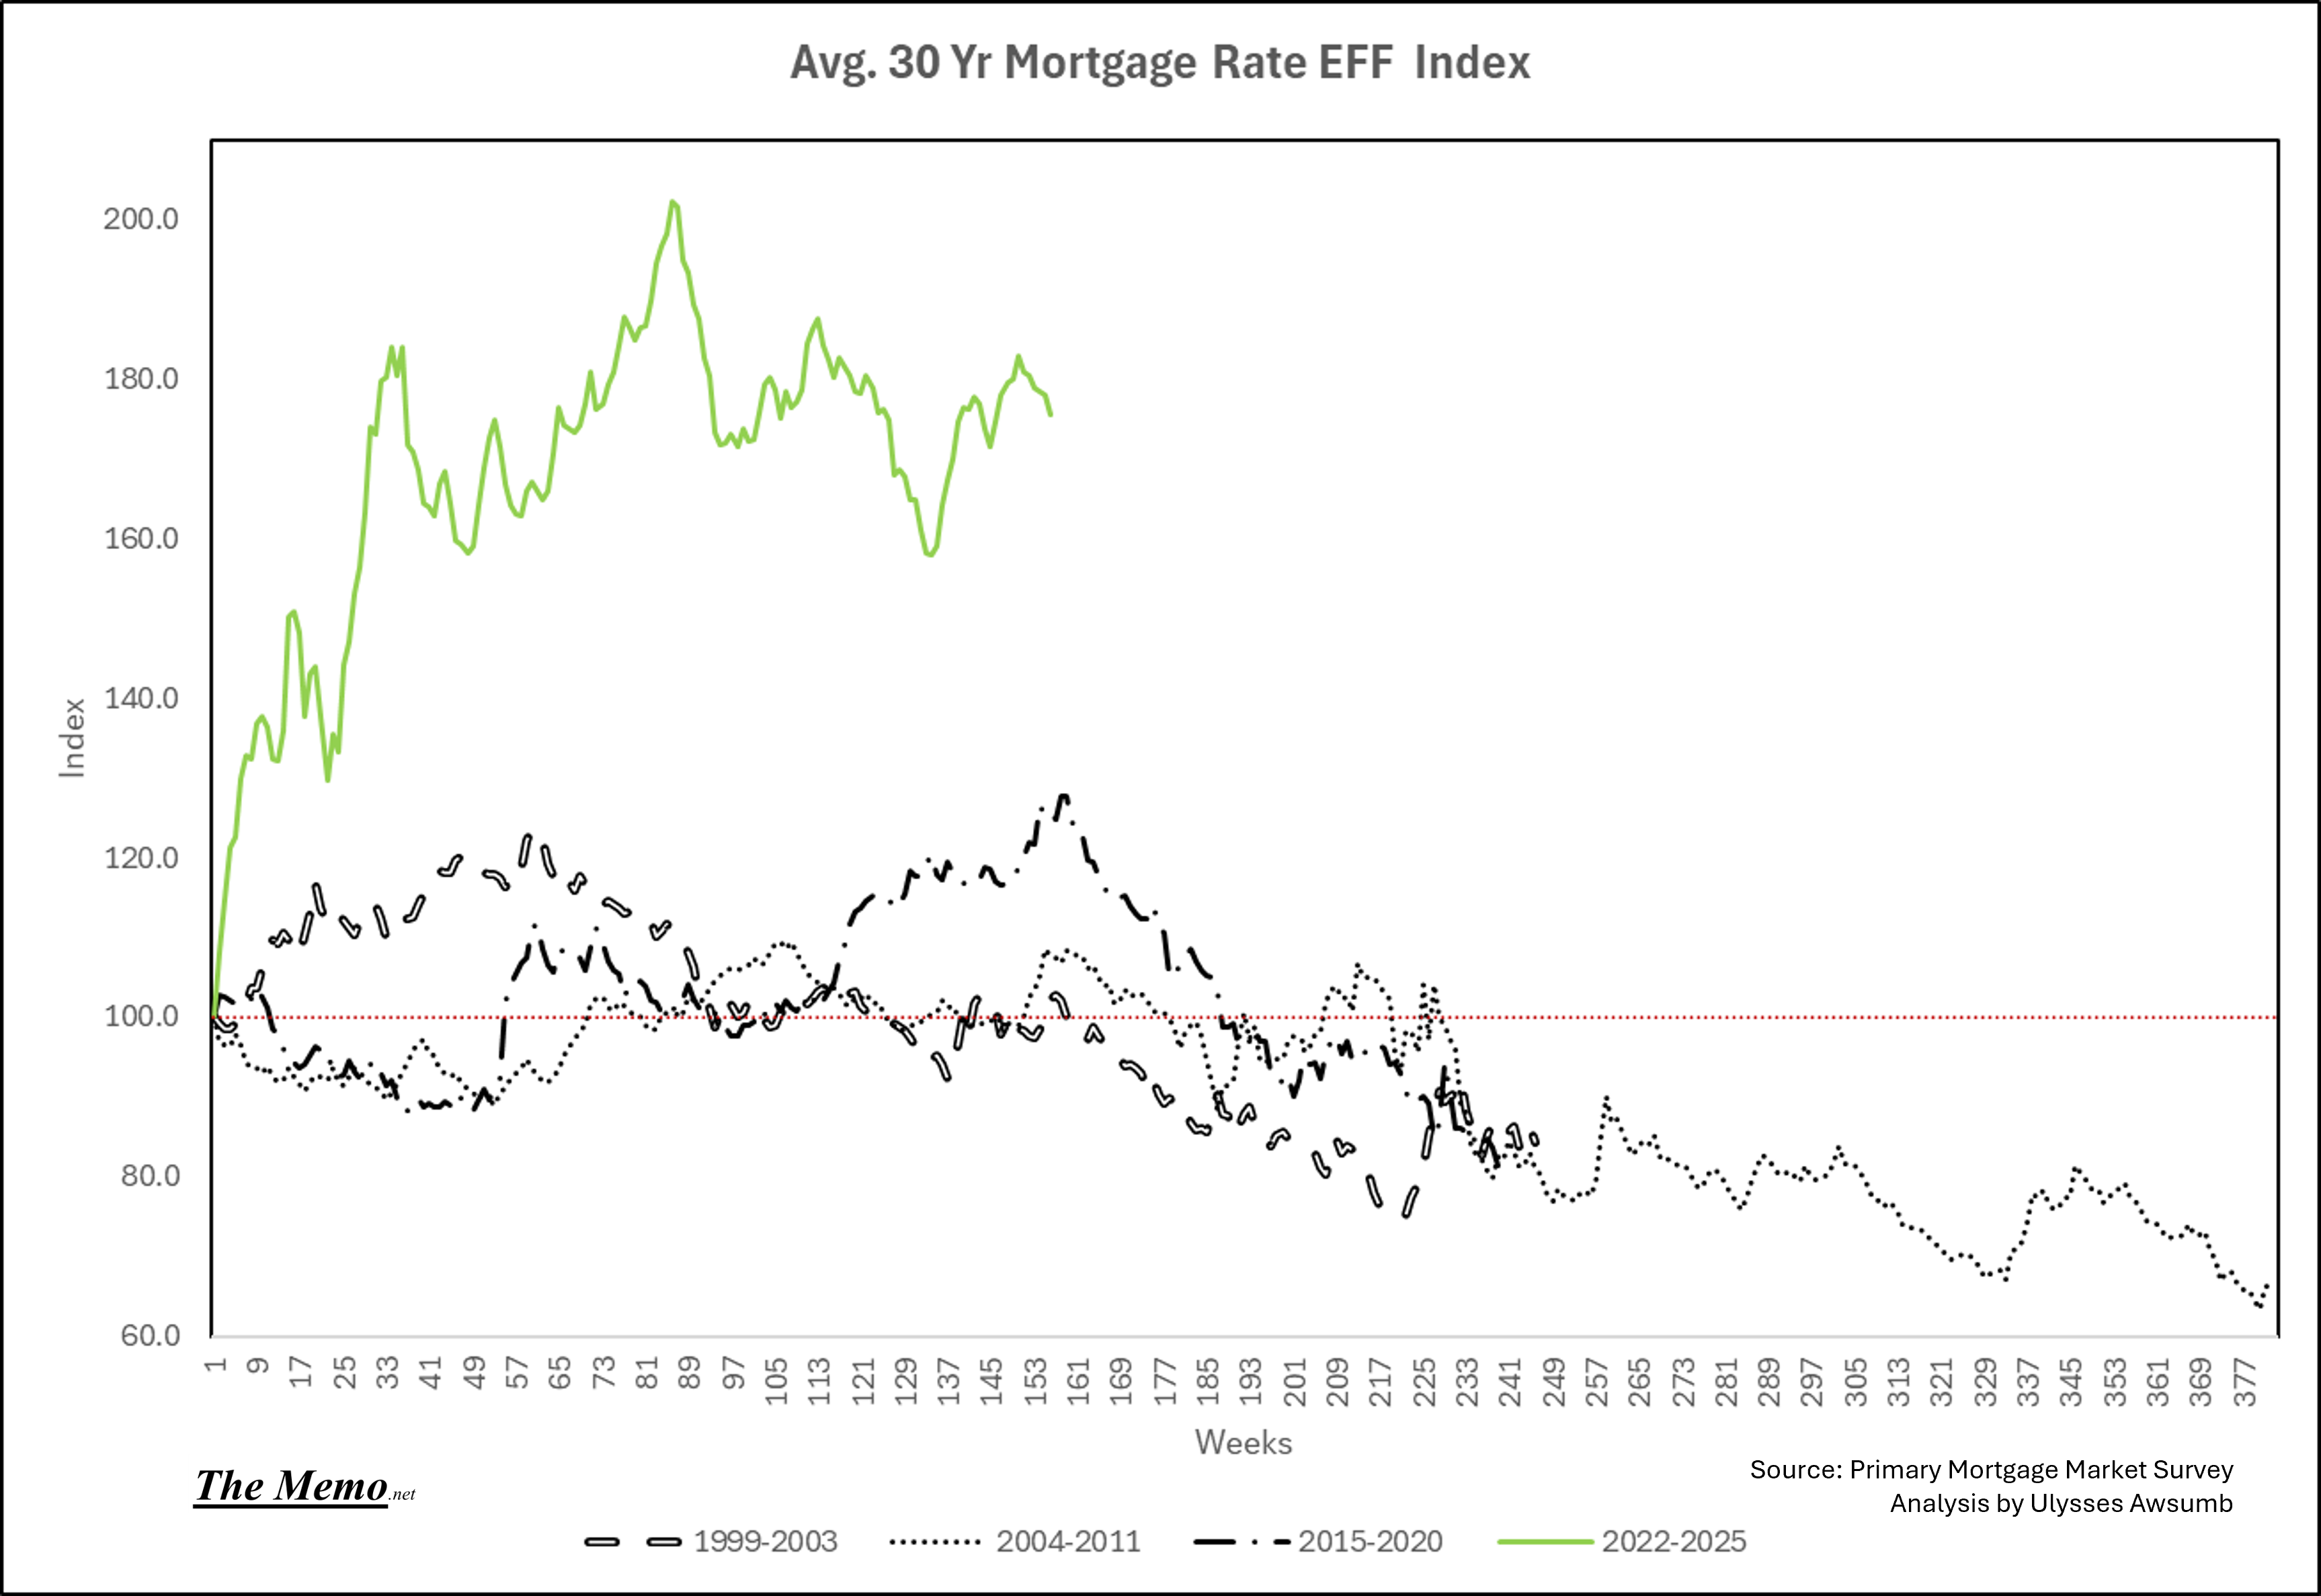
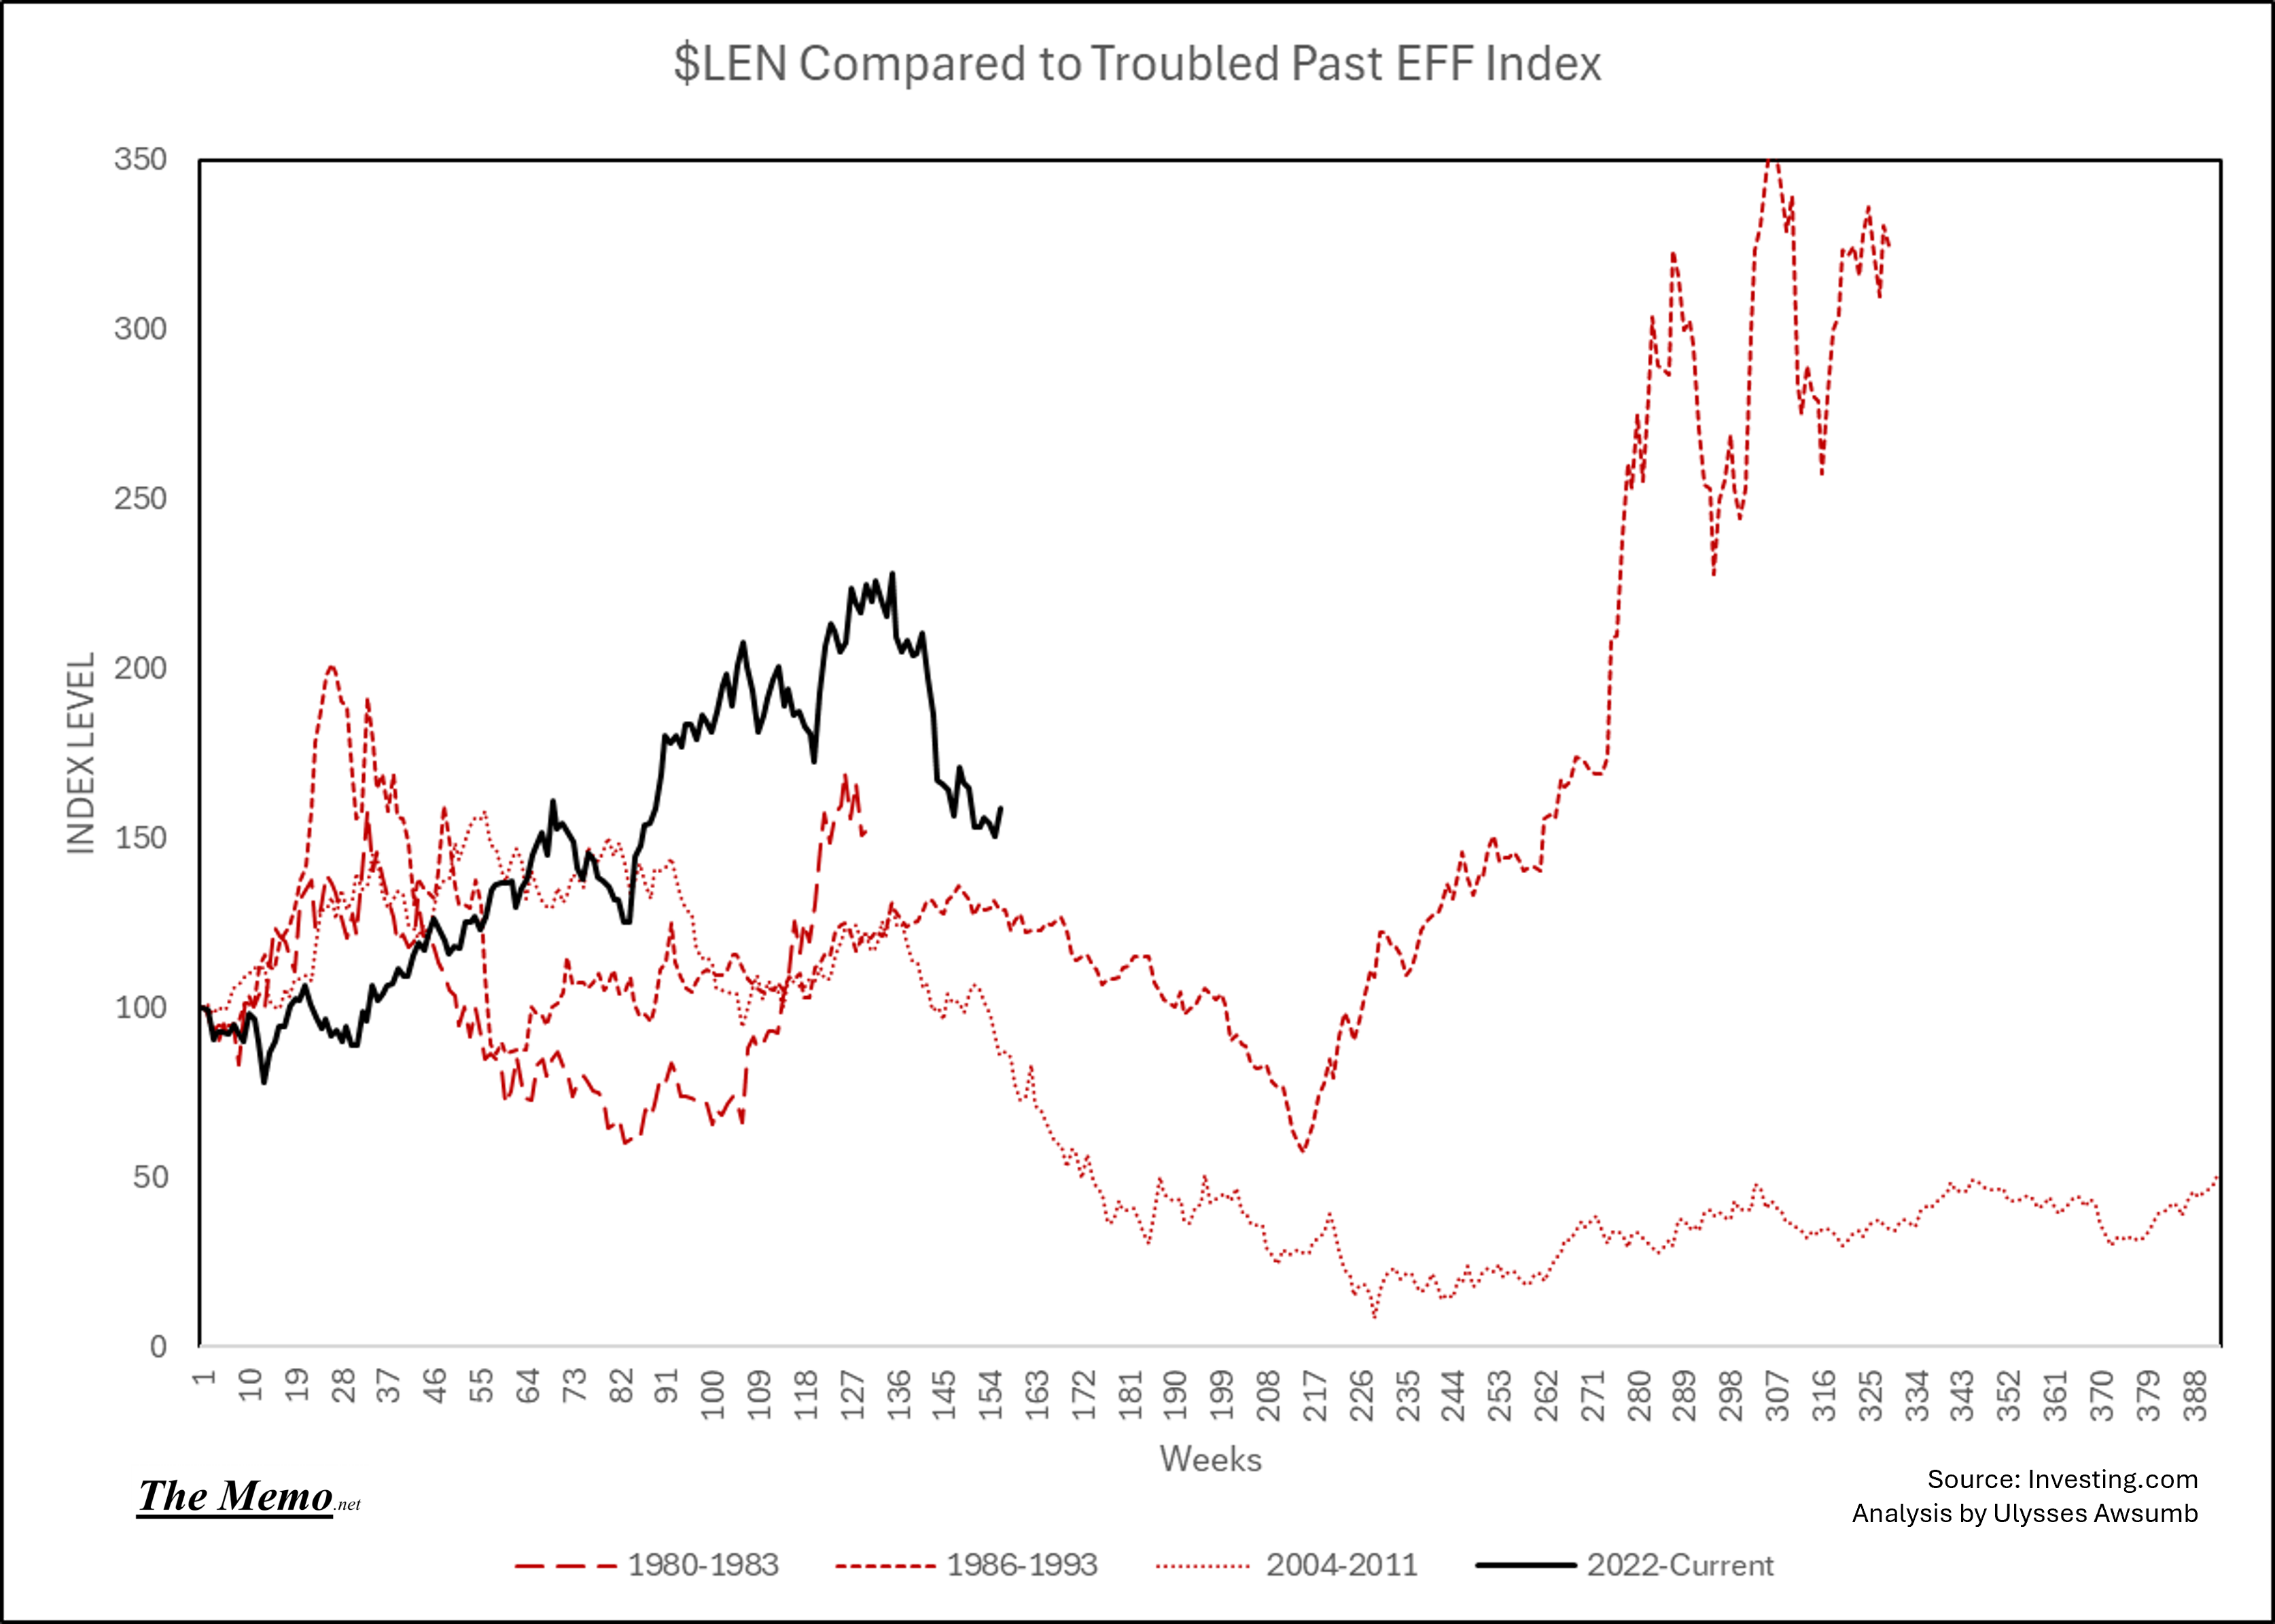
Same chart, just in EFF Index Format.
Now on to the important discovery part.

Time is Relative. Time Value of Money is too.
End Memo.
The Report
All numbers as of close 3/6/2025
Equities
NASDAQ
Down 10% since I marked the “first week of fall”.

If you’ve been following along, you know this from a few weeks ago. Breaking the index into the Four Season of Fourth Turning framework.
I used these reference points as the average length of time in weeks, by EFFR cycle, that it takes for behavioral change in humans. I also used those averages because they’re a “safe” spot, as in, if one wanted to exit on a given day, and by the next season change start at a better basis, one wouldn’t incinerate their money.

Not content to just chart in EFF format, I learned to use Investing.Com’s fantastic tools as well. In Linear Time format (how normal folk see time, in a straight line instead of a flat circle).
Here’s the last two cycles, with the Fed asleep in between. The vertical bars mark the four seasons actual change marks. We’ve just entered fall.

Ok now for the discovery. I plotted both the average of timing changes, and the actual time changes (with the first day being the initial rate raise). I thought using the 1986-1993 cycle and including Black Monday would be helpful to show one single cycle. Linearly.
My observations:
Spring always ends up “flat”. It may rise or lower in between it’s start and end, but it’s always objectively flat in time frame.
Spring averages 84 weeks
Summer Averages 72 Weeks
Fall Averages 52 Weeks
Winter Averages 78 Weeks
I’ve identified key transition points from “spring drops” to “summer drops” that establish support trends for the next season, based on the number of weeks, and will be working more on this framework in the future using these averages.
Now, I don’t consider these “technical support”. I call them human behavior. The future support is based on the memory of market direction. If someone charted these and saw them, it would probably ring Pavlov’s bell of “market go up again” from past support. Notable, since passive and algorithmic trading has grown, it’s almost more predictable. Someone had to input parameters after all.
Said another way: spring is a reminder that there's a cost of money, summer is when everyone forgets there’s a cost of money , fall is when the cost of money is beginning to bother people materially. Winter is the after effects of the cost of money.
By the way, I charted the last 8 cycles this way.
Black Monday came after a “soft landing” In 1986.

So did the Dot com bust after the 1997 soft landing. The 2020 crash was part of the cycle.
Here’s a couple more charts, with the markers at the average seasonal change. Dot Com

Last two cycles again. You’d almost think this set was programmed.

S&P 500

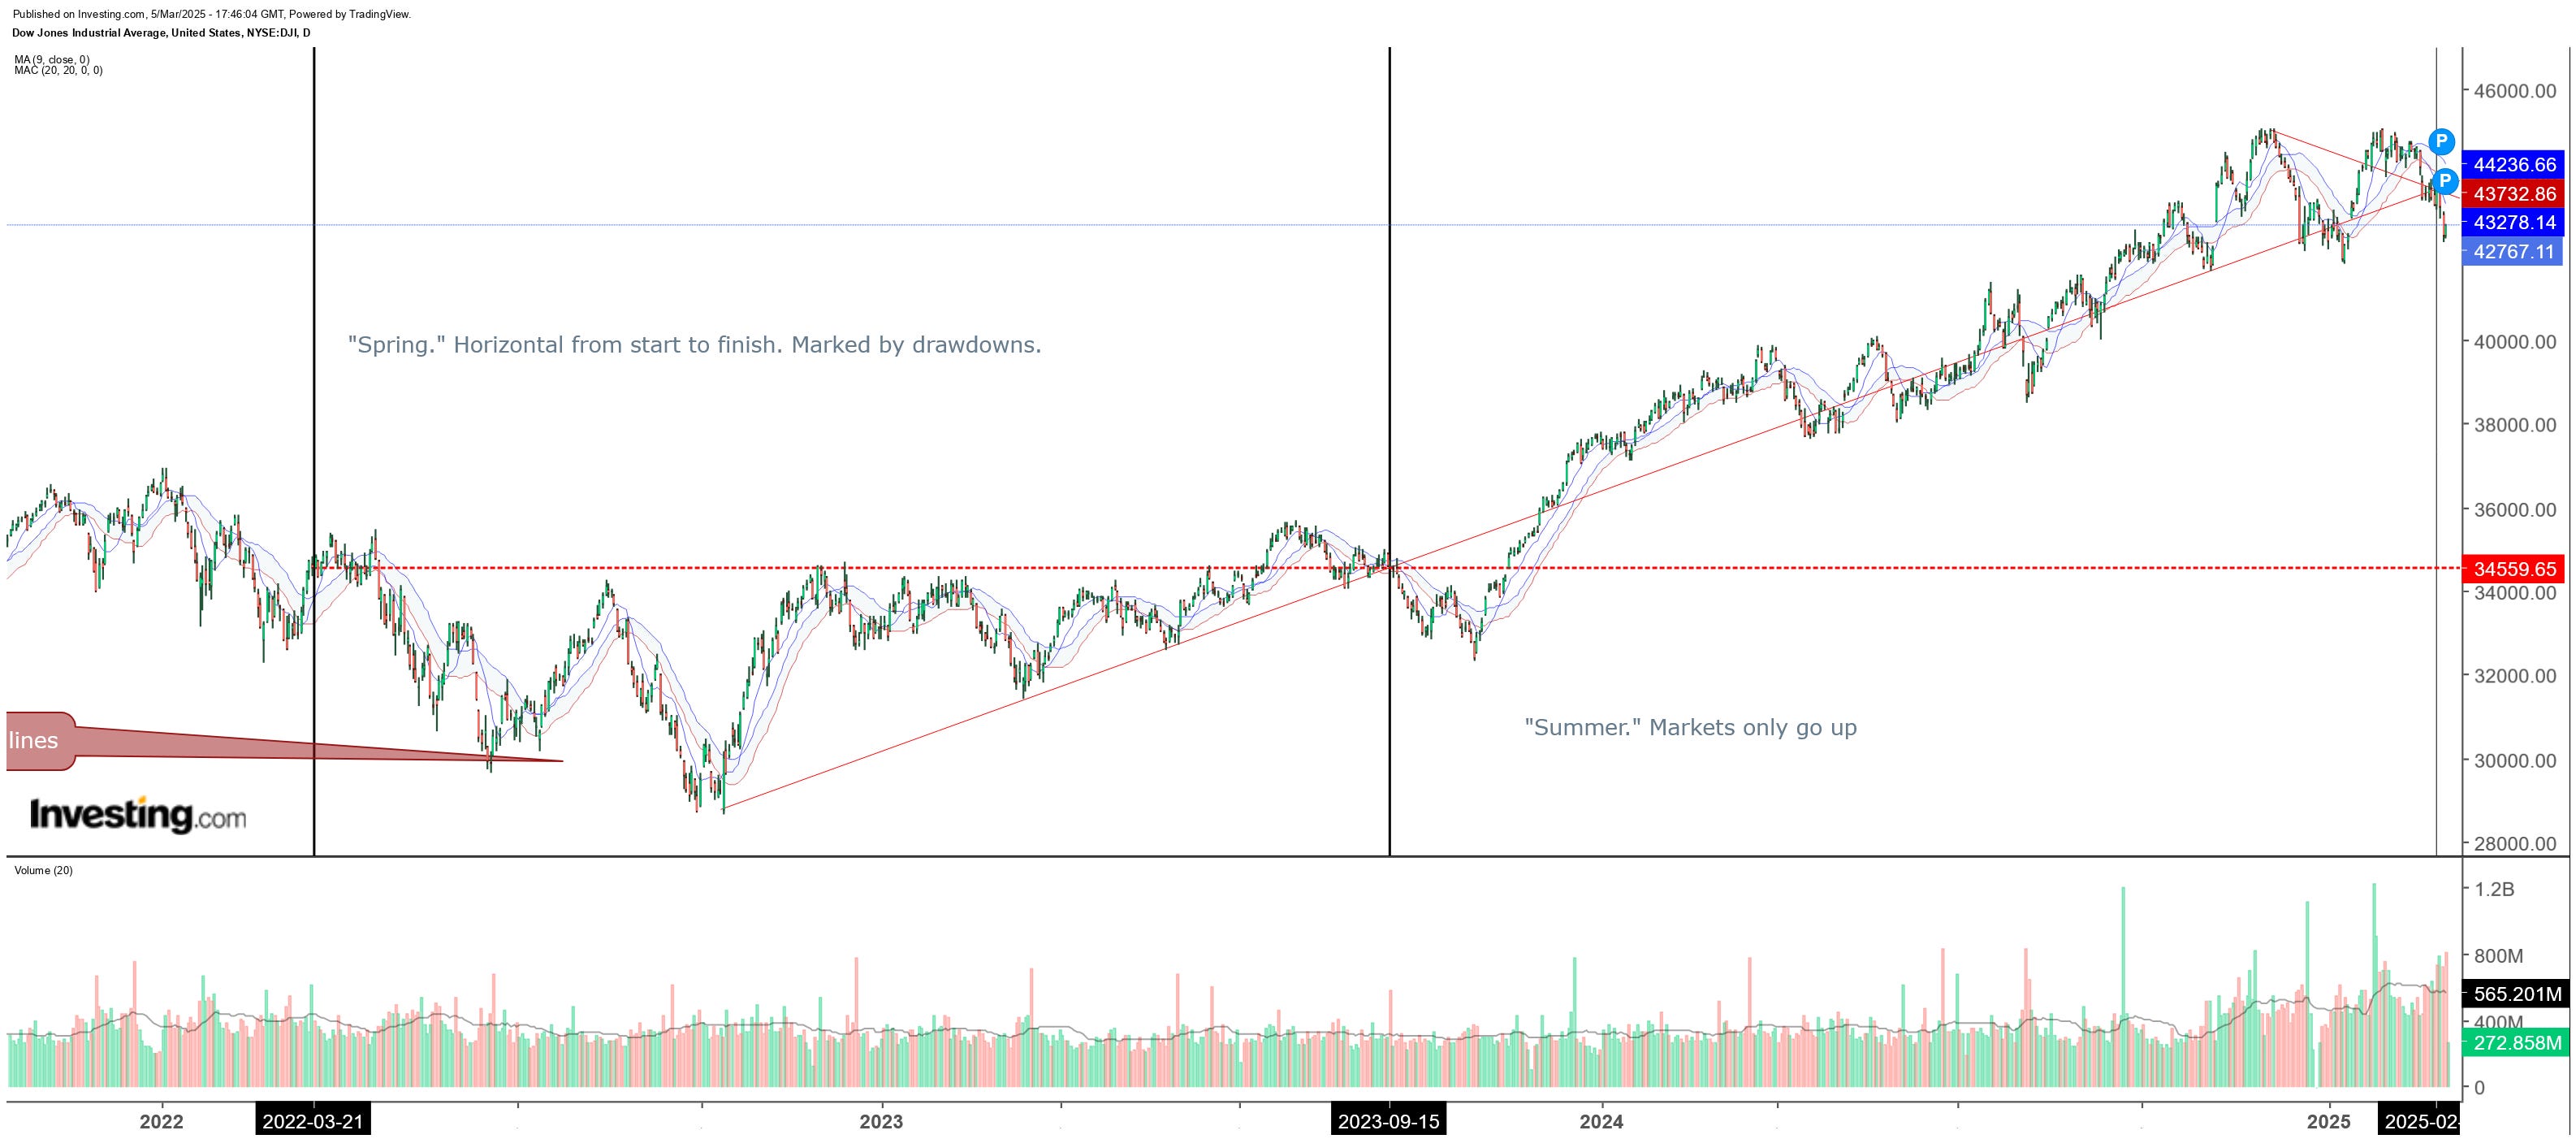
DJIA

Another average time change. Even using average, this would get you awfully close to proper patterns. Here’s the Dow.
NYSE

Money
The Yen is only going to get stronger relative to the Dollar, if human behavior and their trajectory is any tool.

Euro right on time.

Why all the sudden interest in Fort Knox?

The Cost of Money
You’ll get the cost of money cheaper eventually.
At least, that’s what Uncle Sam wants right…..?
If you want a “what’s different this time” from President Trump’s last term: Here’s a pretty picture.
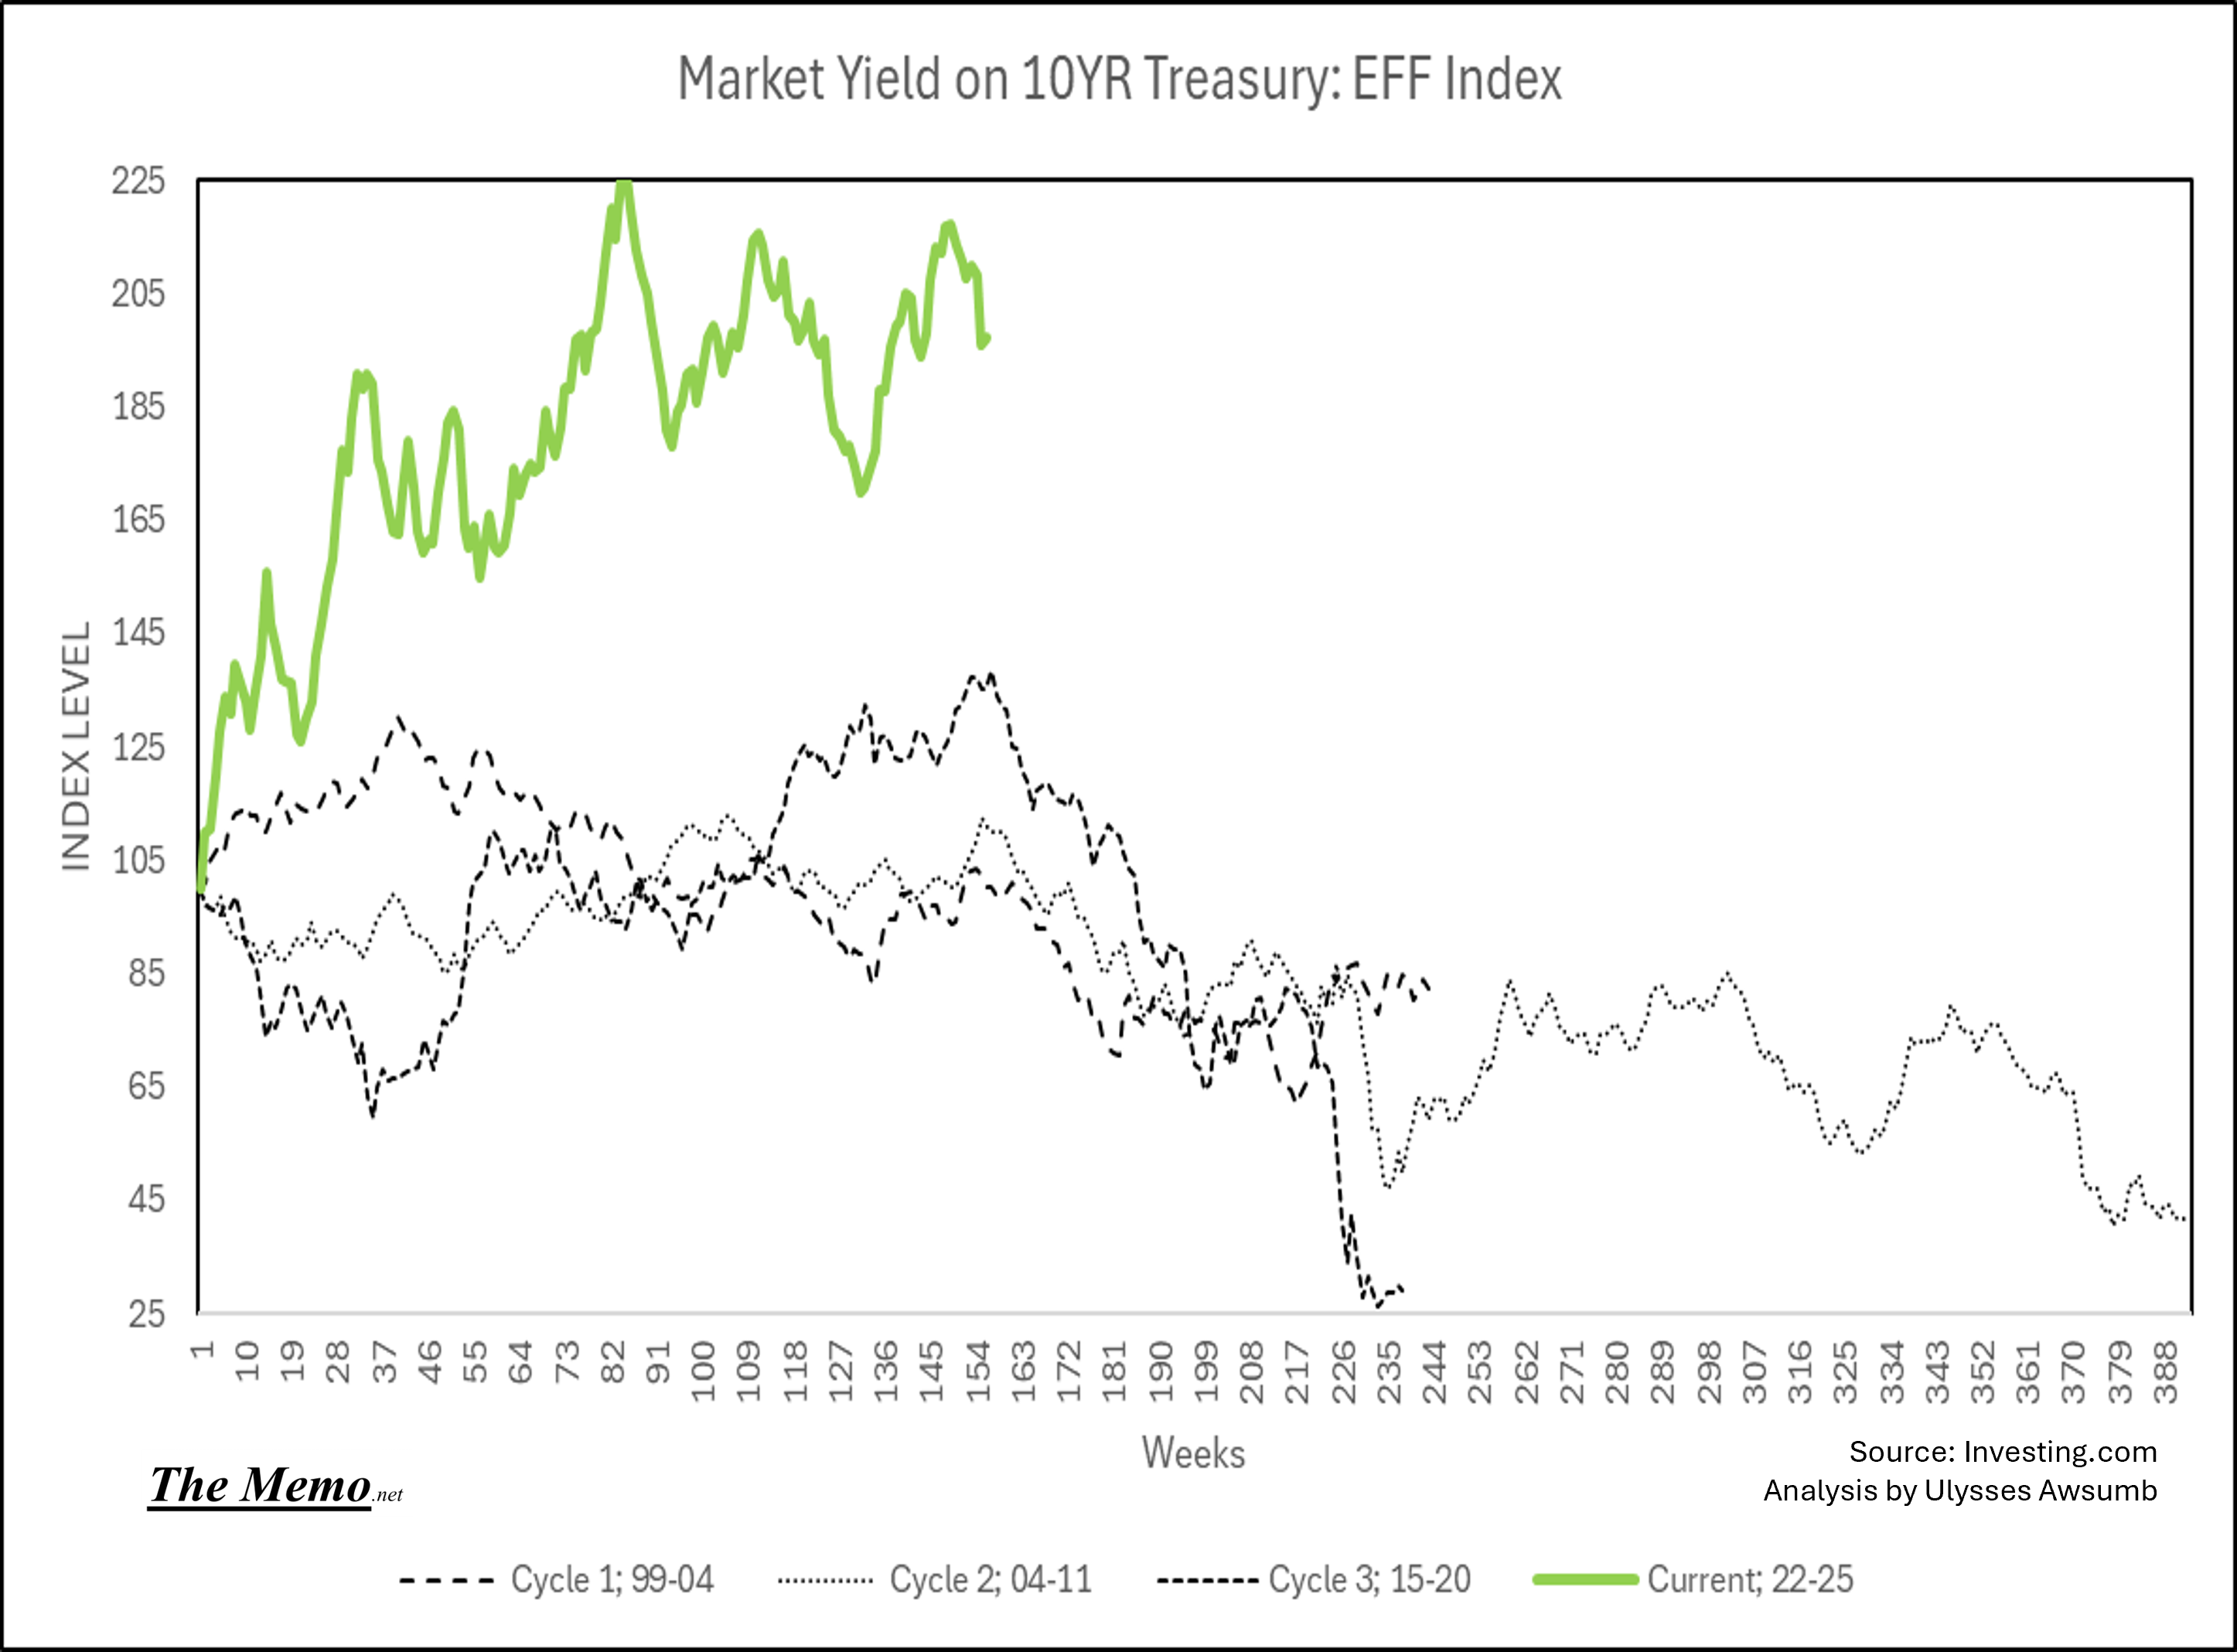
Money is much more expensive now than it was in 2018/19 When Jerome was being chided. And Uncle Same has a much bigger appetite for debt, that is if you follow the proposed funding legislation instead of the Meme coin turned dot Gov show. In fact, the EFF index goes to show the relativity: The Debt cost > 180 times more to service now than in March of 2022.
Fuels
The bottom of whatever this cycle makes, might be…..

A lot…..

Lower.

On the other hand….

How do you suppose this:

Will help Them:

Even if the cost of money is cheaper, but everyone has changed their psychological view on the actual price, not just the cost of the money?
Or if more people lose their source of income.

Hot off the presses;
Headline:
Actual:

Millions of people.
Today in EFFing time it is:
Winter
Today 3-7-2025
November 30th 2018
June 22nd 2007
April 19th 2002
Fall
December 29th 1999
September 8th 1989
January 17th 1986
The 1980 Cycle had ended 1/1/1983
Summer
February 16th 1979
January 21st 1975
October 23rd 1970
March 22nd 1964
Spring
The 1958 Cycle had ended 3/31/1961
November 8th 1957
June 4th 1954
December 16th 1947
This is not financial or investment advice. It is for research and entertainment purposes.