

Friday EFFing Memo
Building Permits and Headfake Headlines


The Memo:
Re:
Building Permits
2024 Final Homebuilding Data
Initial Unemployment Claims
NASDAQ/S&P500
From:
Mr. Awsumb
Comments:
This one is available for everyone, as it contains the mid month US Homebuilding Situation Index updates as well.
-Housing:
Despite the headlines about permits and starts, the trend continues. We ended 2024 delivering over 1.6 million housing units, and saw another year of decline in units under construction.
-Initial Unemployment Claims
Again despite the headlines, we had the highest number of initial claimants since January of 2022. Oh, and we’re right at were they start rising (see research below)
-NASDAQ/S&P 500
Will Presidential Mean Tweets deliver more market volatility, or was there more to the situation than claimed? If you guessed it’s more to do with EFF cycles, you’ll appreciate this weeks charts. Plus the Fed is on the clock for rate cuts.
End Memo.
The Research
Housing Construction:
The pace at which Apartment Construction backlog is going away slowed, albeit off a historic decline rate.
We closed out 2024 completing almost 586,000 apartments. The most since 1974. Based on the rate of completions and speed at which they are outpacing starts, the pipeline of delivery for 2025 could be in excess of 528,000 again, but back down to the sub 300k units under construction. Barring any economic changes in direction.

We completed 1,020,400 single family homes in 2024. Nearly as many as 2022.

I’m going to use the boring Government charts, just to put reality into context.
Here’s the apartment backlog dissolving visualized:
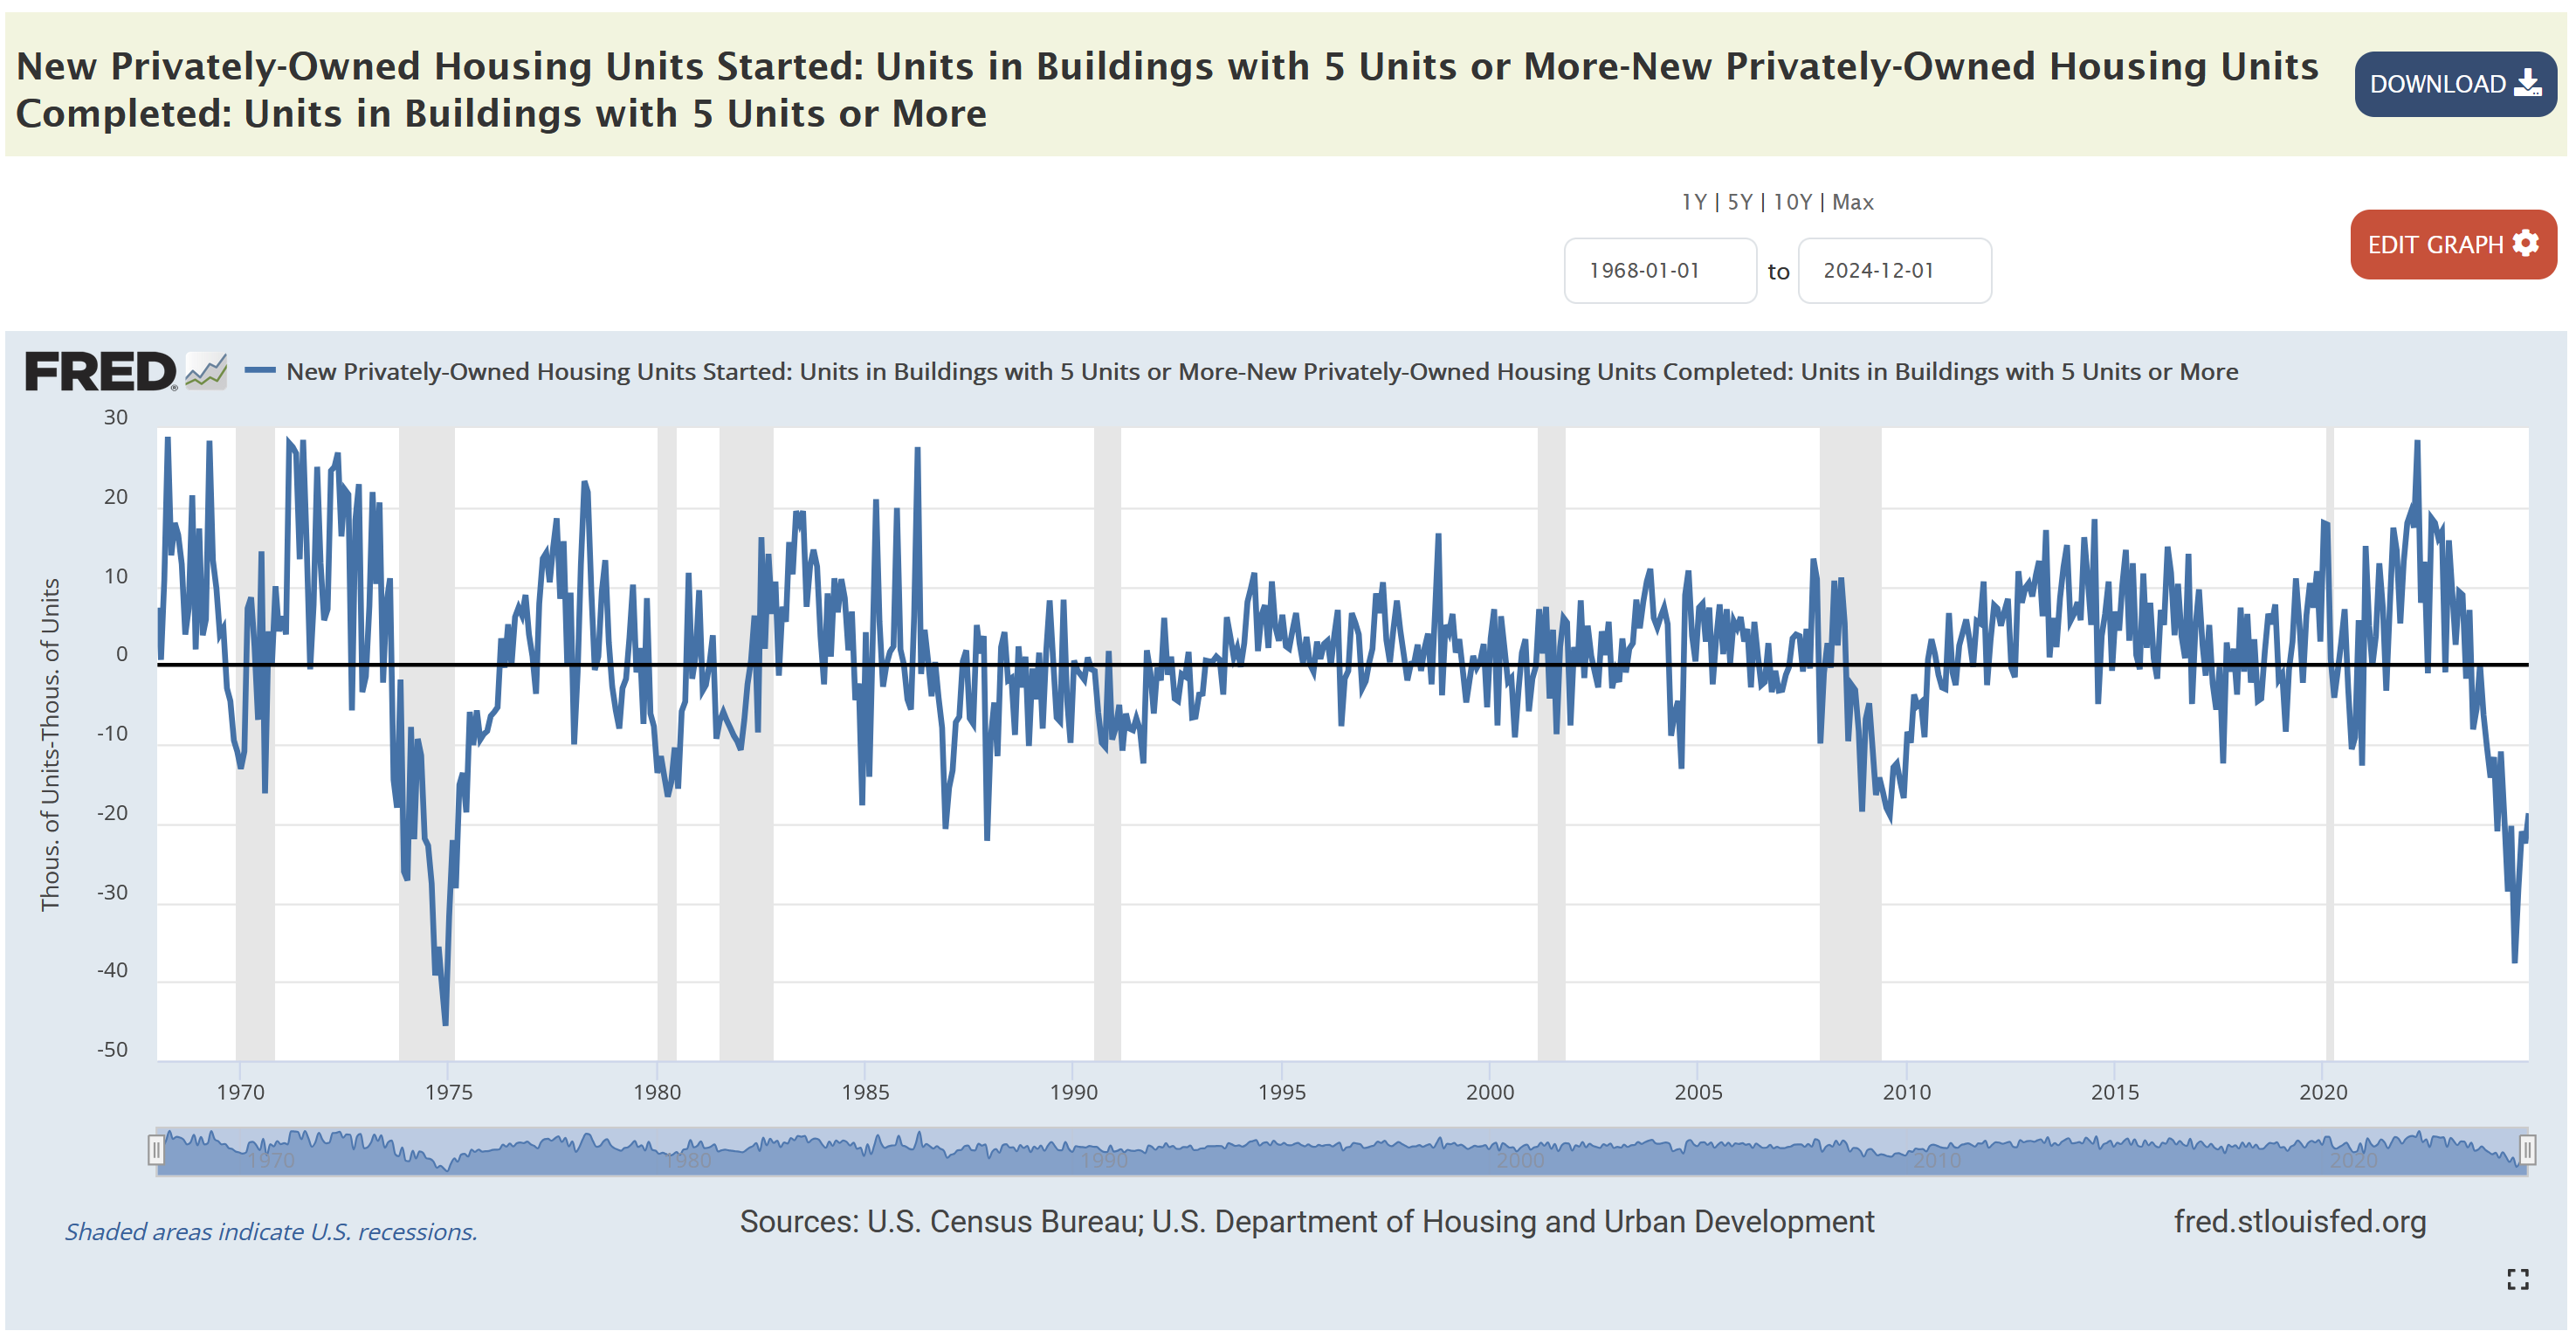
All those completions are showing up in the continually declining units under construction. Single Family:

All types:

Headlines in the news were rosy today about permits. There is some positive permit/start data though:

Whoever builds more of these and at lower price points will likely hear people yelling:

EFFing Updates
Here’s the EFF cycle Index for units under construction. We’re not just pacing with the 2004-11 cycle, we are dropping faster.

Here’s a comparison of just the two cycles:

December sales need to be above 55k to prevent more material inventory pileup, after November set a new record for lows in the Homebuilding Situation and Index. Interest rates will hamper the situation as well. It’s possible the December Median Sale price for a new home will be south of $400,000 as well. November came it at $402k, carrying the trend started in 2022.
Initial Claims
If you read the headlines about low initial unemployment claims this week, please know that we had the highest initial claims since January of 2022 on a non seasonally adjusted basis. We’re at week 150 of the cycle. Claims spiking as if on cue.

Here’s a cleaner view of claims, compared to it’s closest past cycle, and the average of the cycles.

And to clear it up, we’re at the part where initial claims will likely begin rising even more. If the Fed is focused on employment, as they’ve stated, they’ll cut this month.
ICNSA = intial claims, not seasonally adjusted

Also, note the pause in the average Fed Rate (sideways) and the Average ICNSA from this week timeline on…..
NASDAQ
We are trending inclredibly close to the 3rd rate cycle at present. As noted in my post 28 weeks later, the next 28 weeks are going to be very telling as all 3 prior cycles saw softening in that time frame. So will Mean Tweets really make a difference?

And here’s the avg fed rate at this juncture:

Again, note the timing of the pause.
Let’s just take a look at the two closest cycles, 04-11 and 15-20:
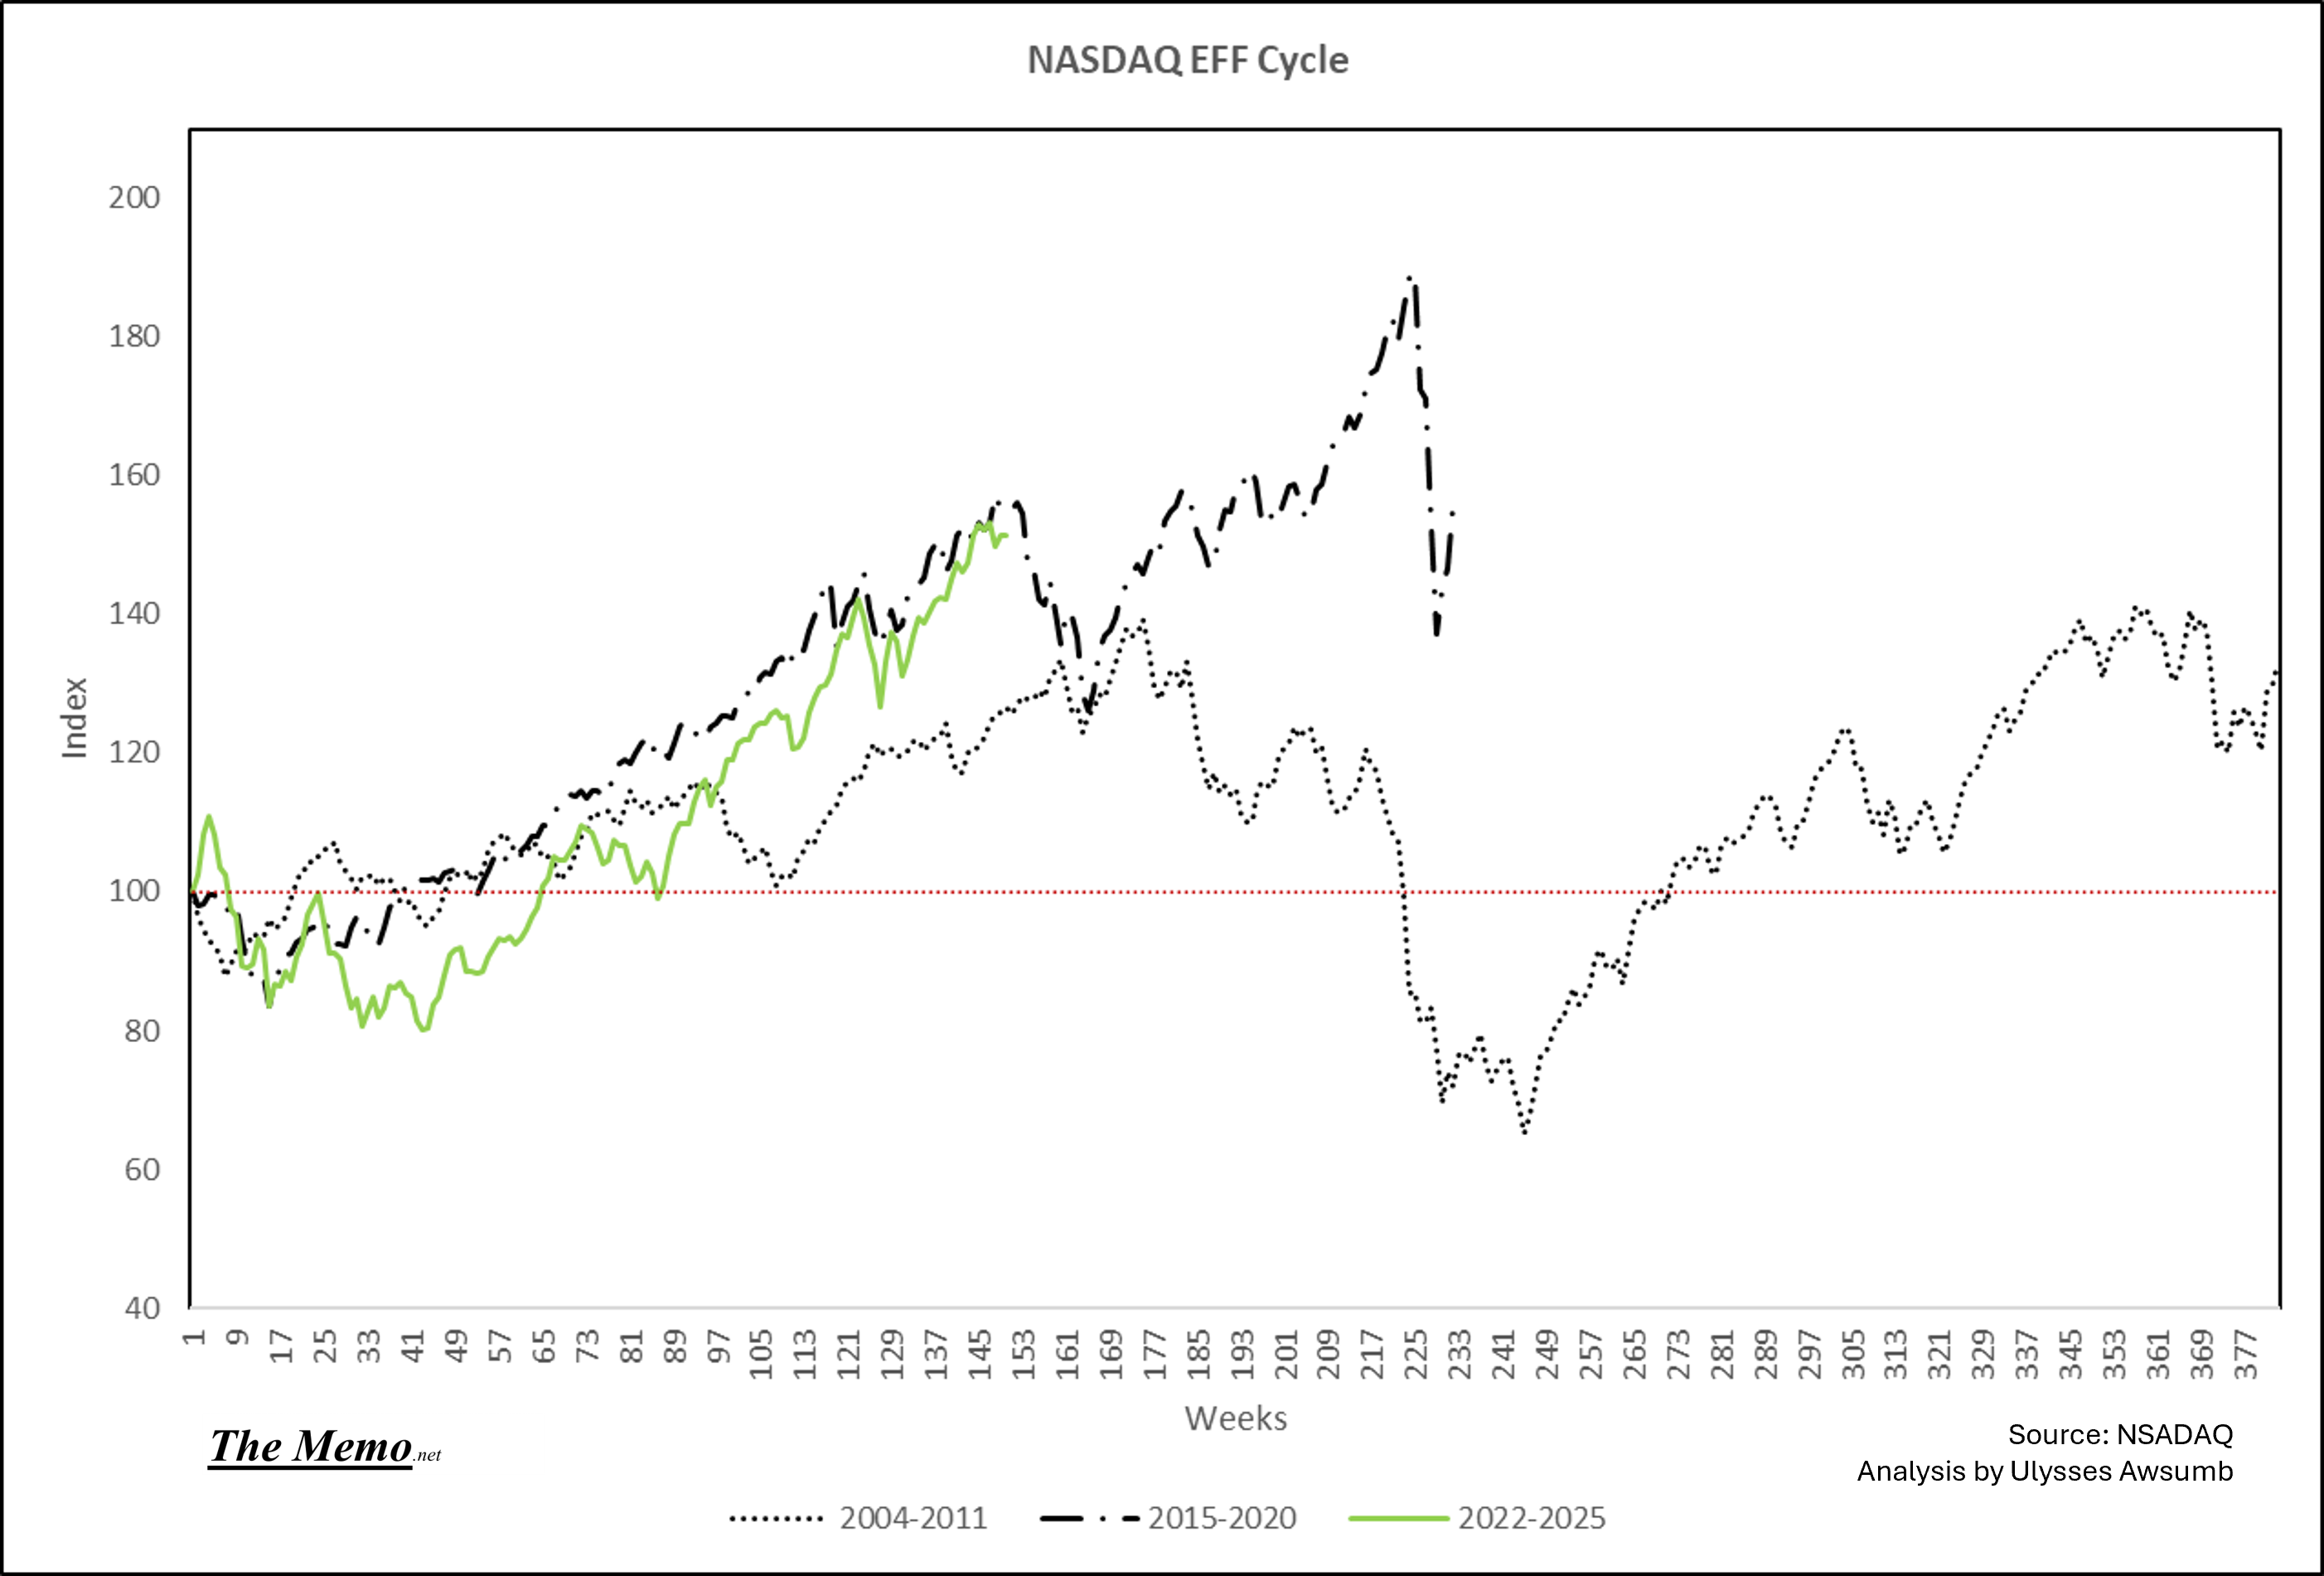
I’ve heard plenty of market commentators discuss the Mean Tweet volatility effect of President Trump. So let’s take a look the NASDAQ and his last couple of years
The trendline of the market goes up (dotted black line) but the baseline (Green) basically shows the market sideways even into the Covid Crash. Or: Volatility. But how much of that is actually on the President?

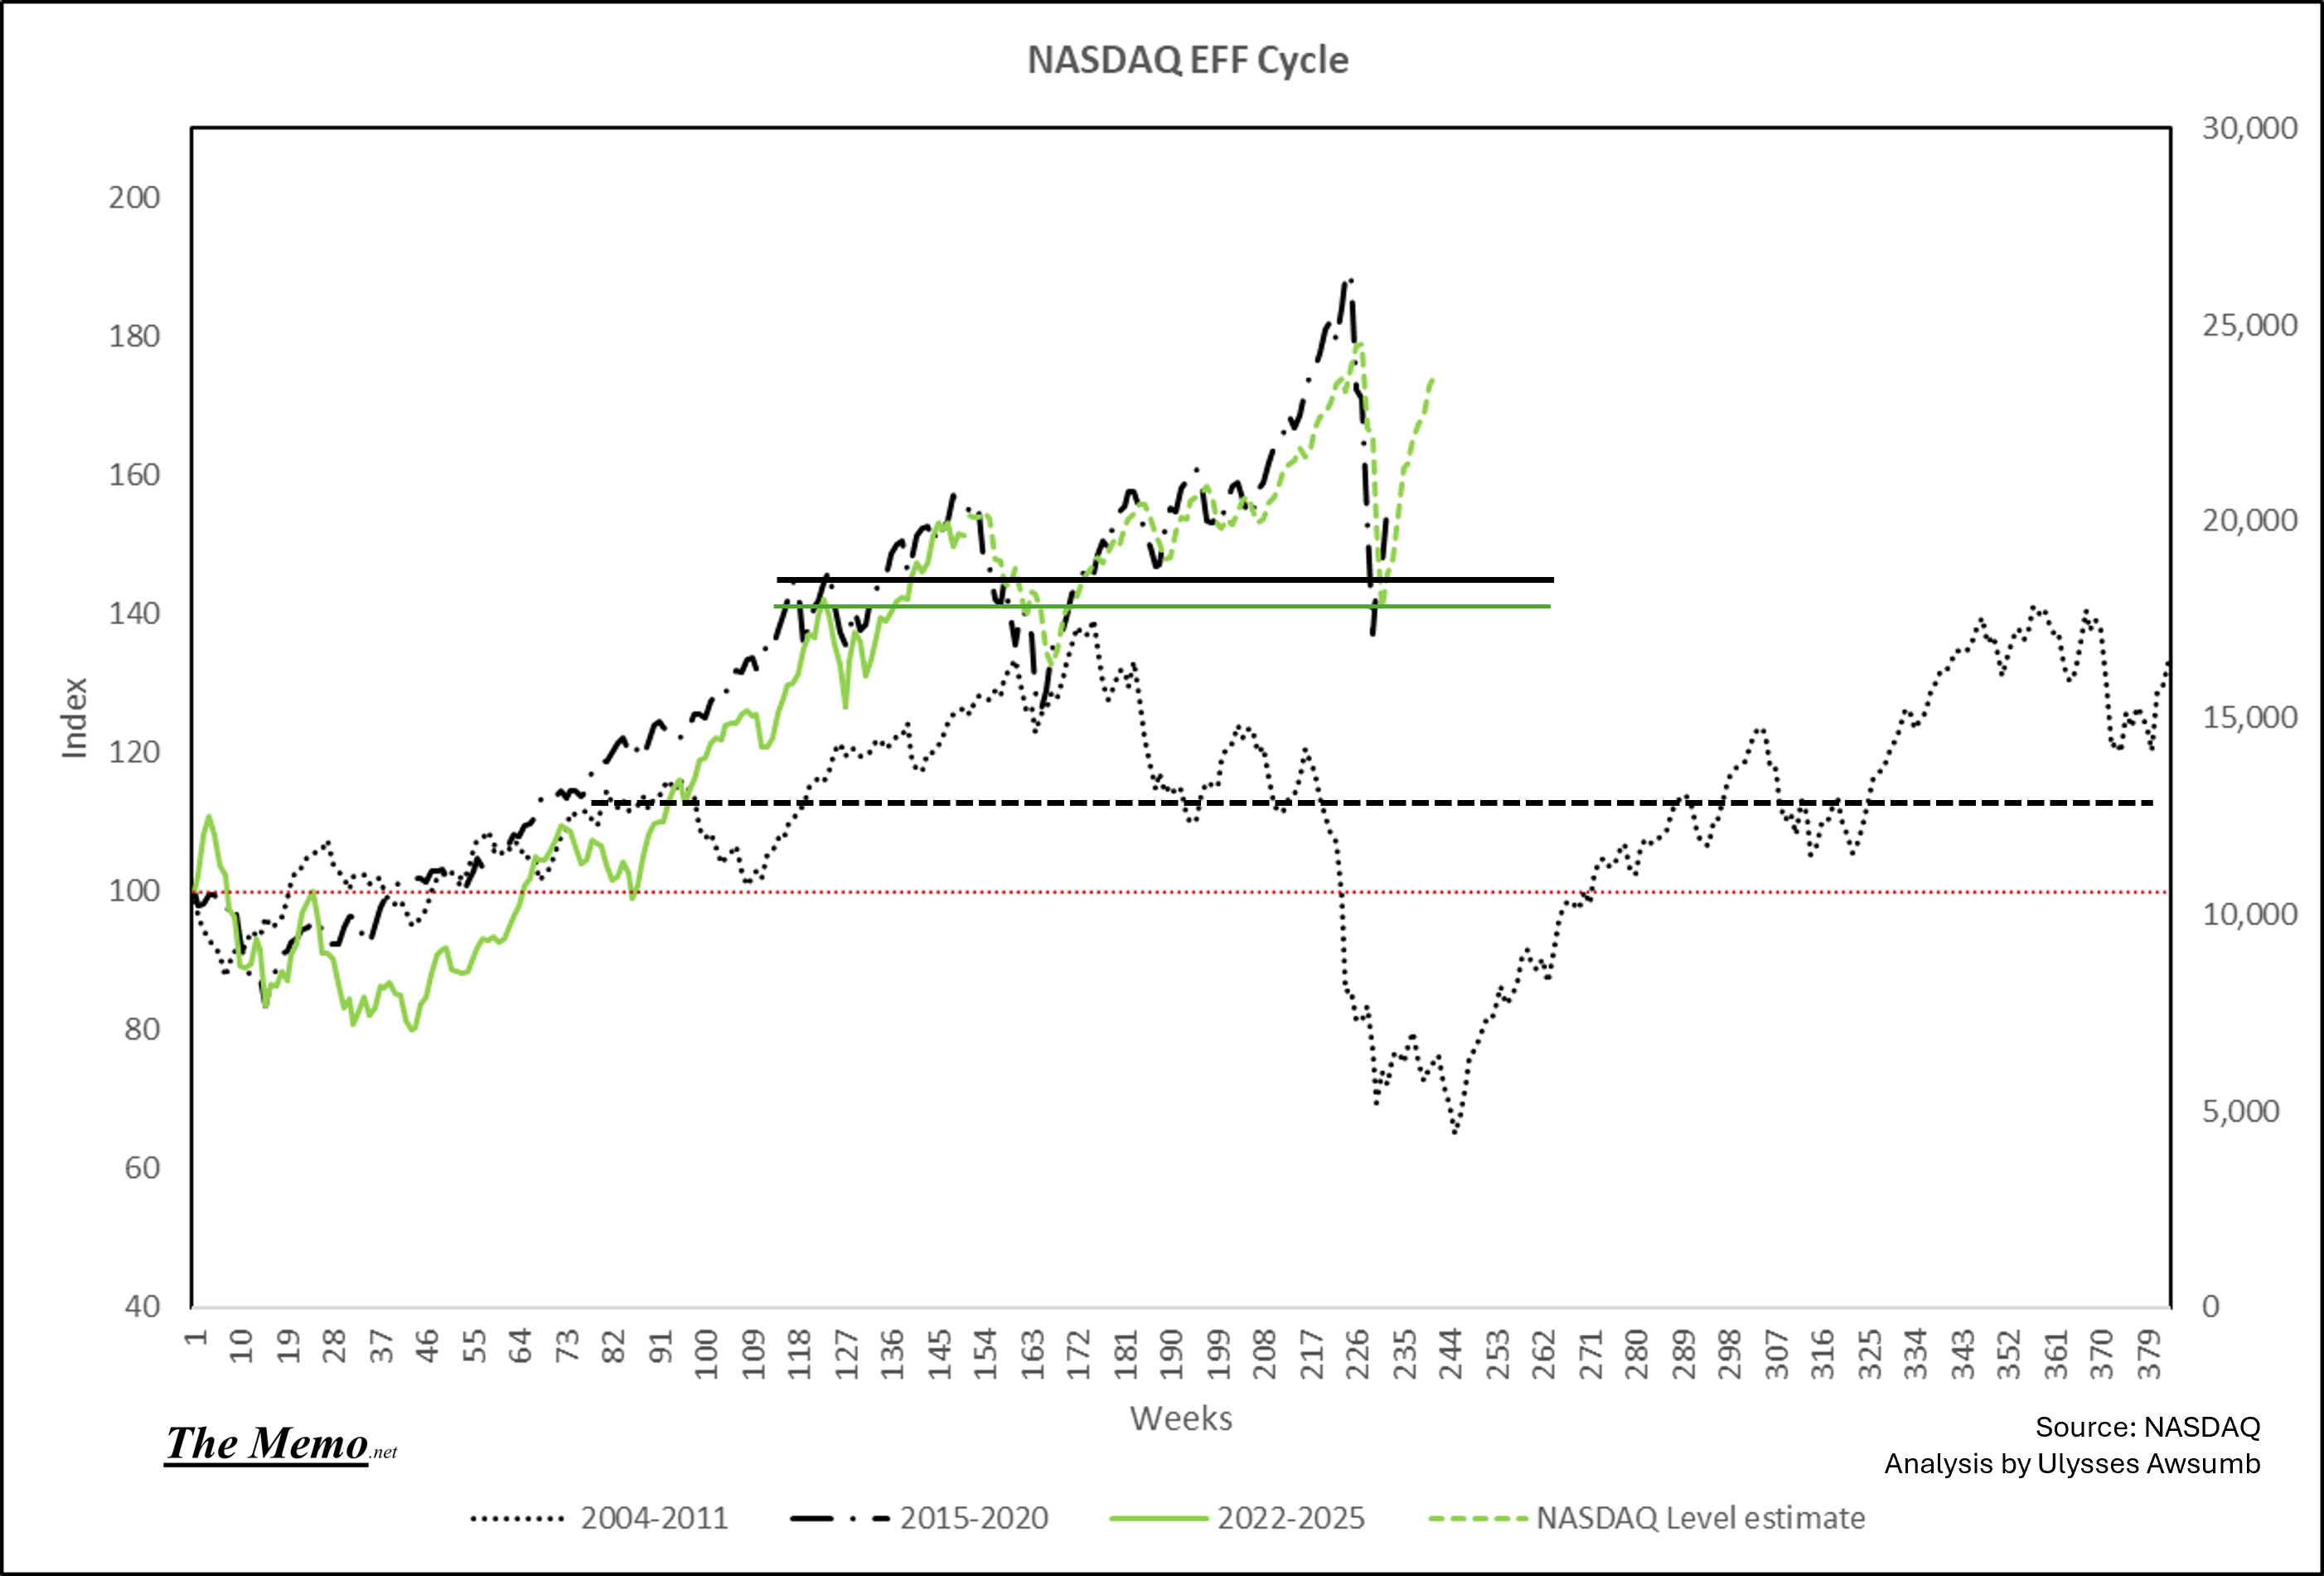
If we look at the 04-11 cycle, it’s essentially the same thing. And so is the 99-03 cycle, albeit on an earlier timeframe. The green dotted line is a potential projected NASDAQ level (right axis) if it follows changing at the same EFF rate as the 15-20 cycle does.
S&P 500
All cycles noted here. This weeks level was as of noon today.

Remarkably similar to Cycle 2 at this timeline.

The Fed Funds rate percentages that are most alike between the 4 cycles: Cycle 2 &4. Send tweet!

BONUS:
Natural Gas
Timely! And with room to increase further.

I’ll be working on updating the original EFF cycle components to publish each sector more often, including prices or (market) indice levels as well as the EFF index levels. For now, Chariman Powell is on the clock.
Have a wonderful weekend and please share this if you find it interesting.