EFFing Memo
A Q2 Remember

The Memo:
To:
All Staff
Re:
What(s) the EFF
Today in EFFing Time
Unemployment
NASDAQ
Technical Difficulties
West Texas Crude Oil
Comments:
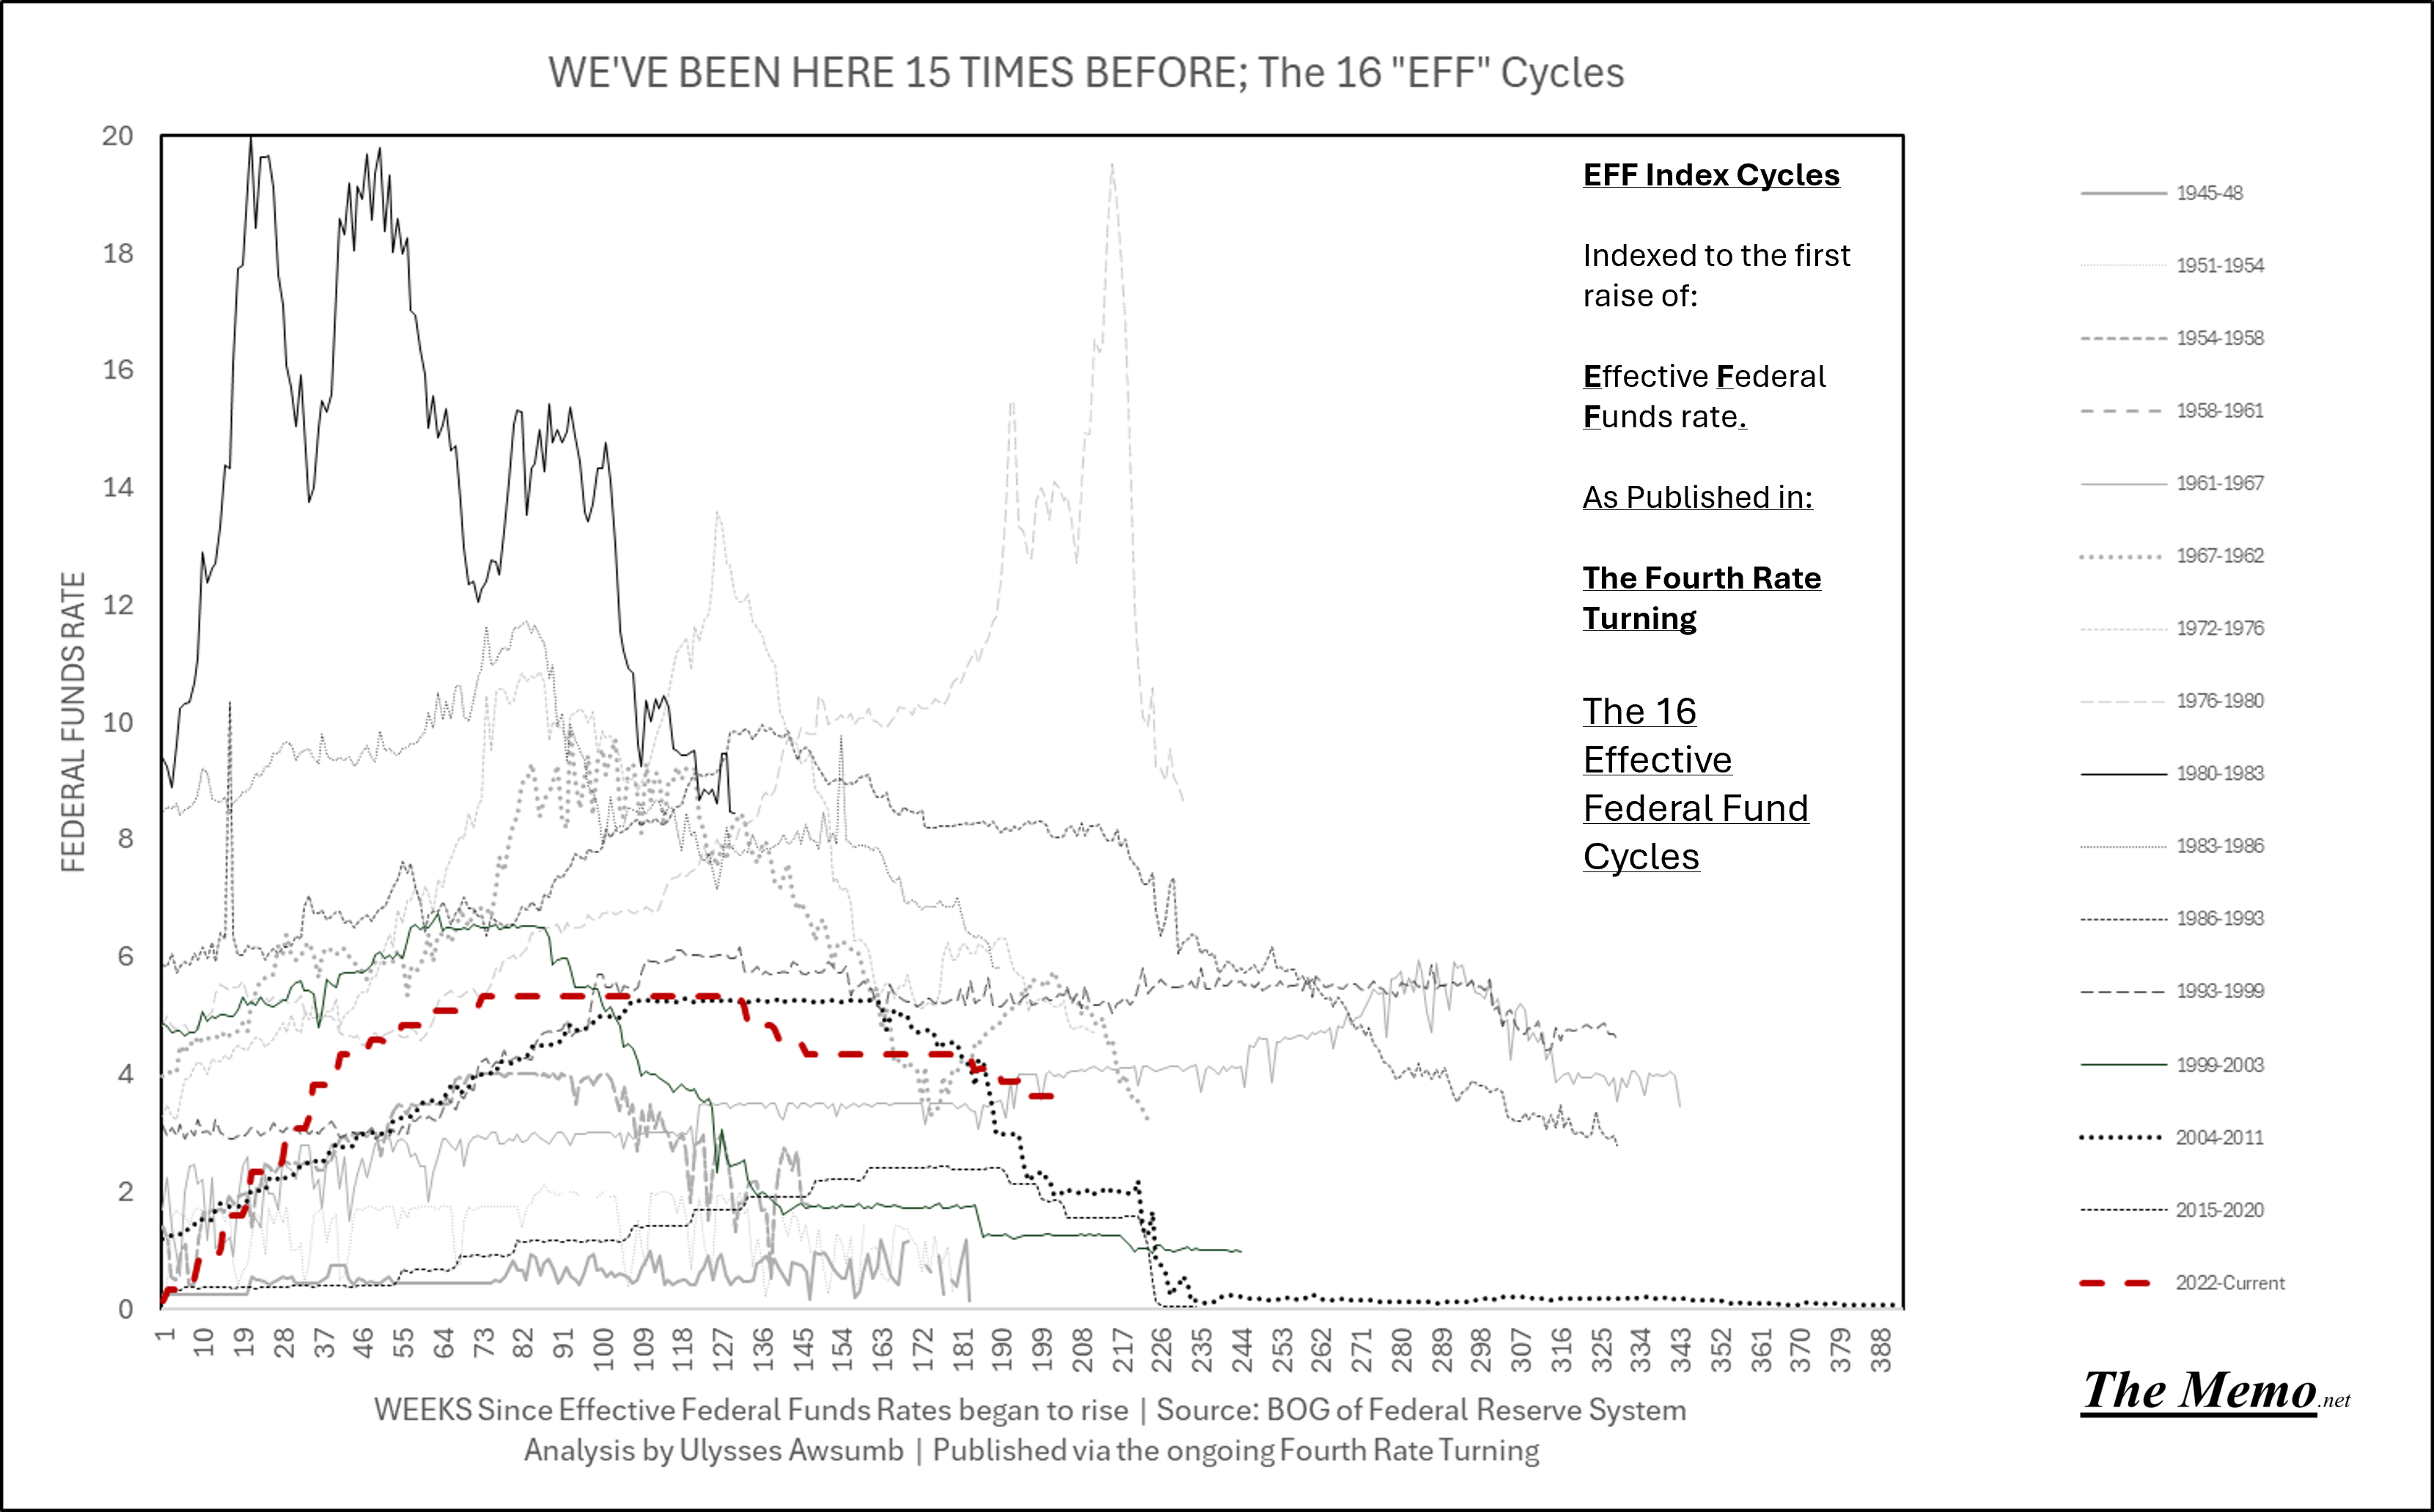
I’ve wrote at length about how we’ve experienced 15 Effective Federal Funds Cycles since 1944. Each cycle has a:
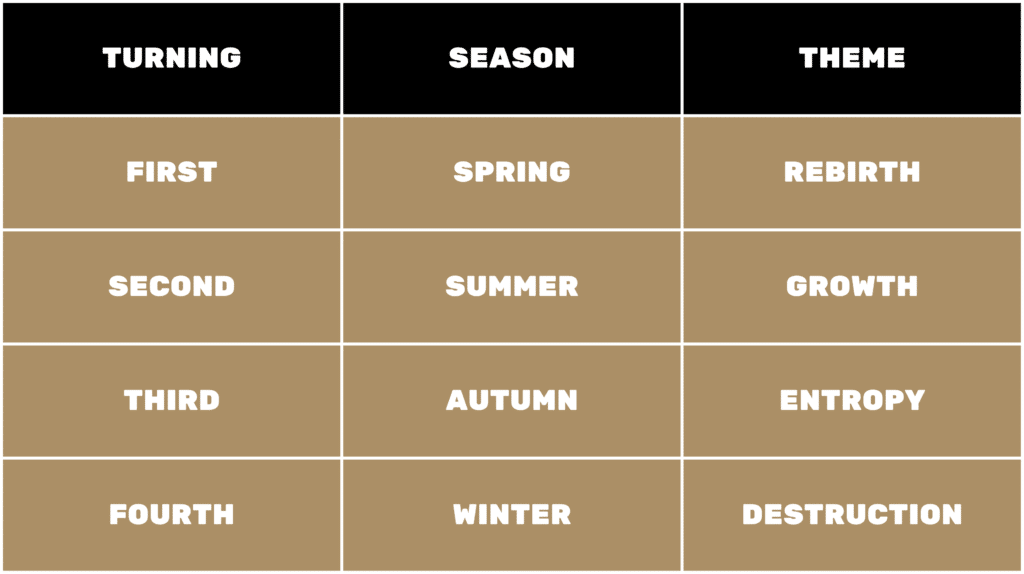
Spring
Summer
Fall
Winter
They can be summed up as: Initial Reaction to EFFR (effective federal funds rate) changes, Growth despite of EFFR Changes, Stagnation/Inability to further grow as EFFR tops, and outright contraction even as EFFR chases said contraction.
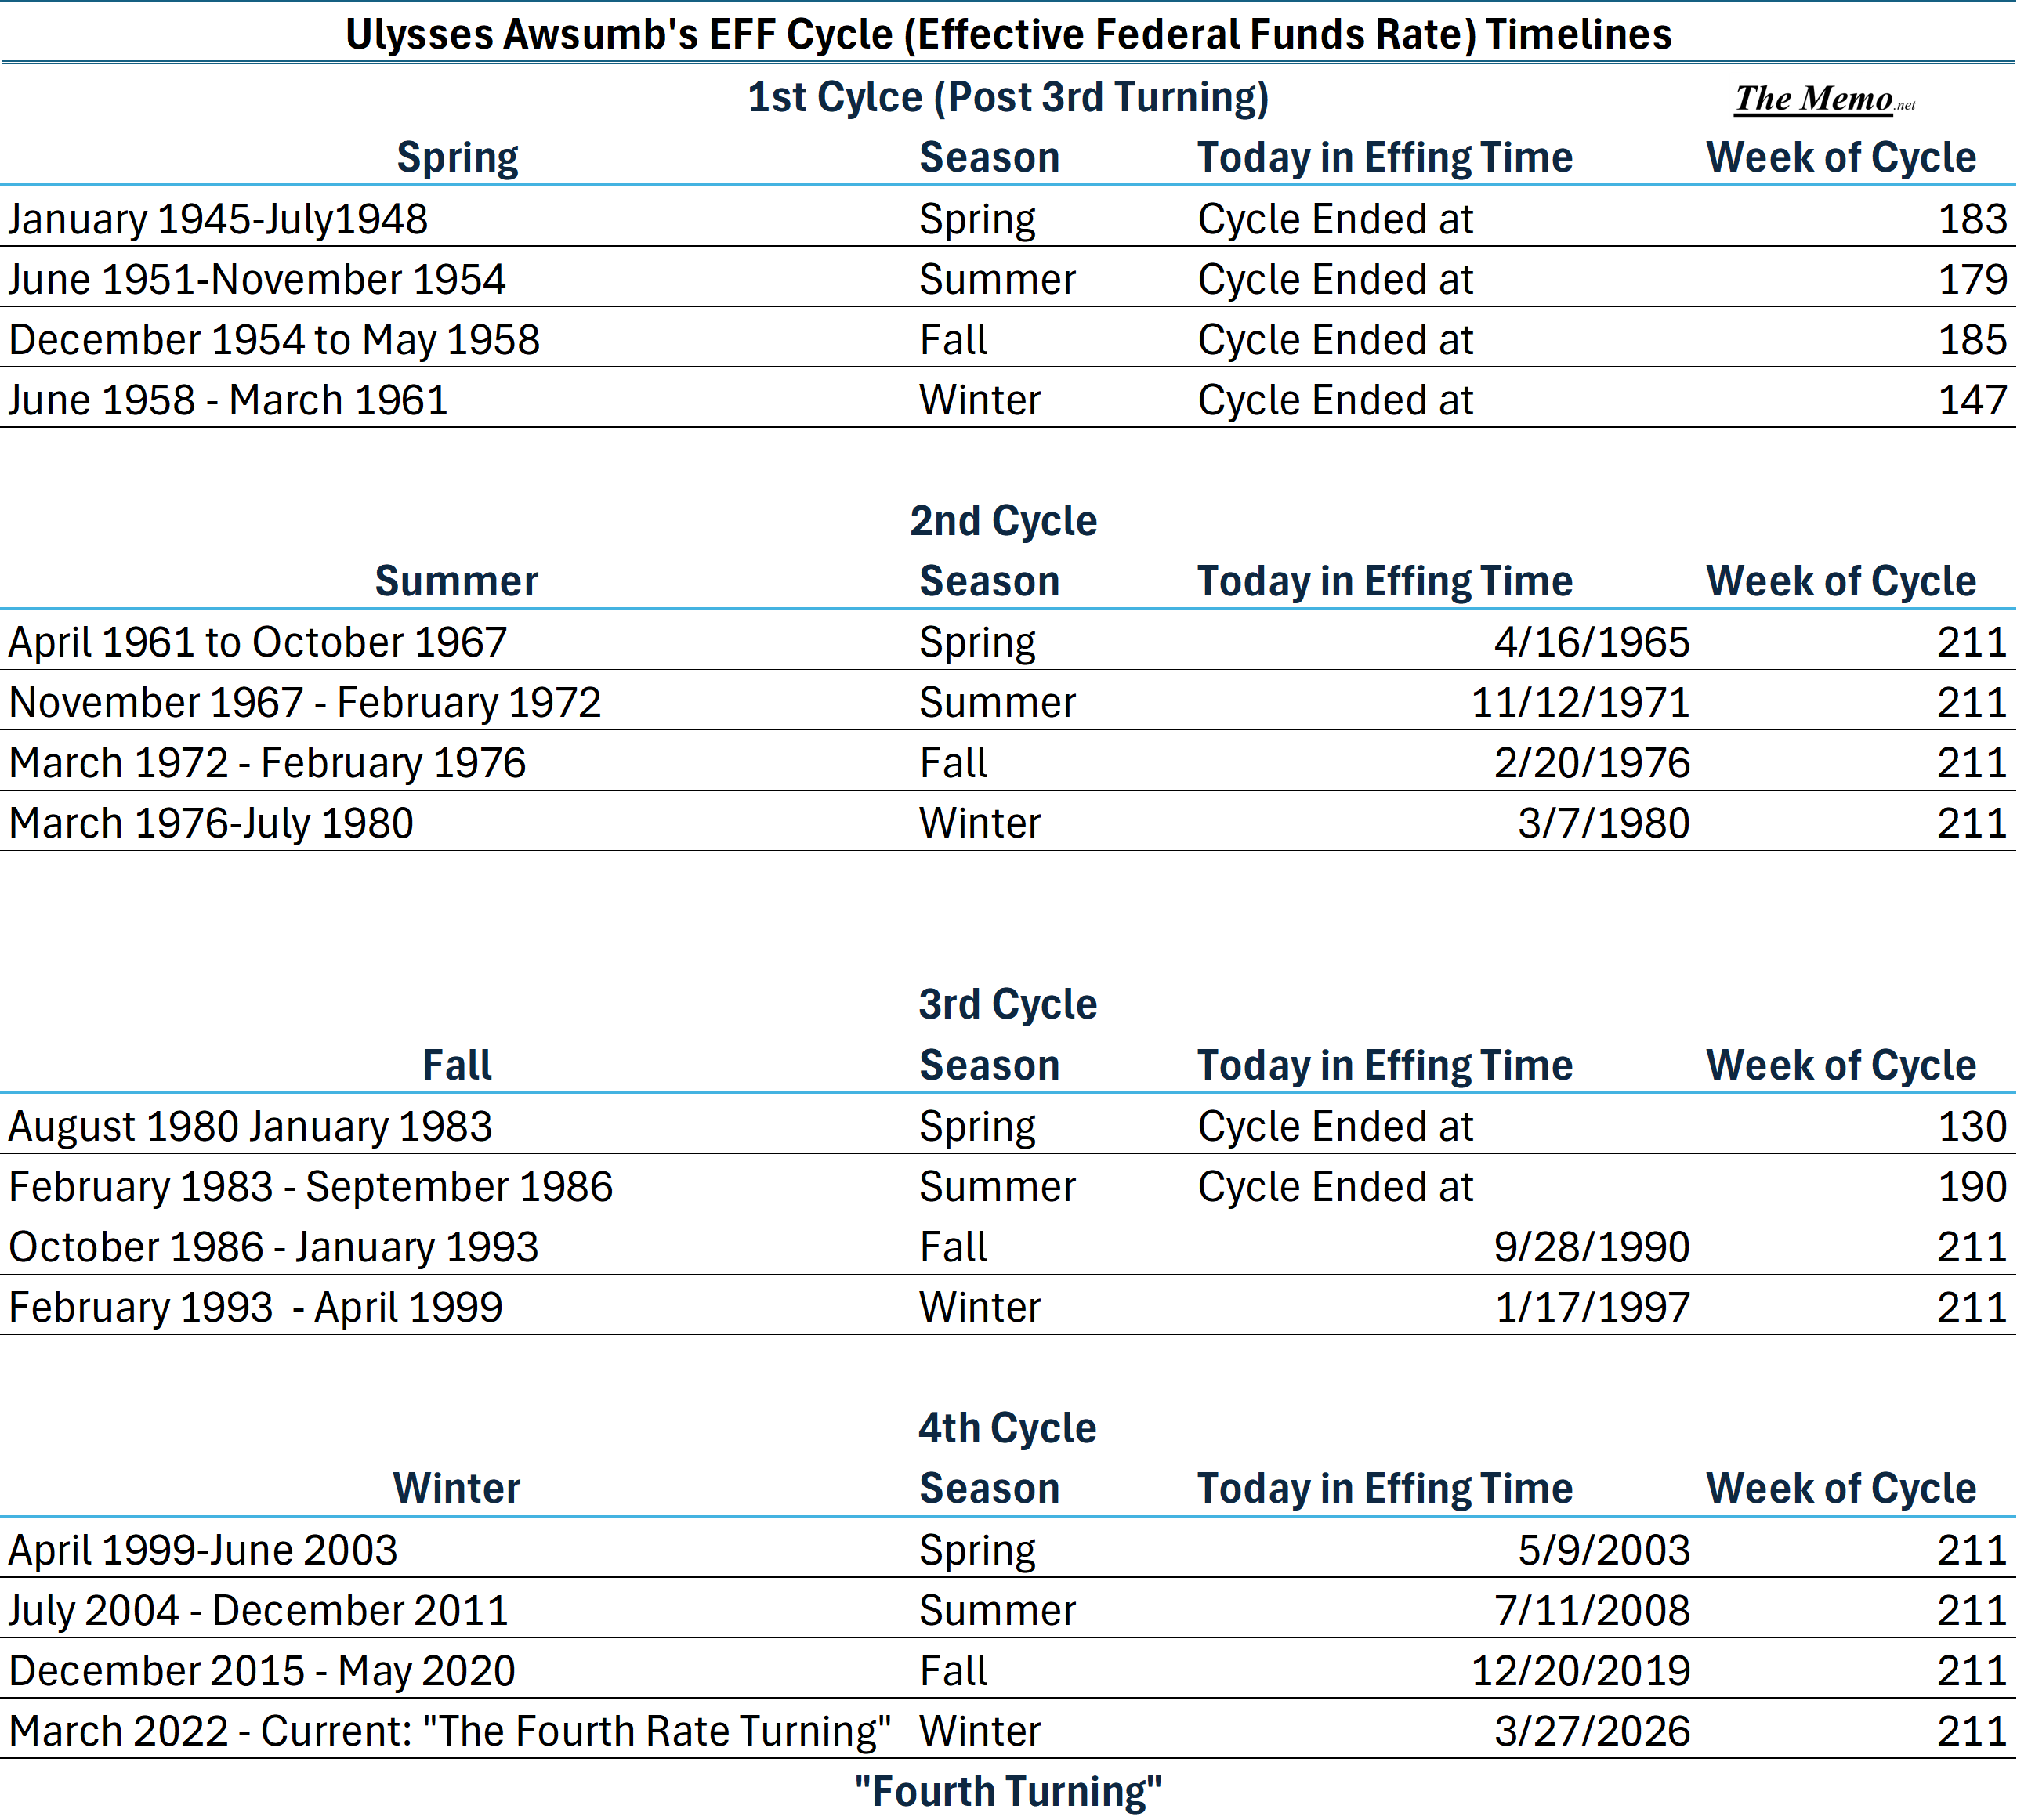
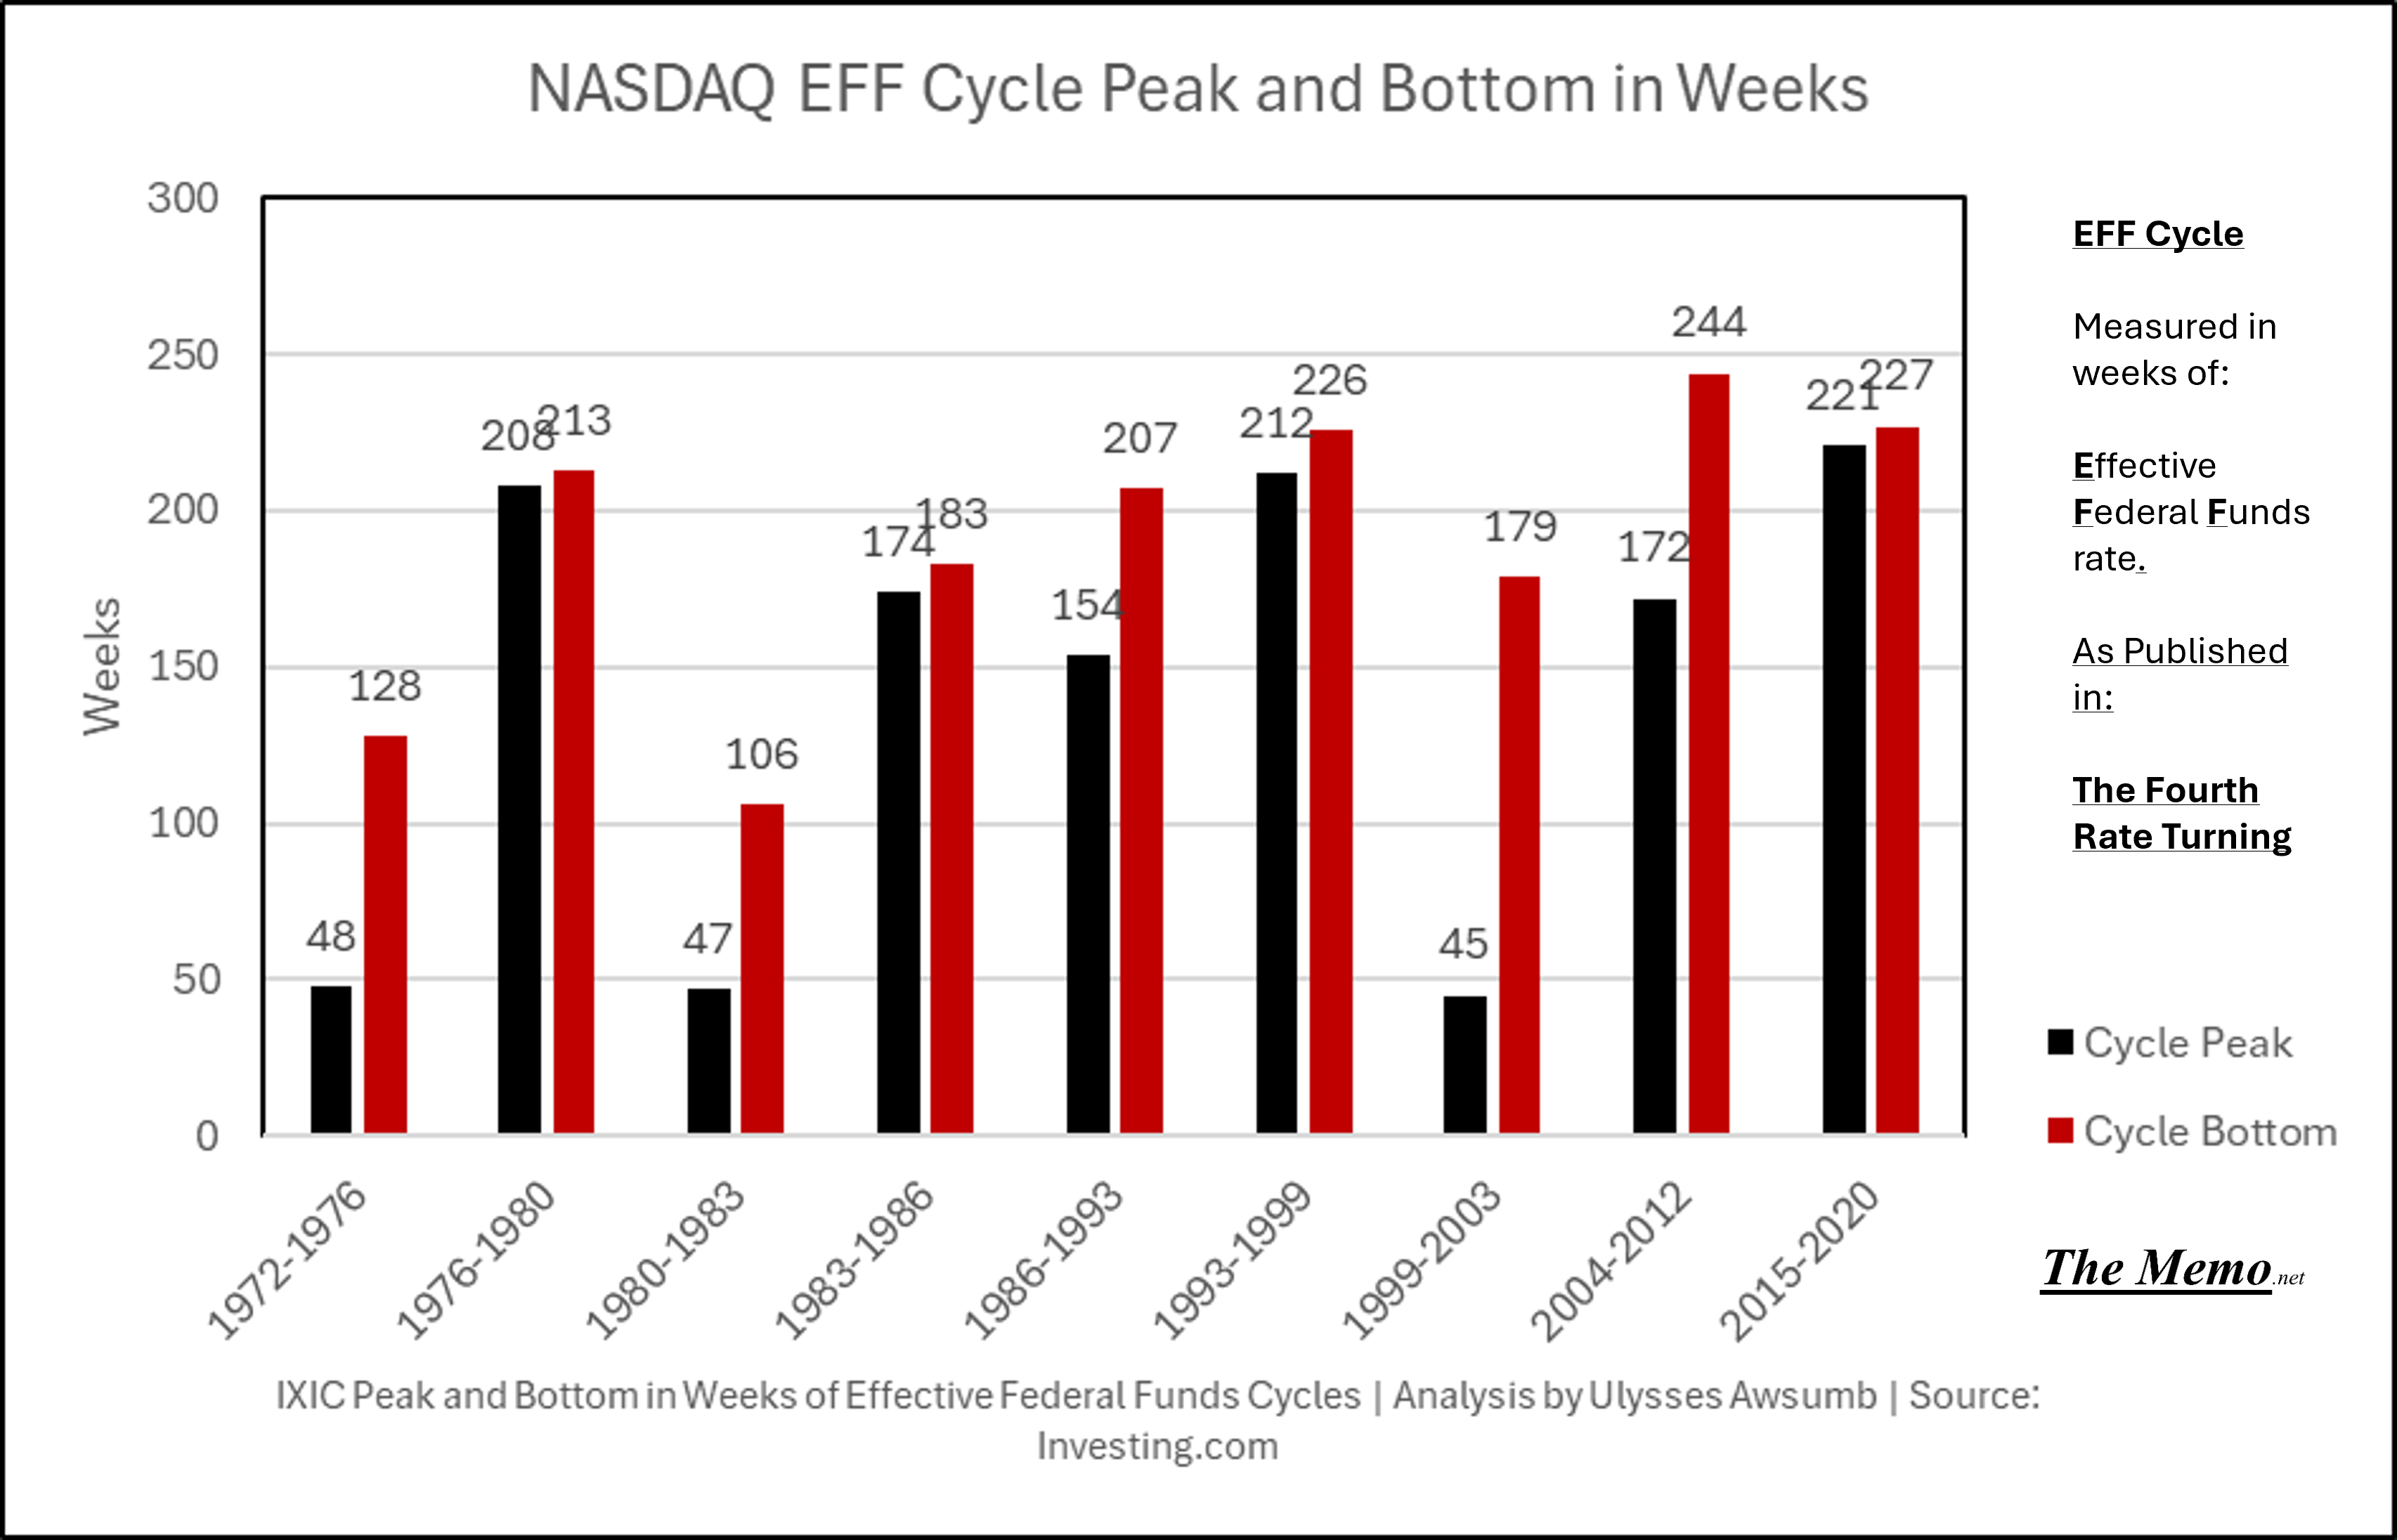
The Mean cycle time going back to 1944 is 238 Weeks. Or 4 1/2 Years. The Median cycle time is 225 weeks, or 4 3/10ths Years. So 4 Cycles is roughly 20 years.
(4 1/2Years x 4 =18)
Coincidentally, Neil Howe’s Fourth Turning seasons average 20 years each, or roughly 80 years start to finish. Each of those seasons represents:
So an EFF cycle is the time from rates commencing their rise, to the time they bottom, before the cycle begins again. OR, that’s what(s) the EFF.
Those cycles consist of days/weeks and months. So we can pinpoint today in time to the day/week/month of the previous cycles, and compare the economic reactions, behaviors and outcomes to the current cycle. I call those days: Today in Effing Time.
We currently just completed the 211th week of the cycle. Or,
Today in EFFing time it is:
As of last Friday that is. Read the report, as we turn to what I believe will be a Quarter to remember for a long time.

End Memo
The Report
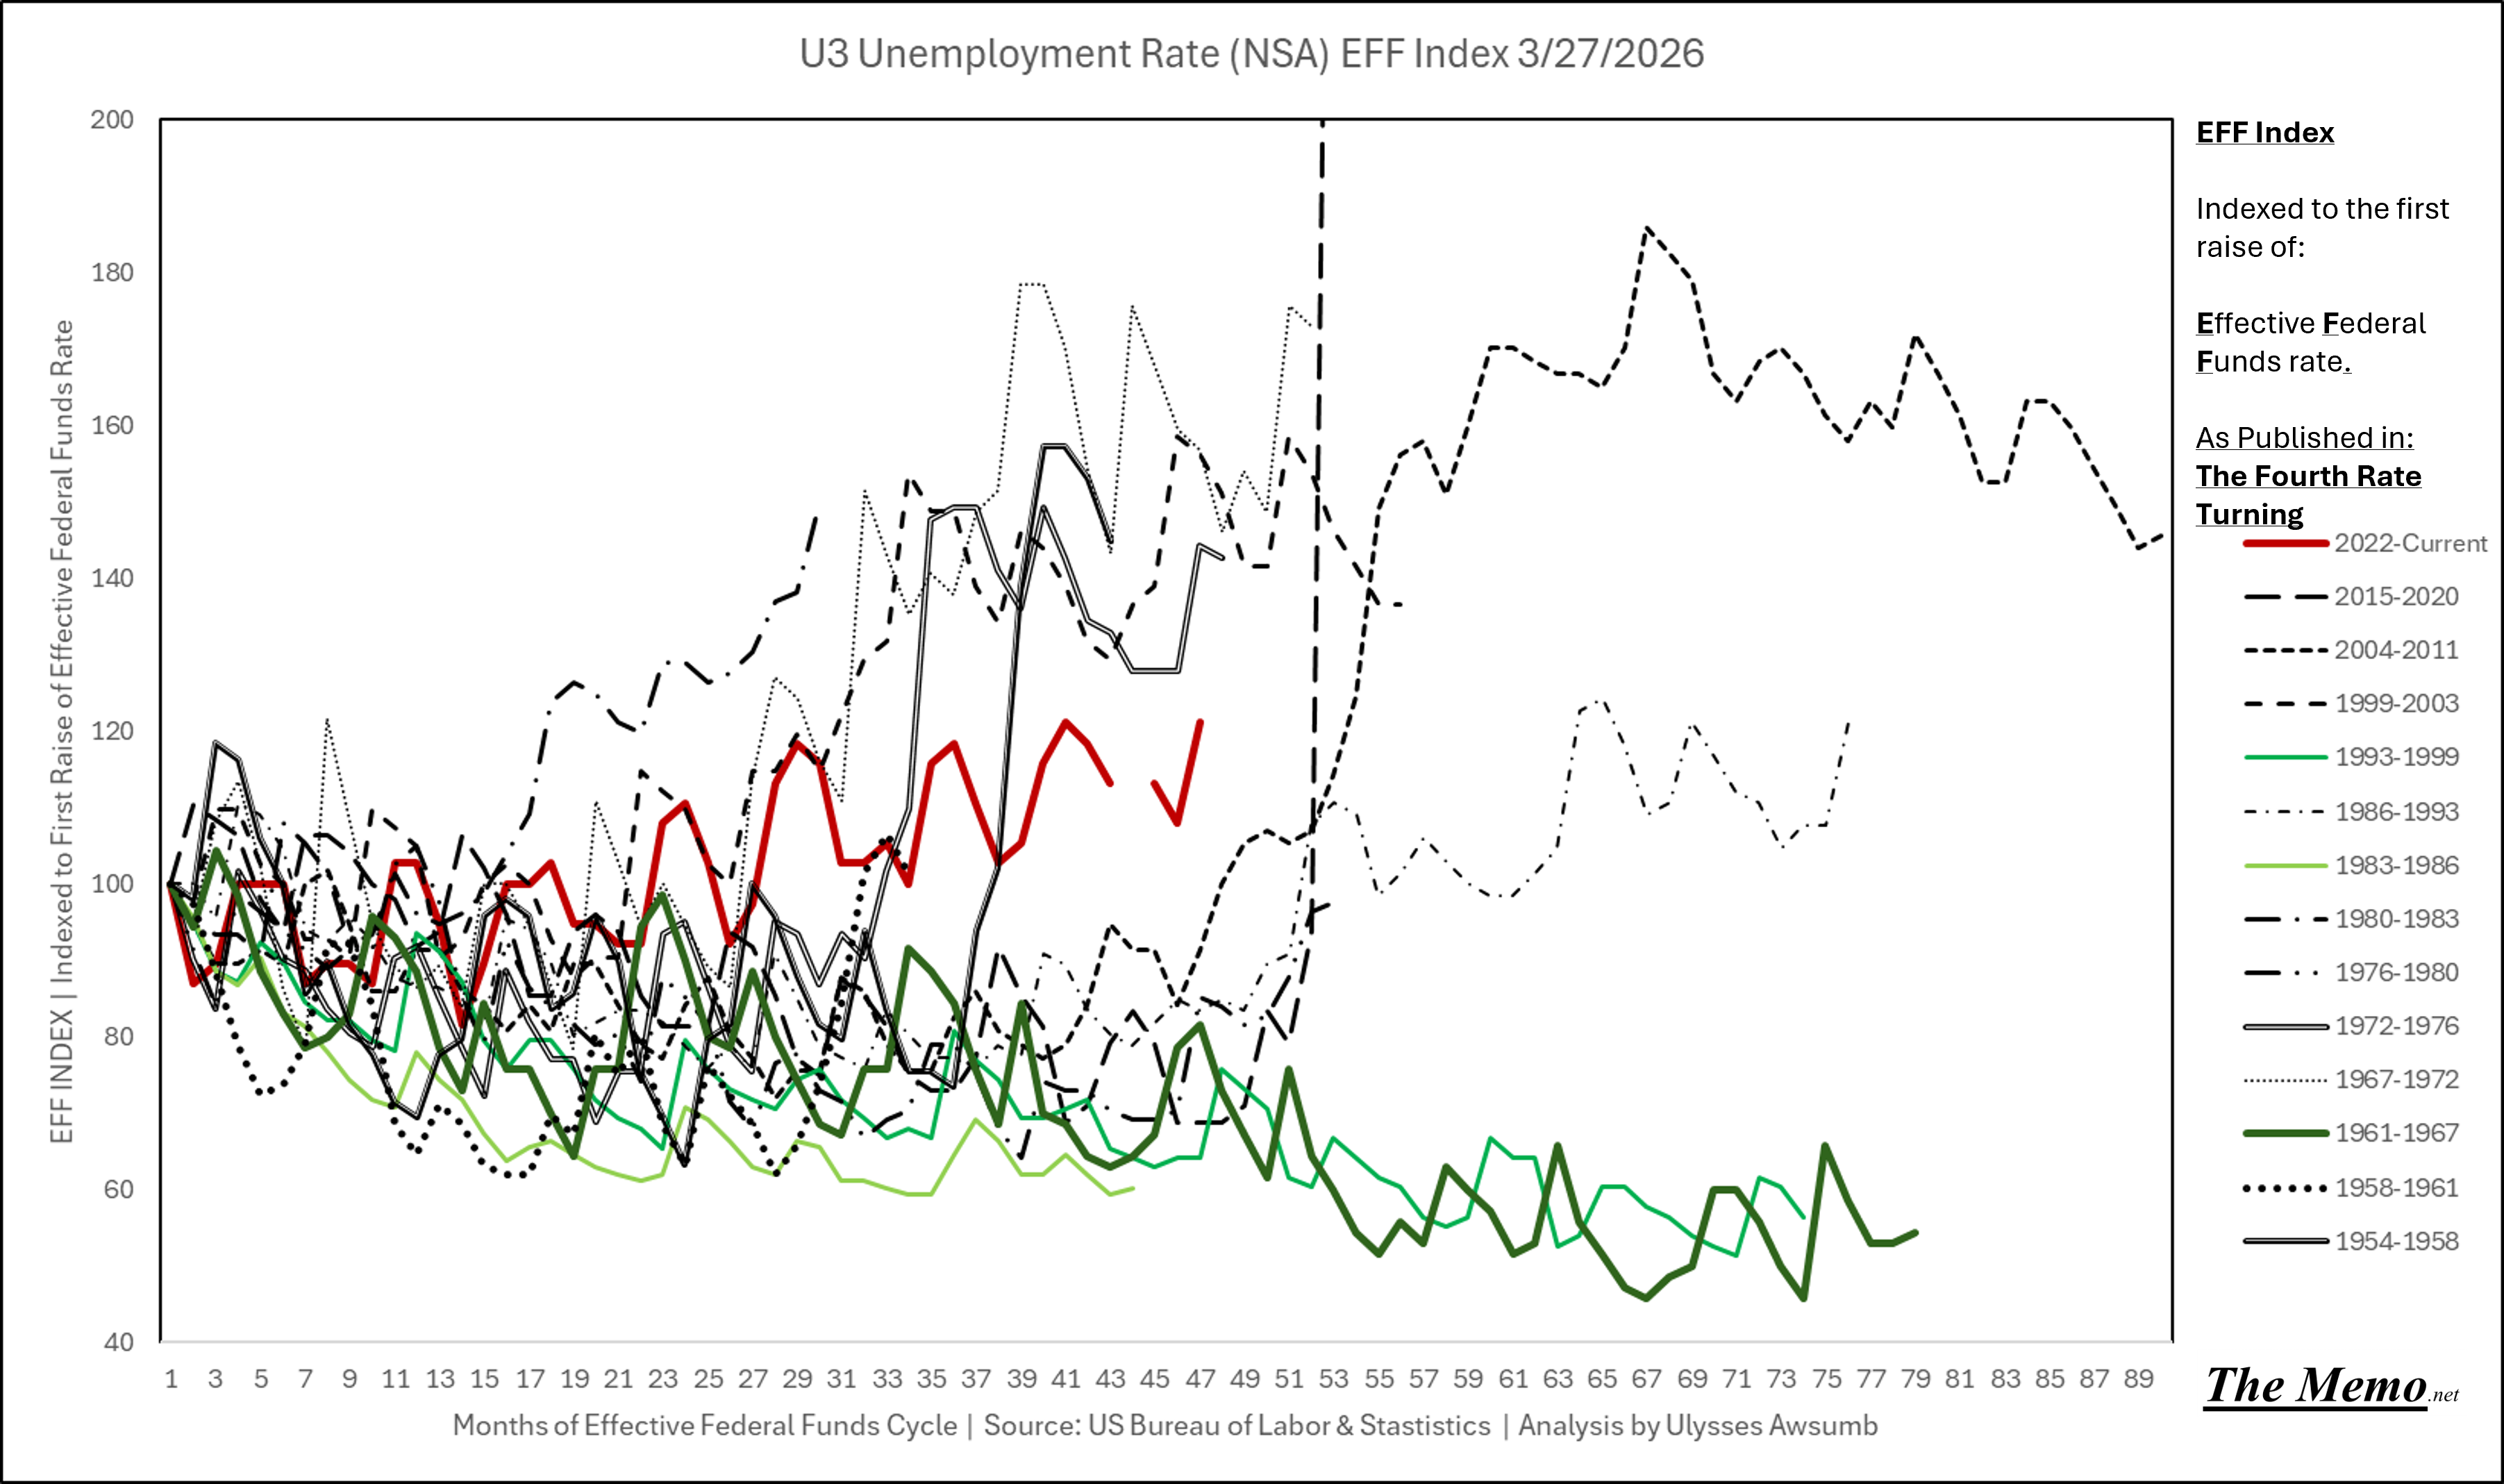
Unemployment
February brought a new cycle high U3 Unemployment rate of 4.7%. The highest in 4 years of steady slow rise. When I say we’ve been here before, this is what I mean.
I do not expect this to decline in Q2 as I see no magic wand or phrase to stop the march of the machine. And we bear no similarity to the green soft landings in the chart.

NASDAQ
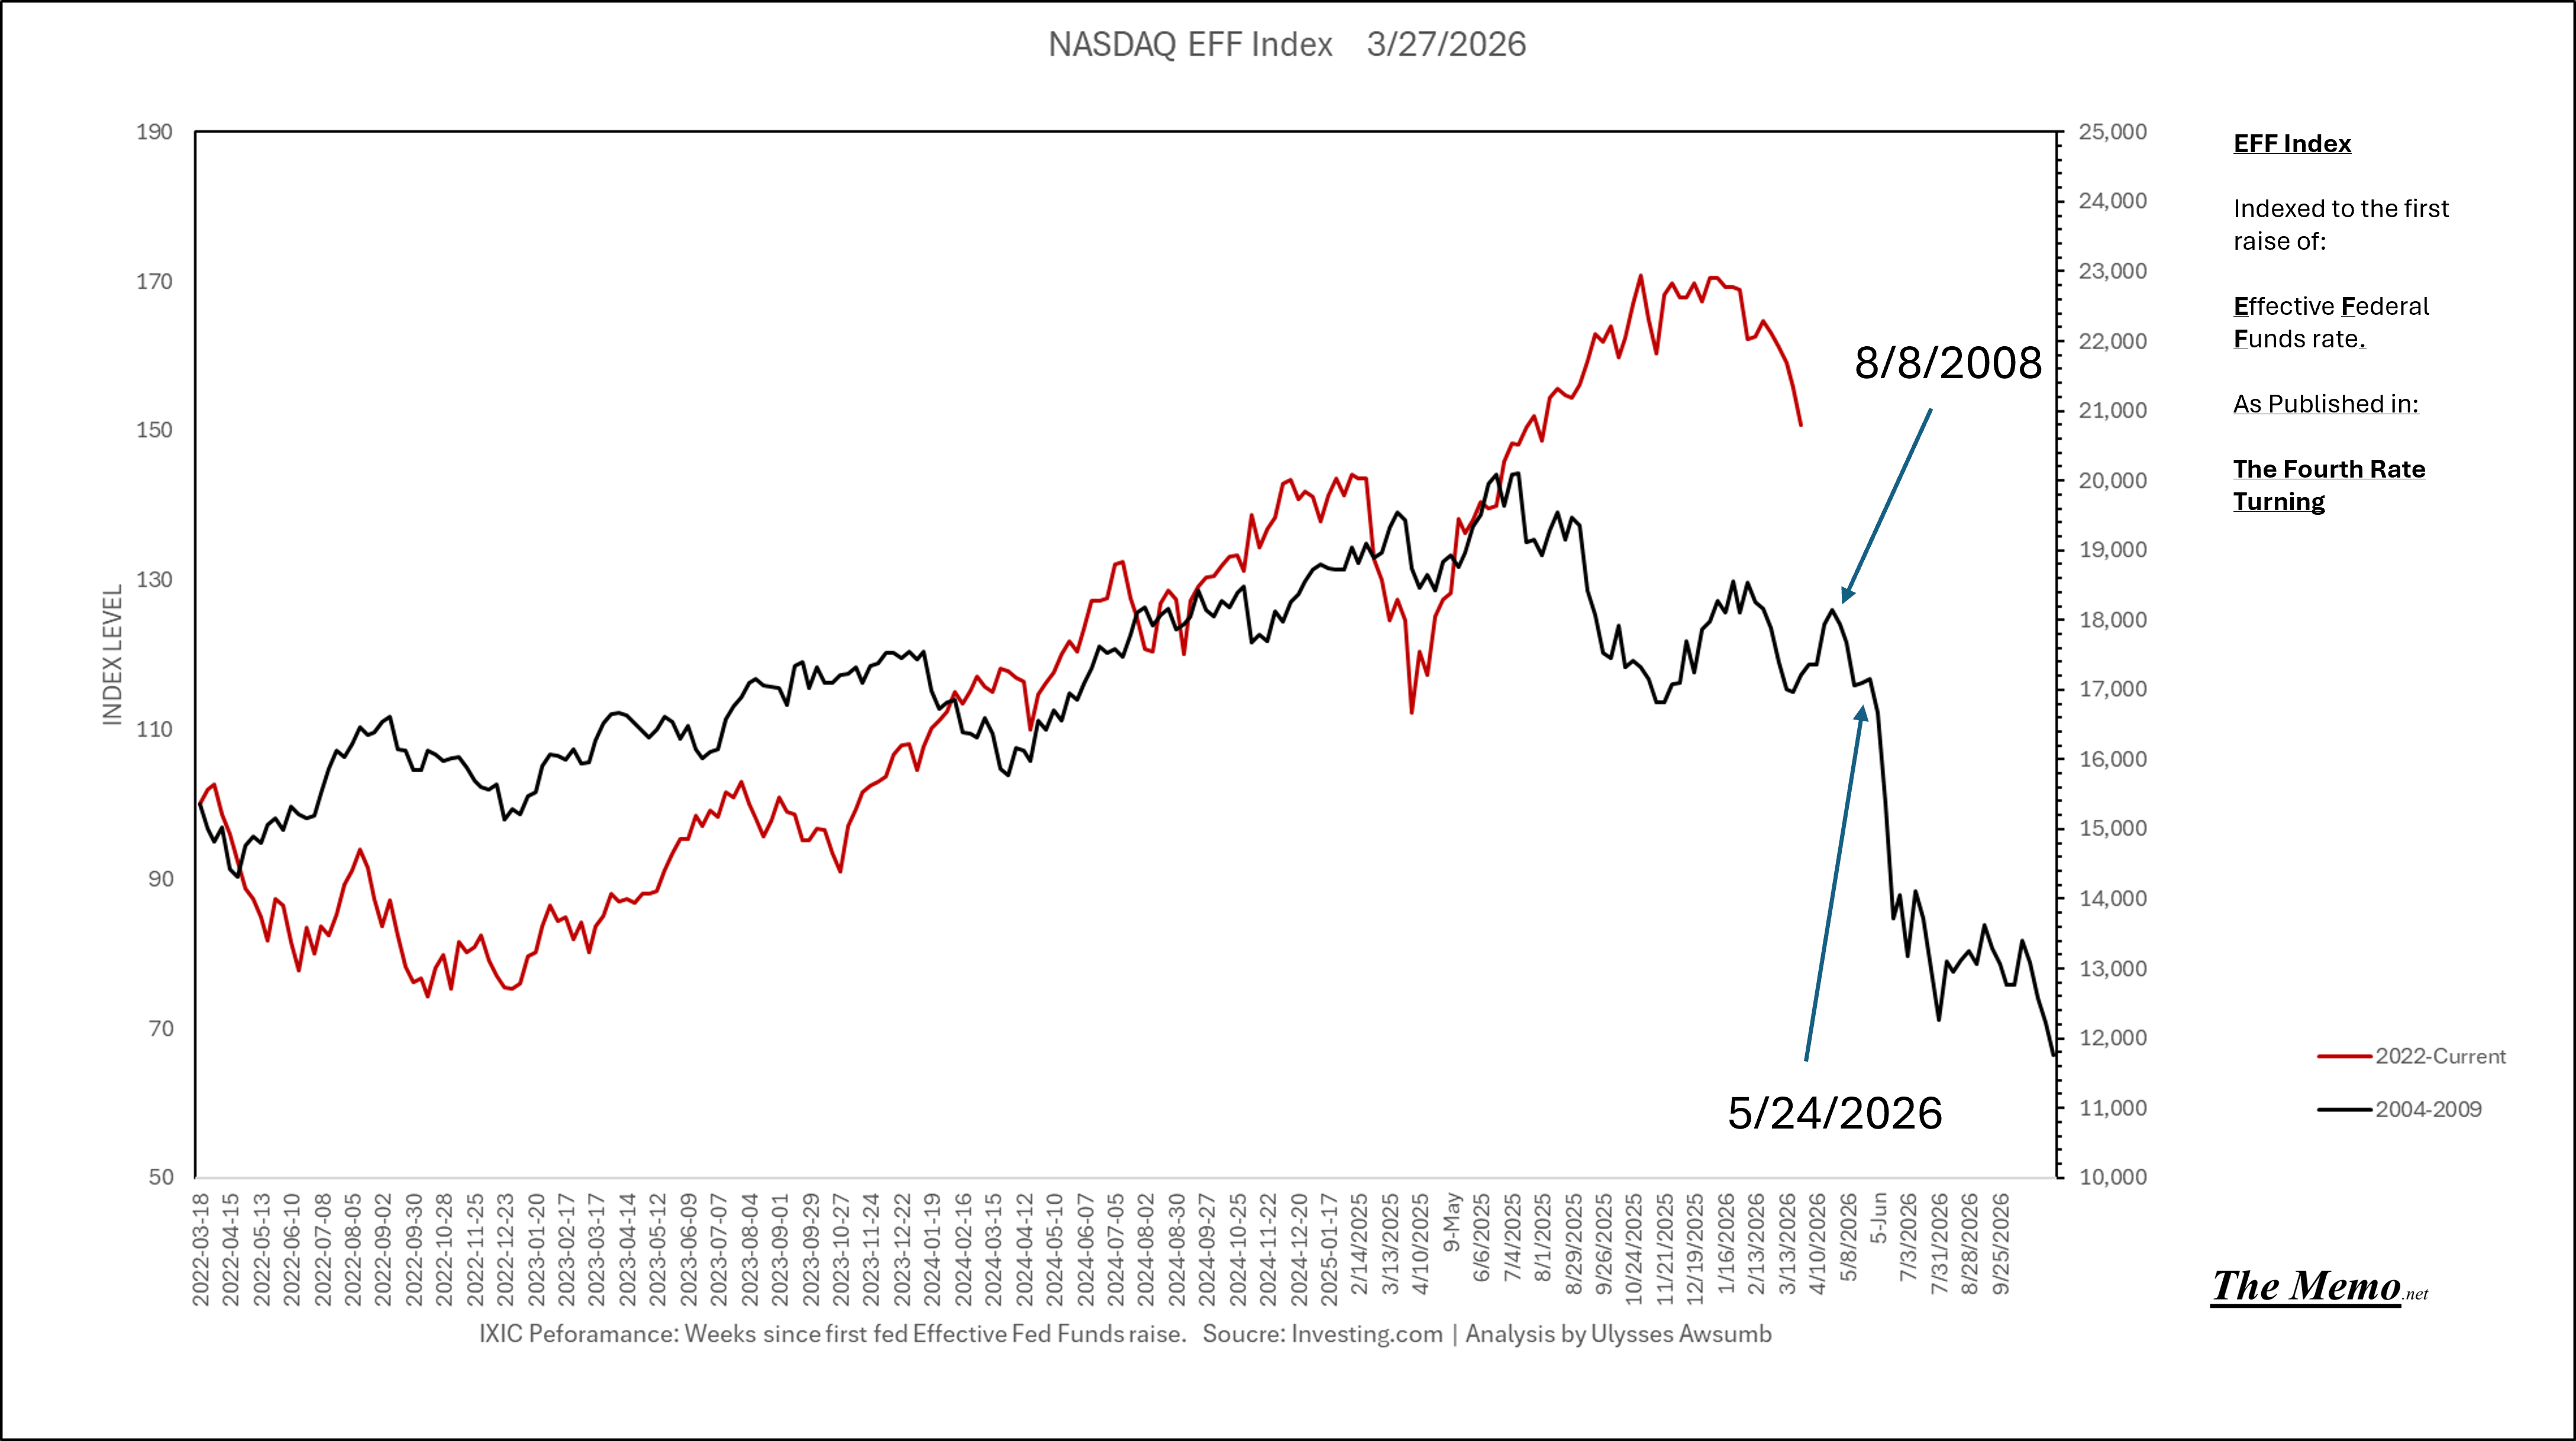
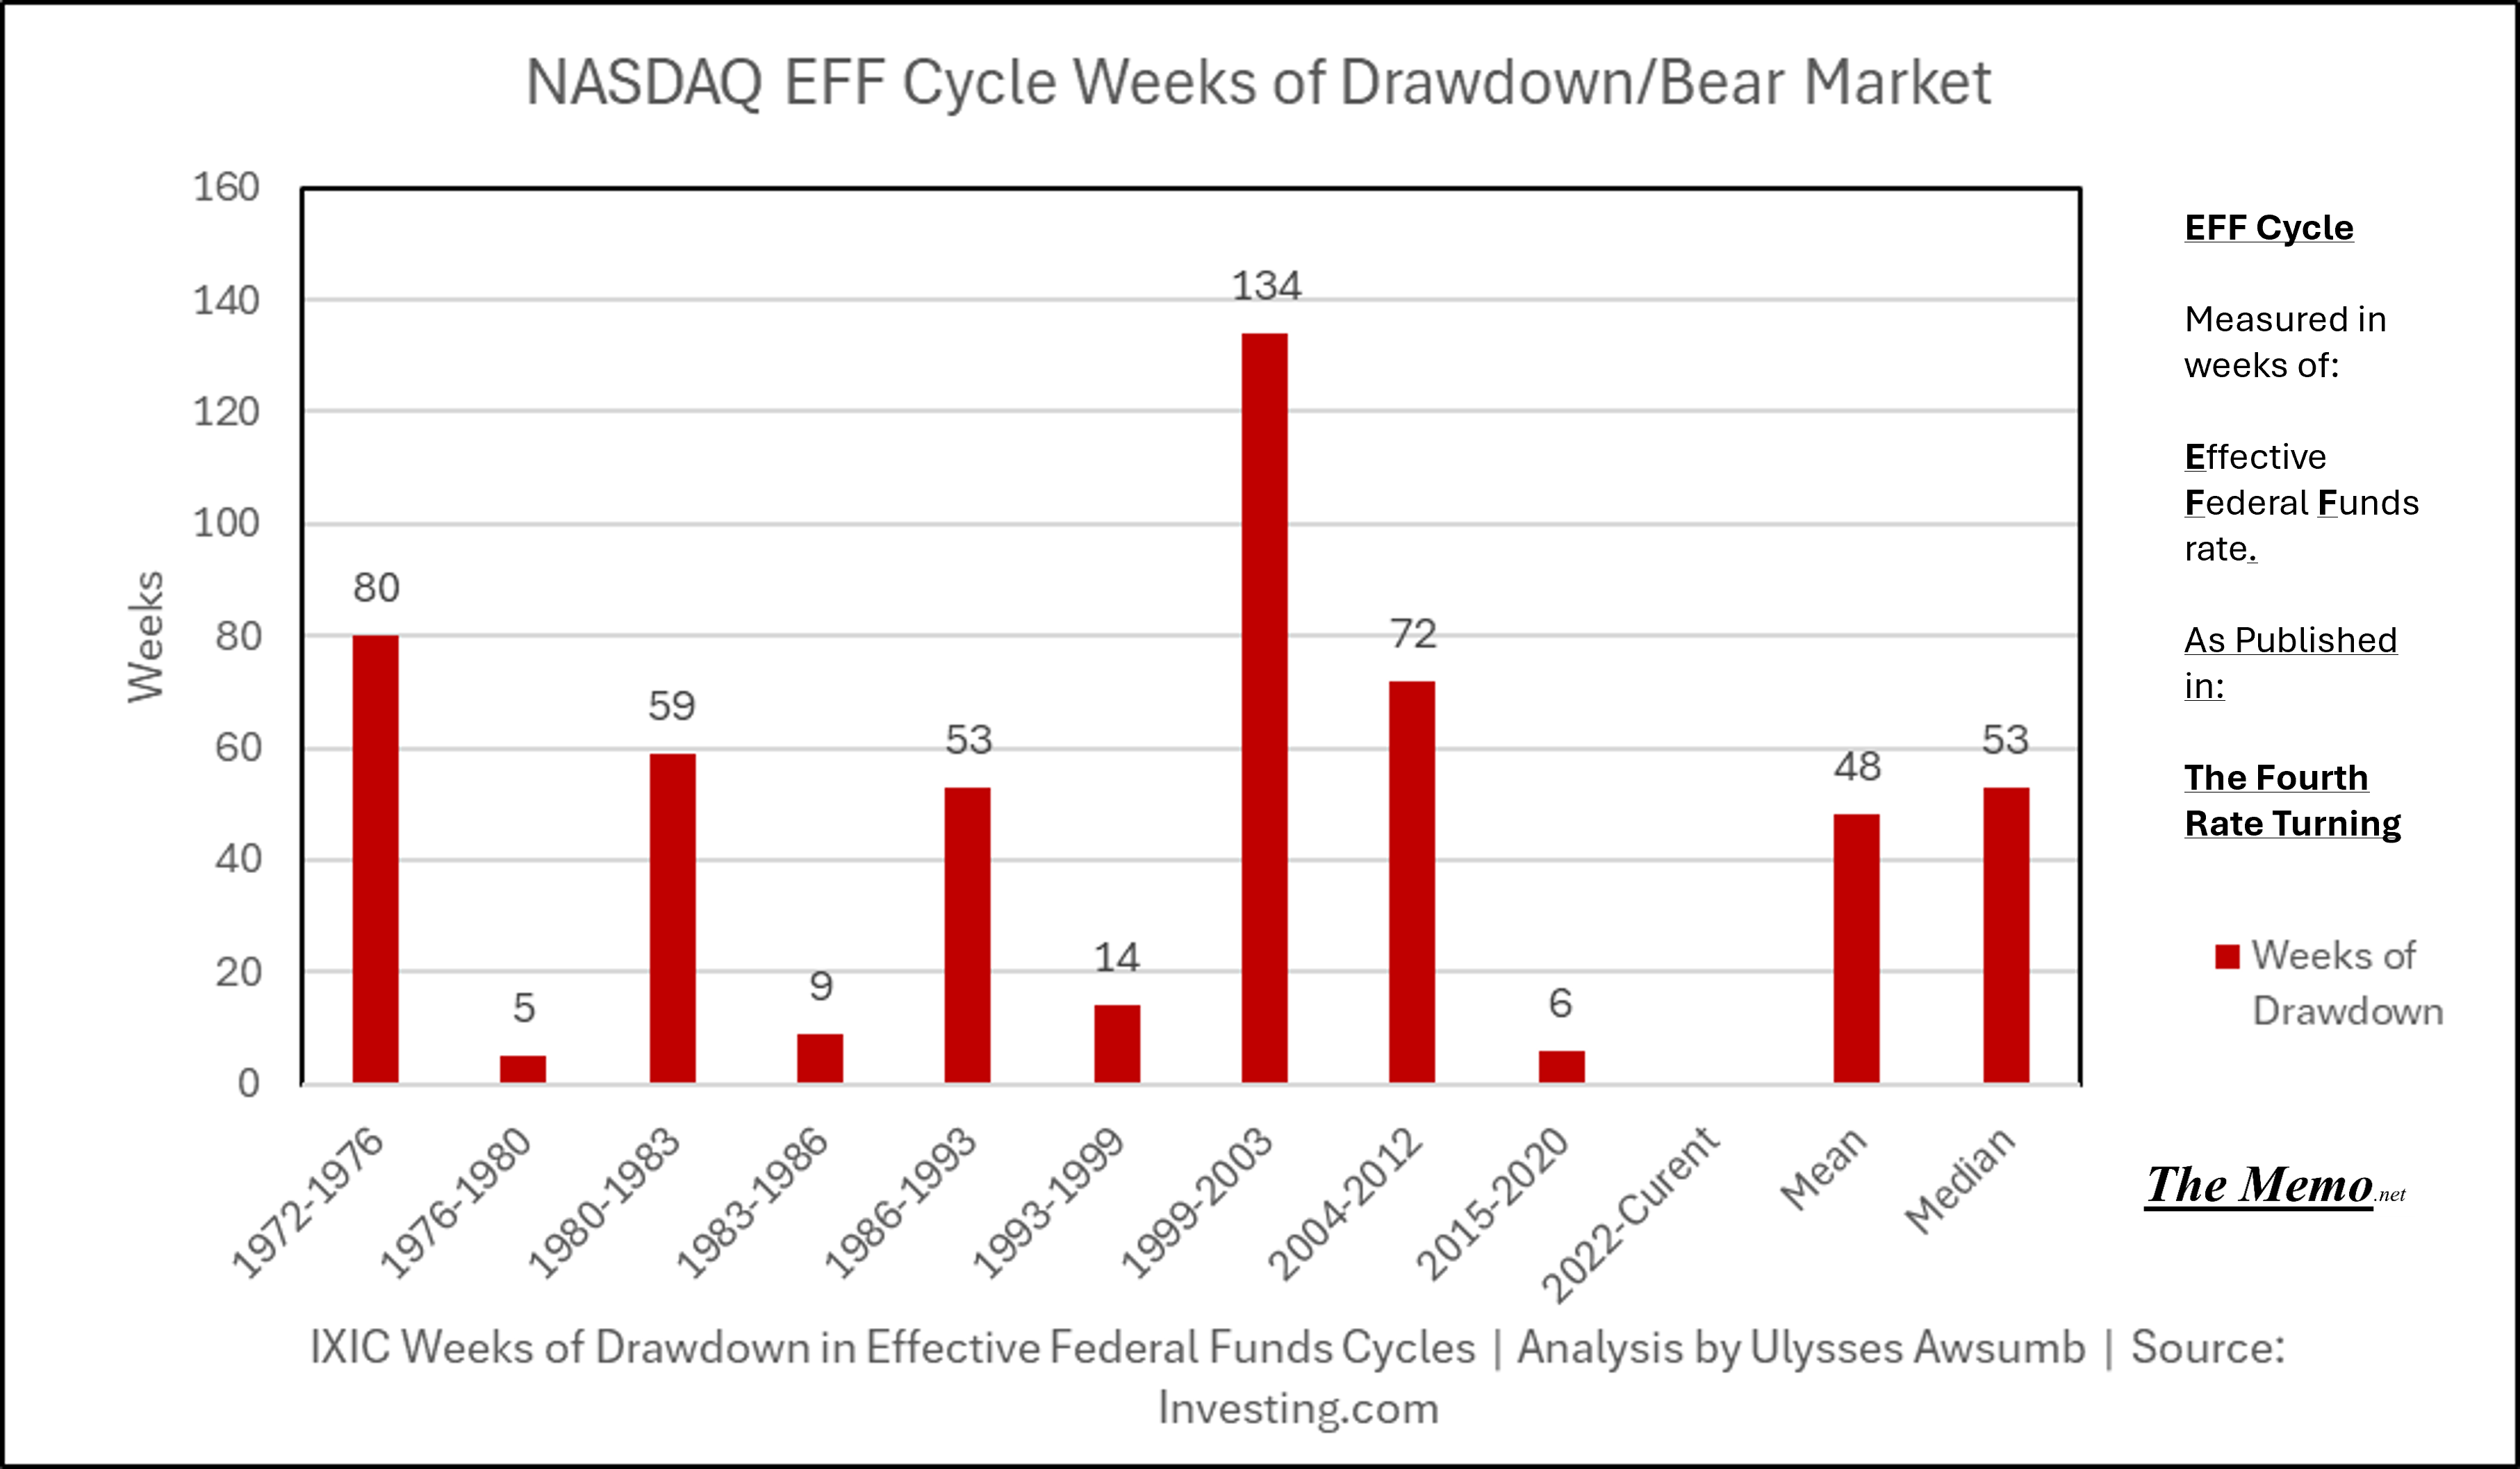
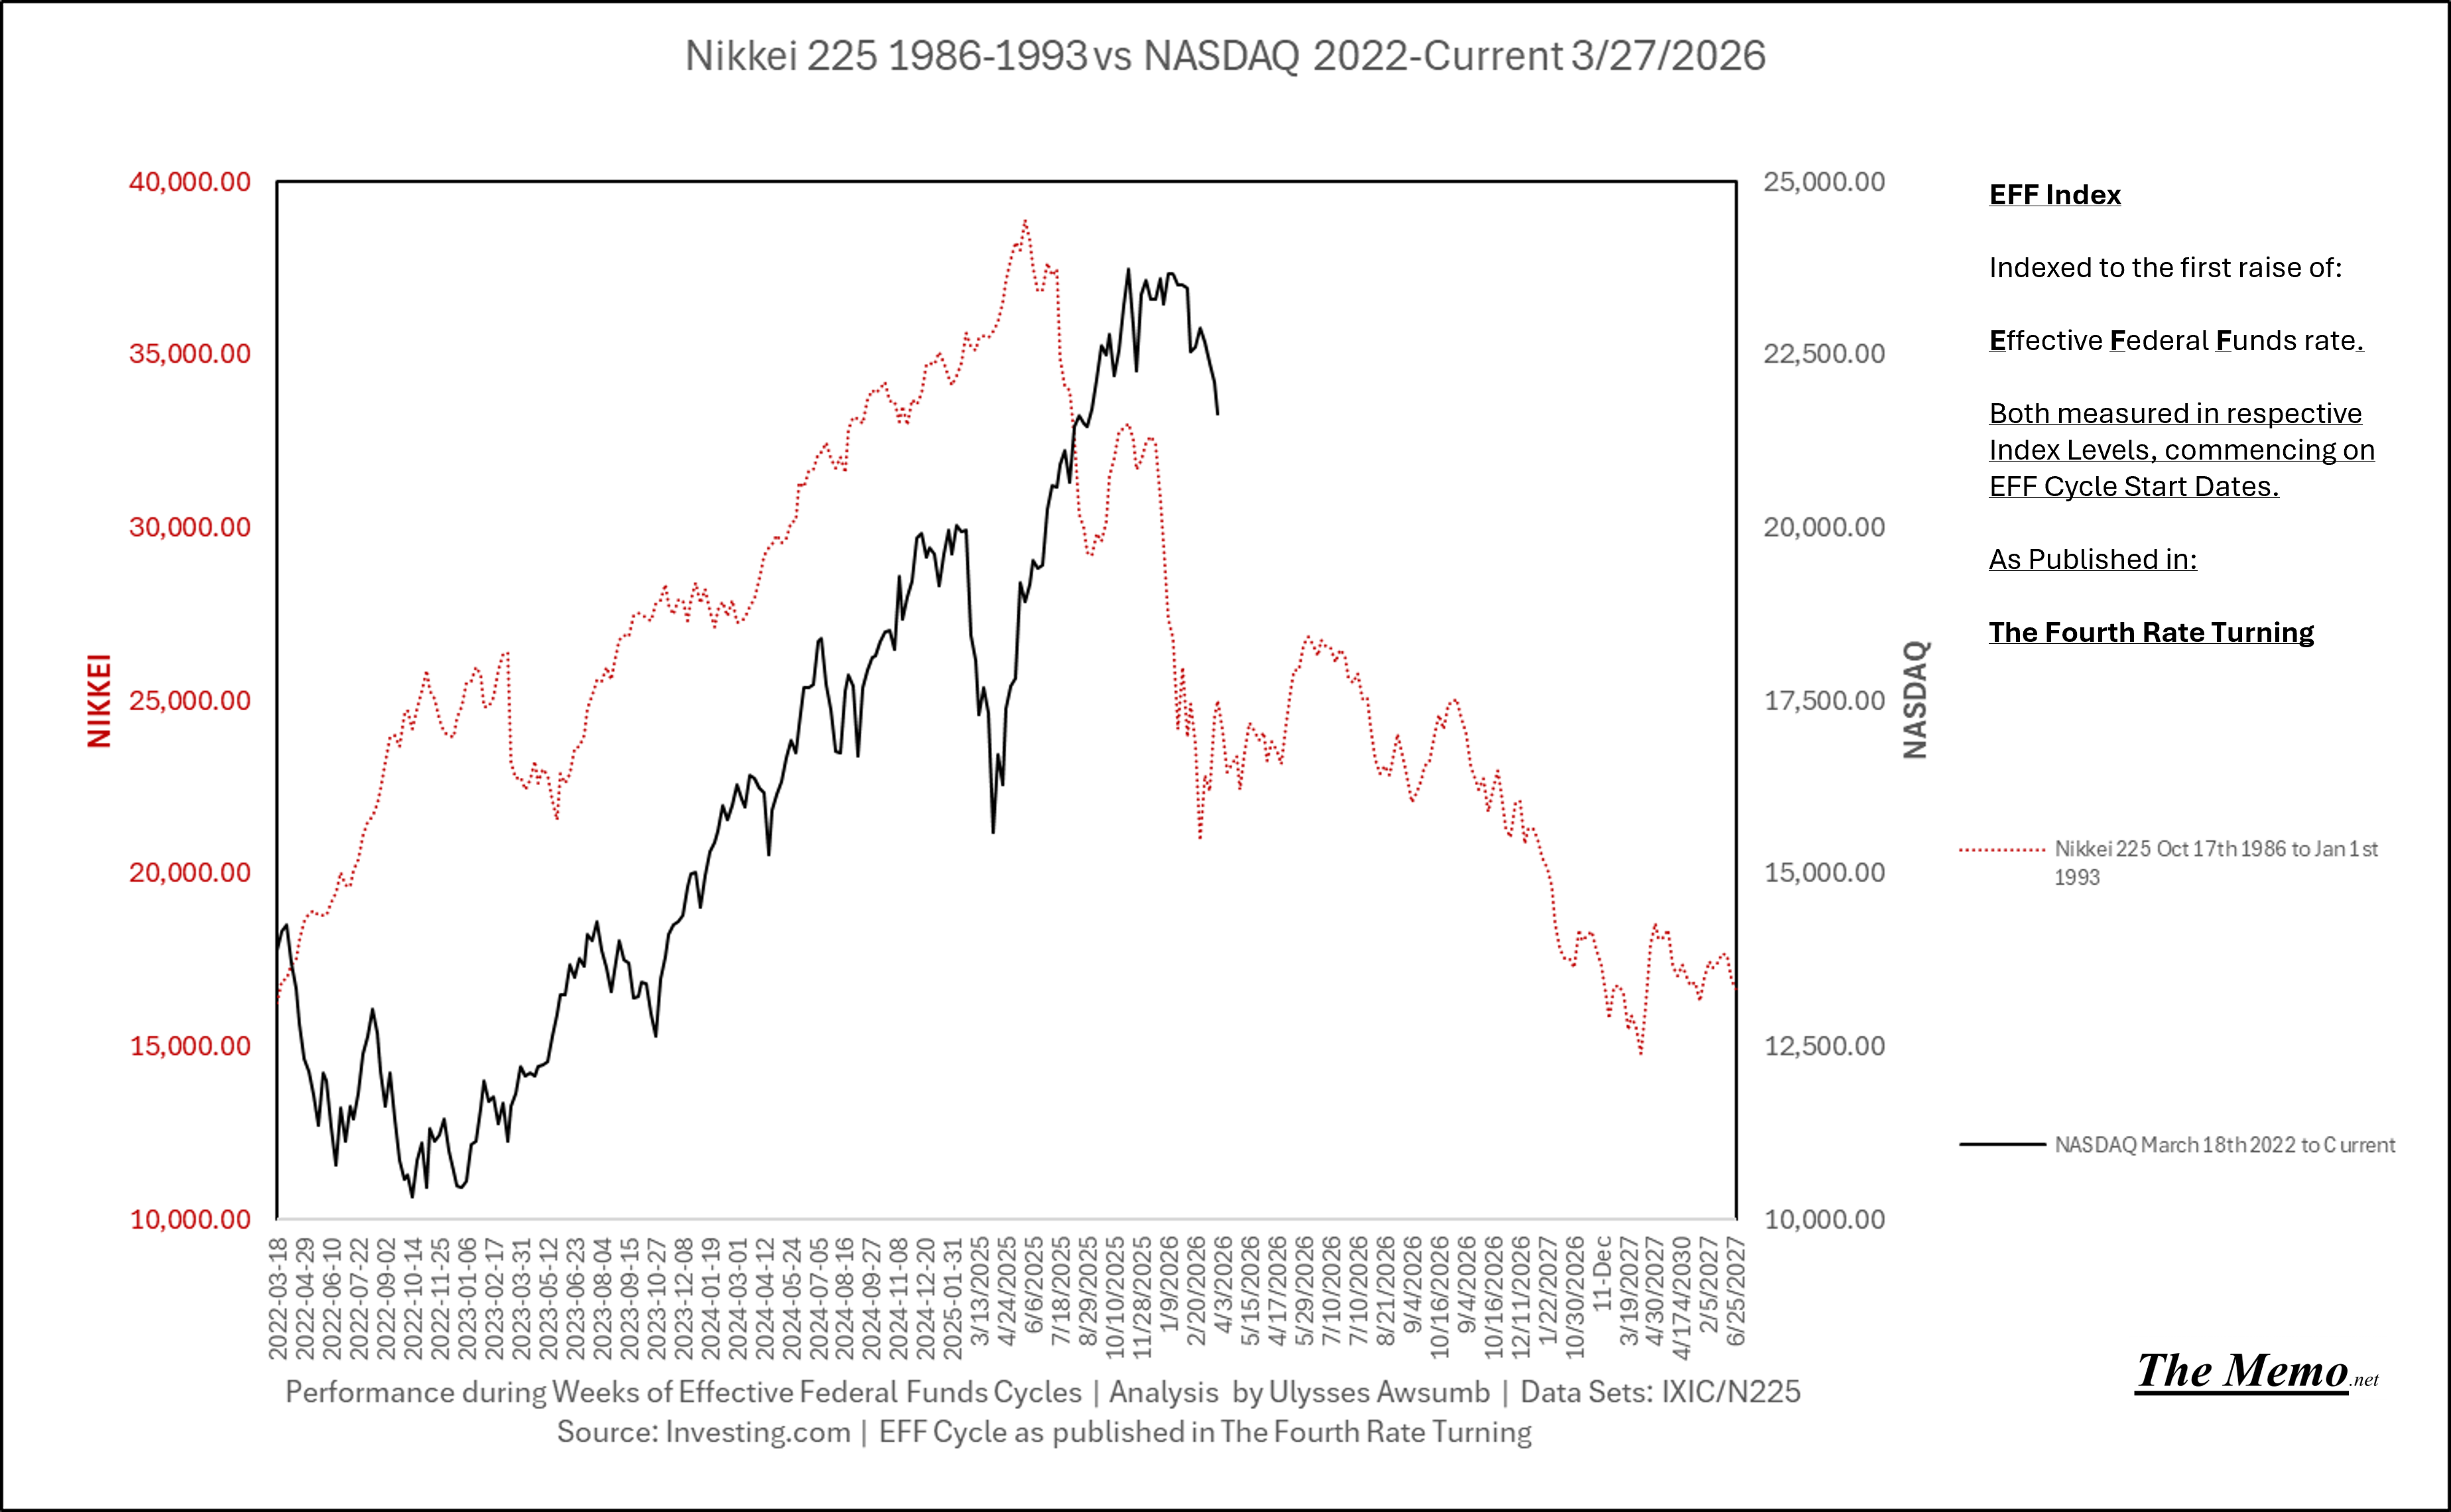
We have entered “Winter”, the final phase of this rate turning. Despite yesterday’s headlines, we are in the 21st week of drawdown for the NASDAQ. As of Monday it was down 13.5%, which is halfway to my last stated target of between 20-30% from peak.
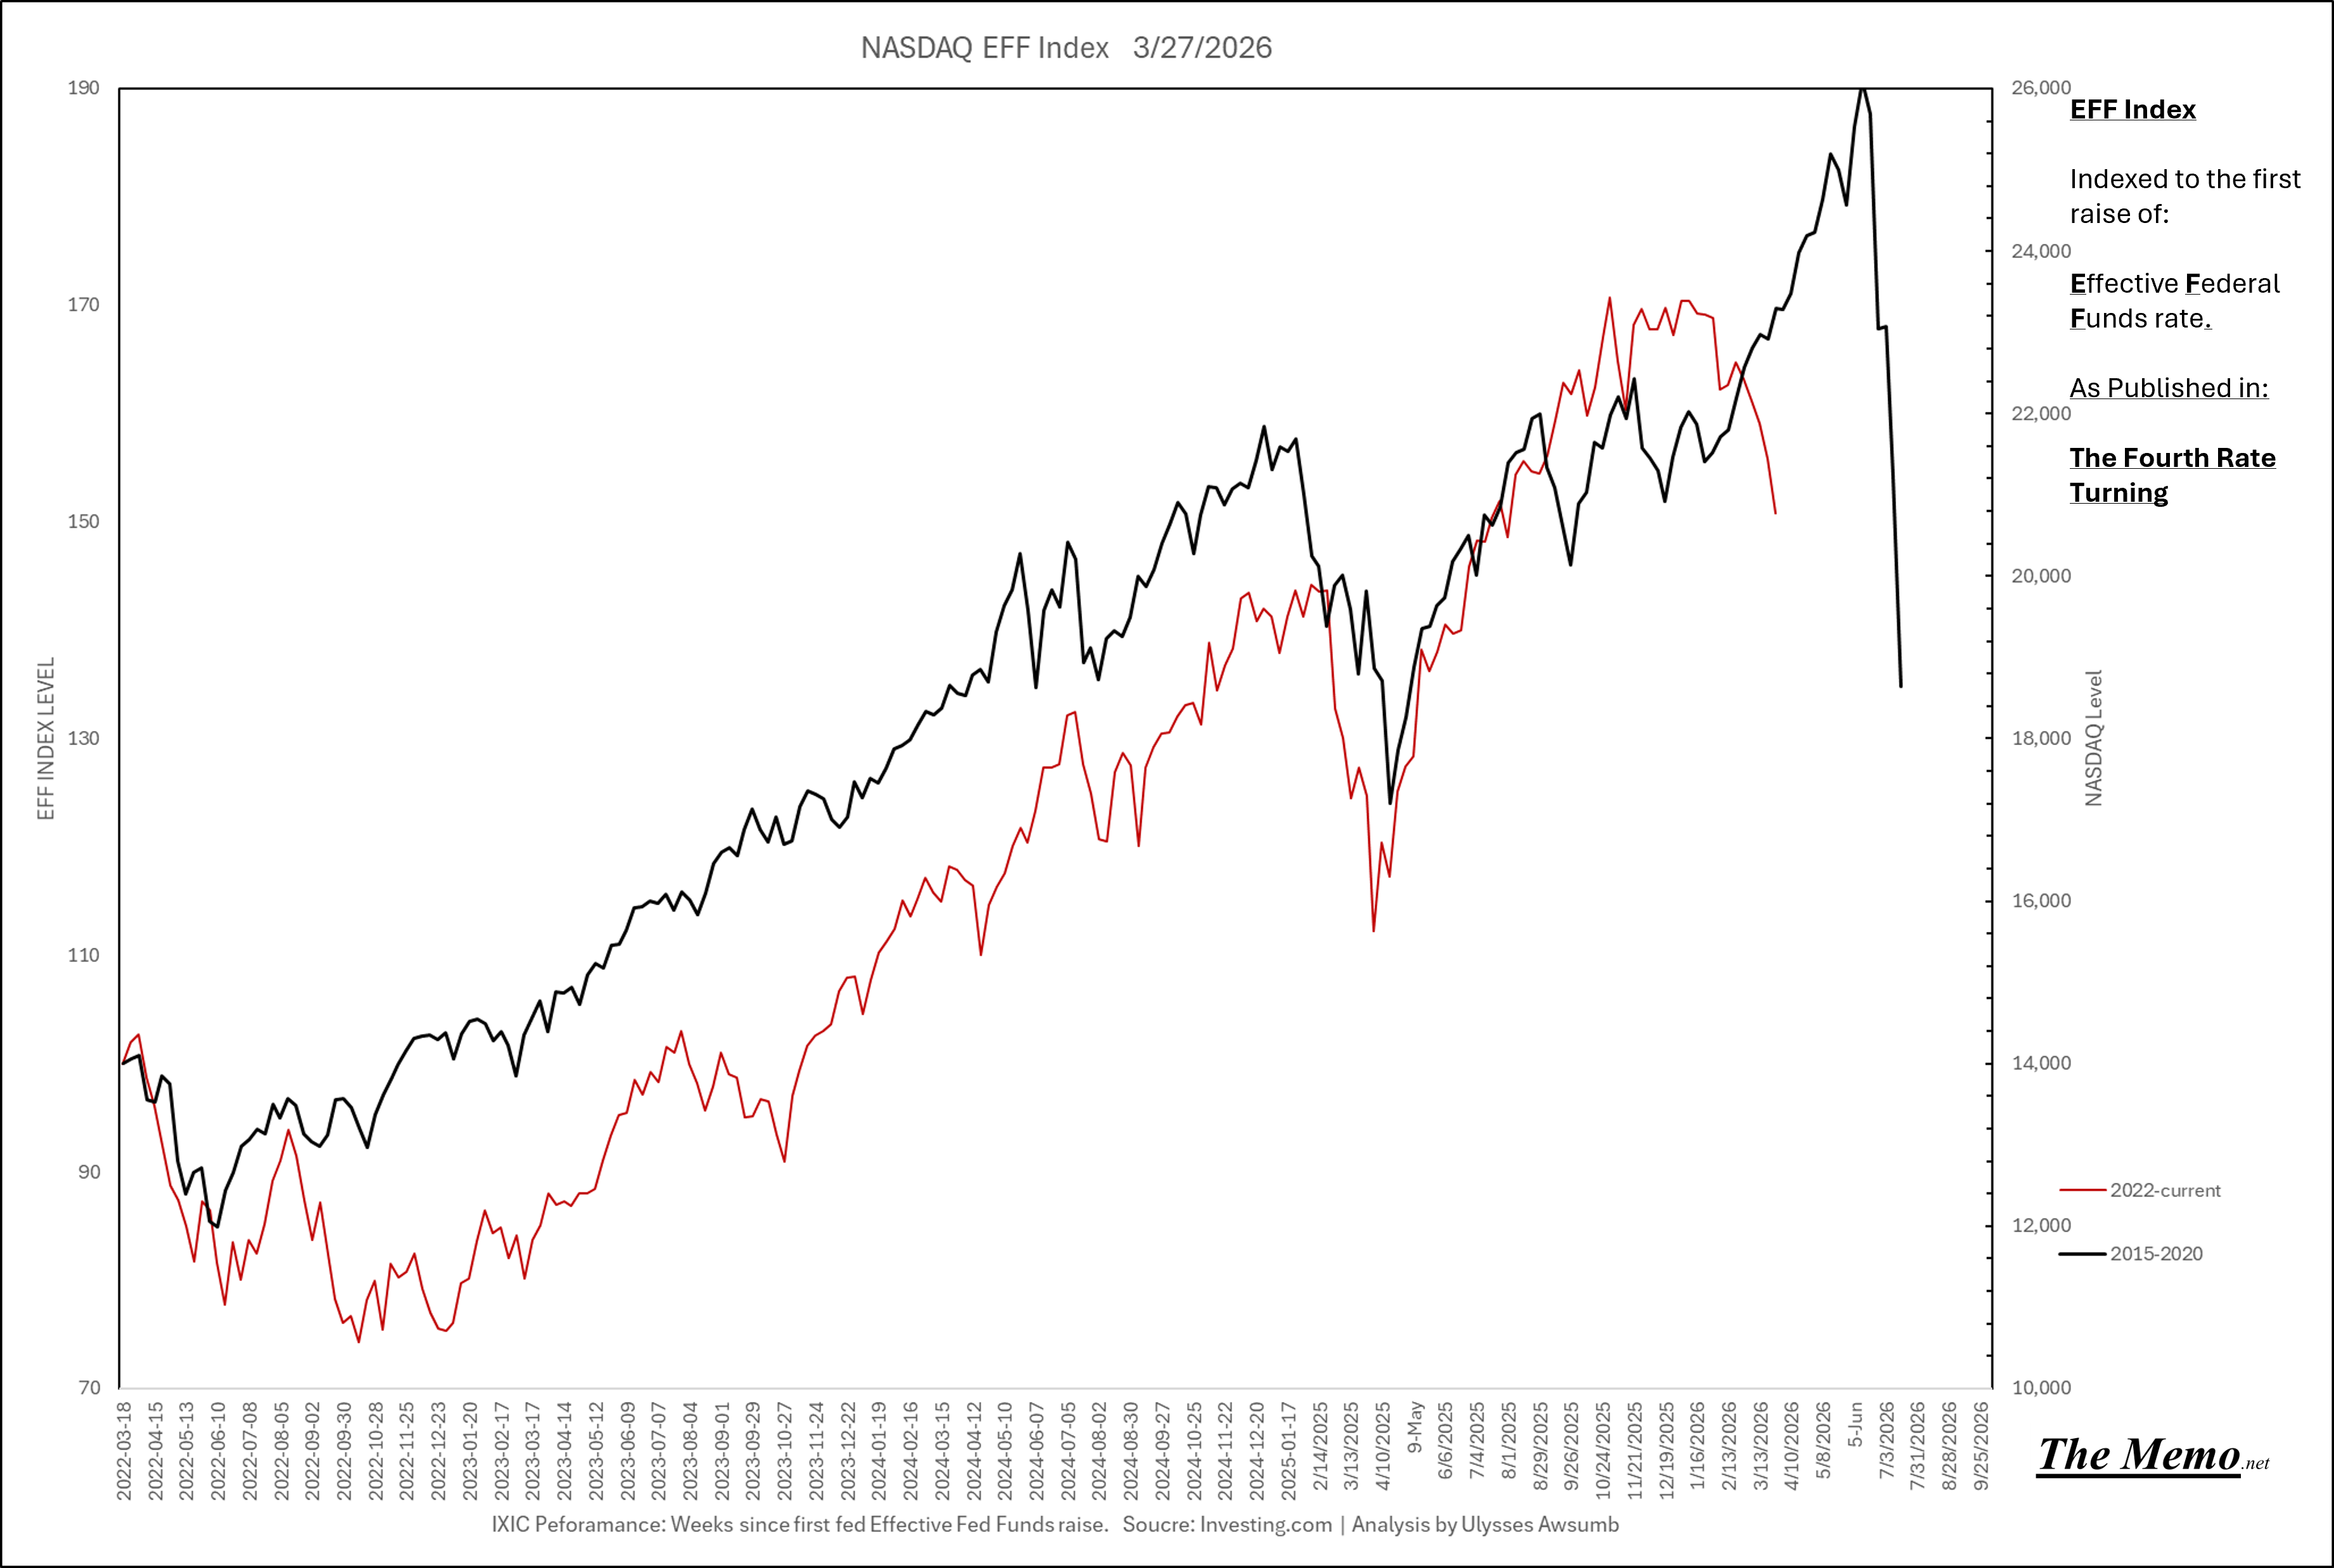
With unemployment rising higher, oil spiking, economic uncertainty and war escalating, I expect “sentiment” to capitulate within the quarter. I hadn’t ruled out following the trajectory of the 2008-2009 cycle, instead of the 2019-2020, and it does now appear to be closer to where things are headed (on a drawdown phase).
This one has been updated with Past and Future dates to tie the “today in effing time” component together. (Friendly reminder 8/7/2008, Fannie Mae {Federal National Mortgage Association} into conservatorship). May and June are looking lit.
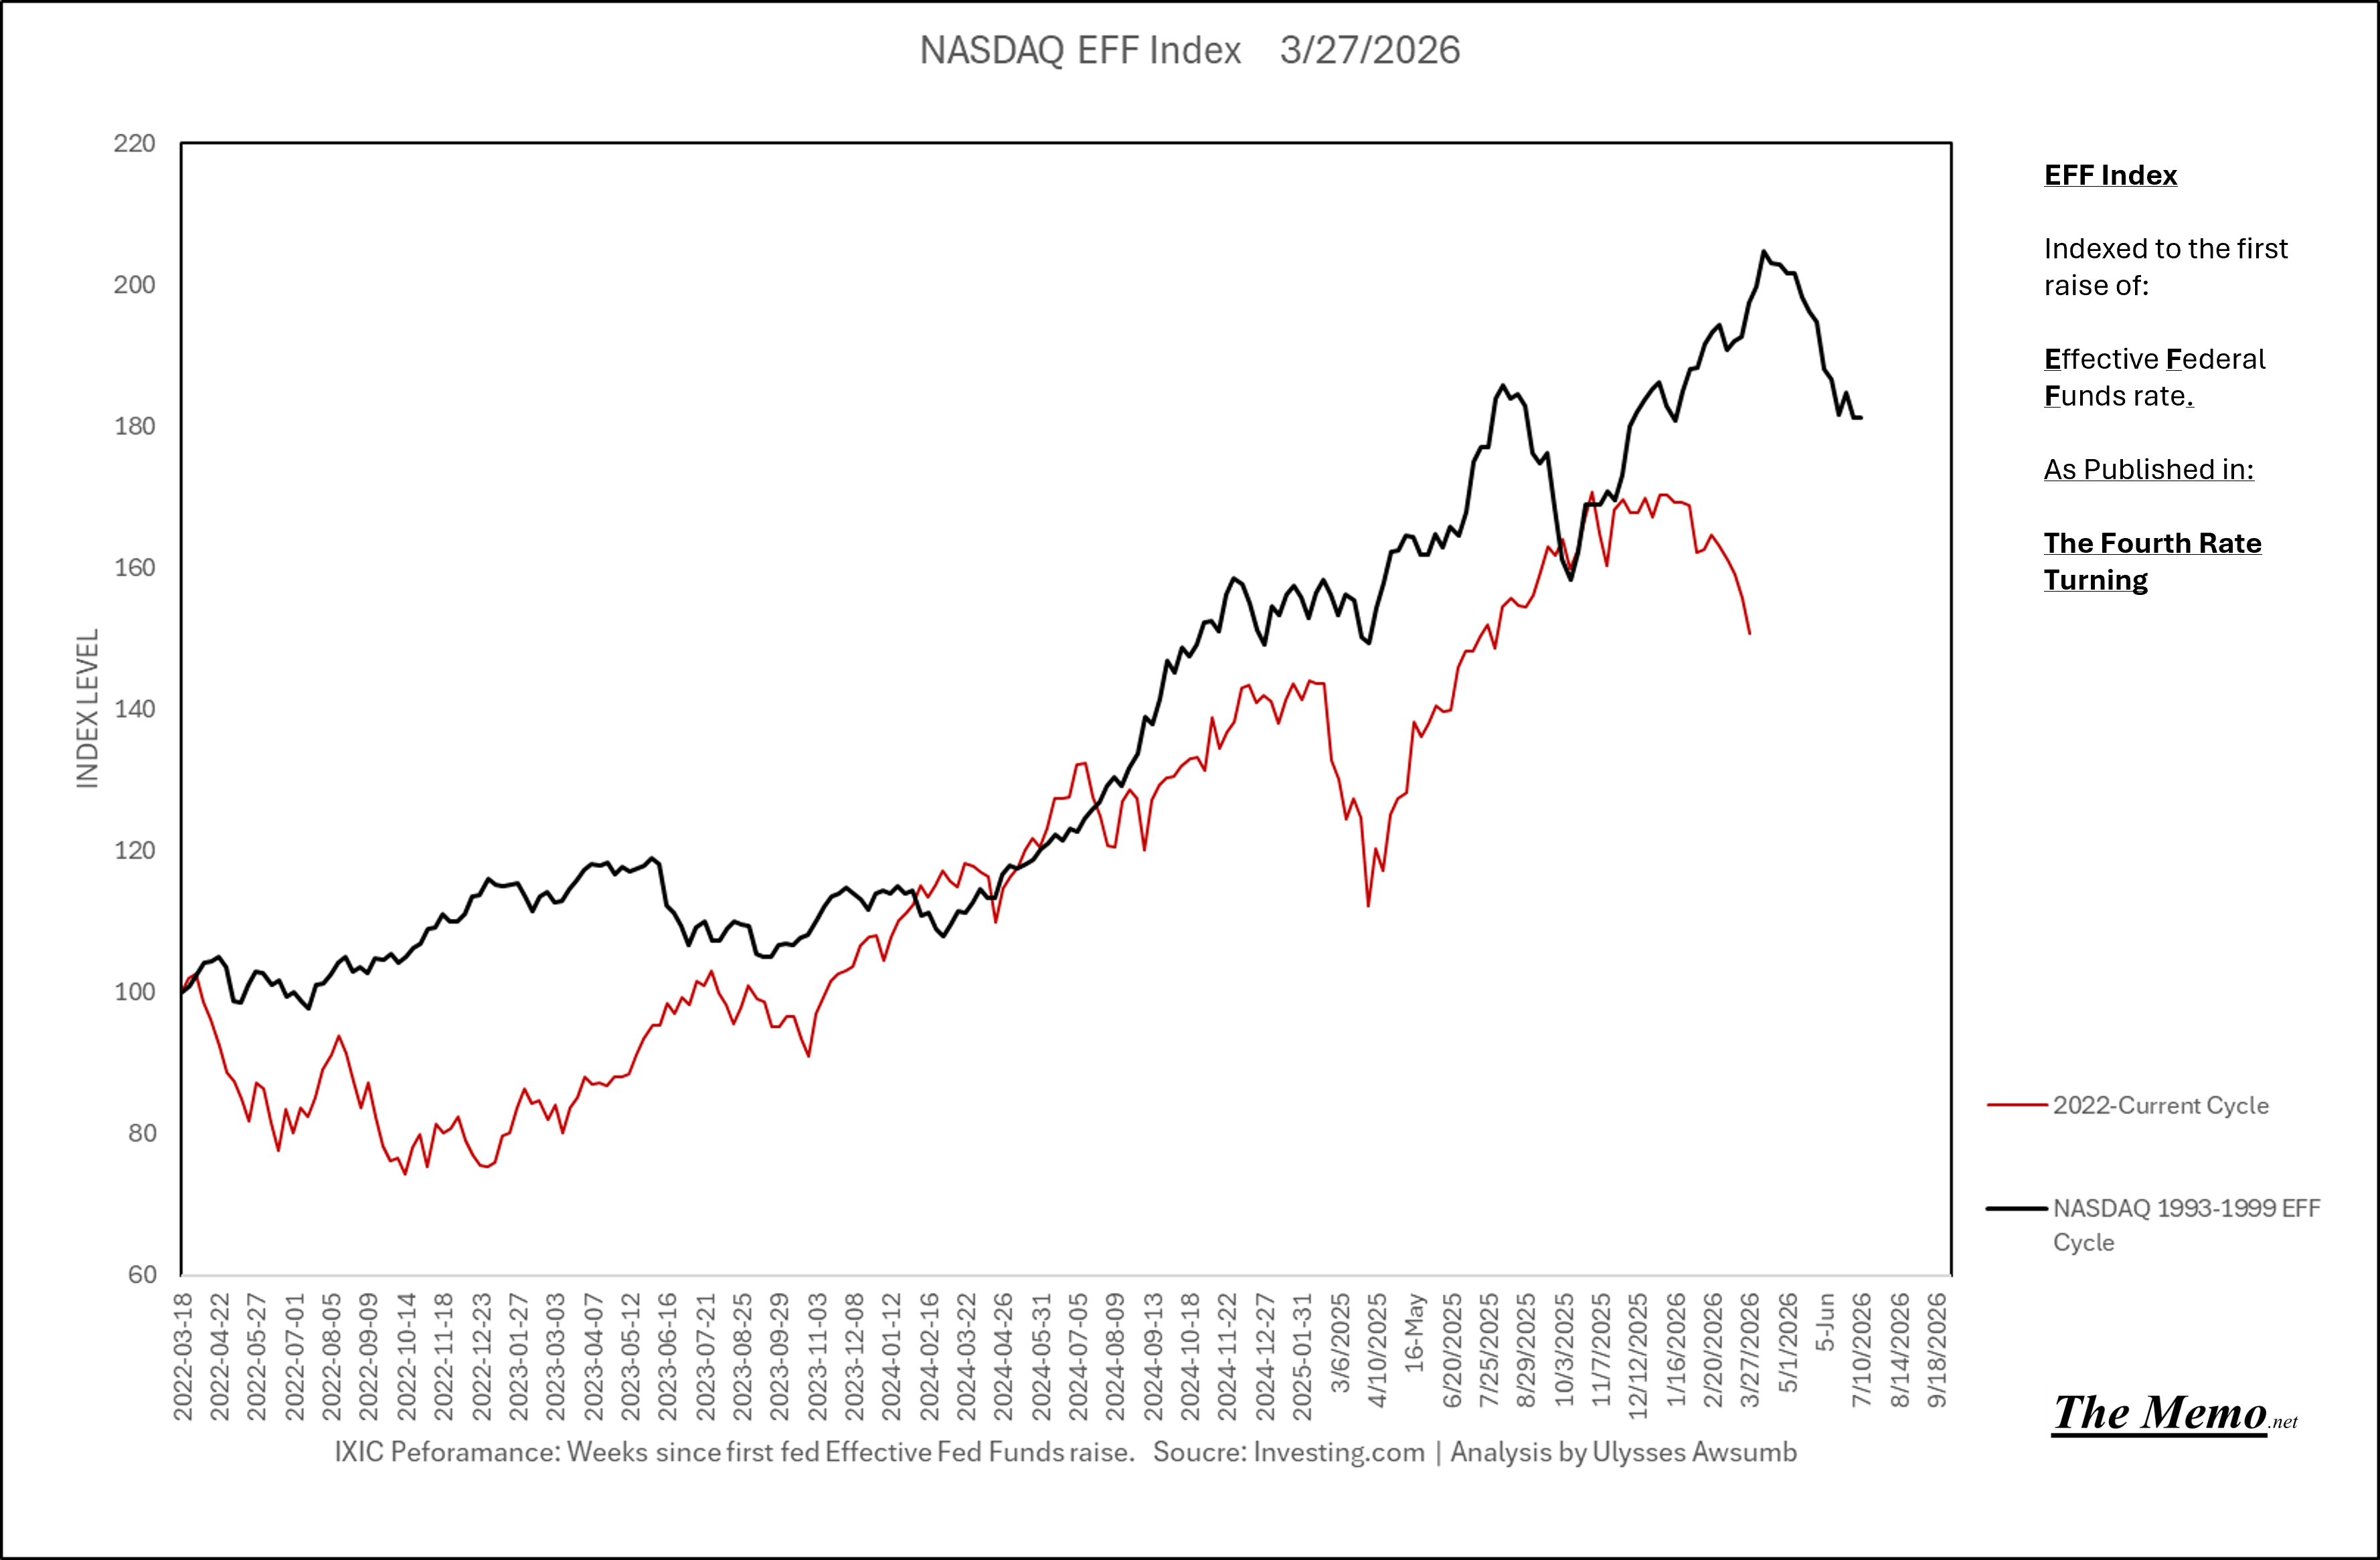
Divergence.
1997 - We’re just months away from the “Asian Tiger Crisis”. In the past.
February of 1980. 4 Months of continuing unemployment to 6.7% that would eventually reach 11.7% U3 in the W recession.
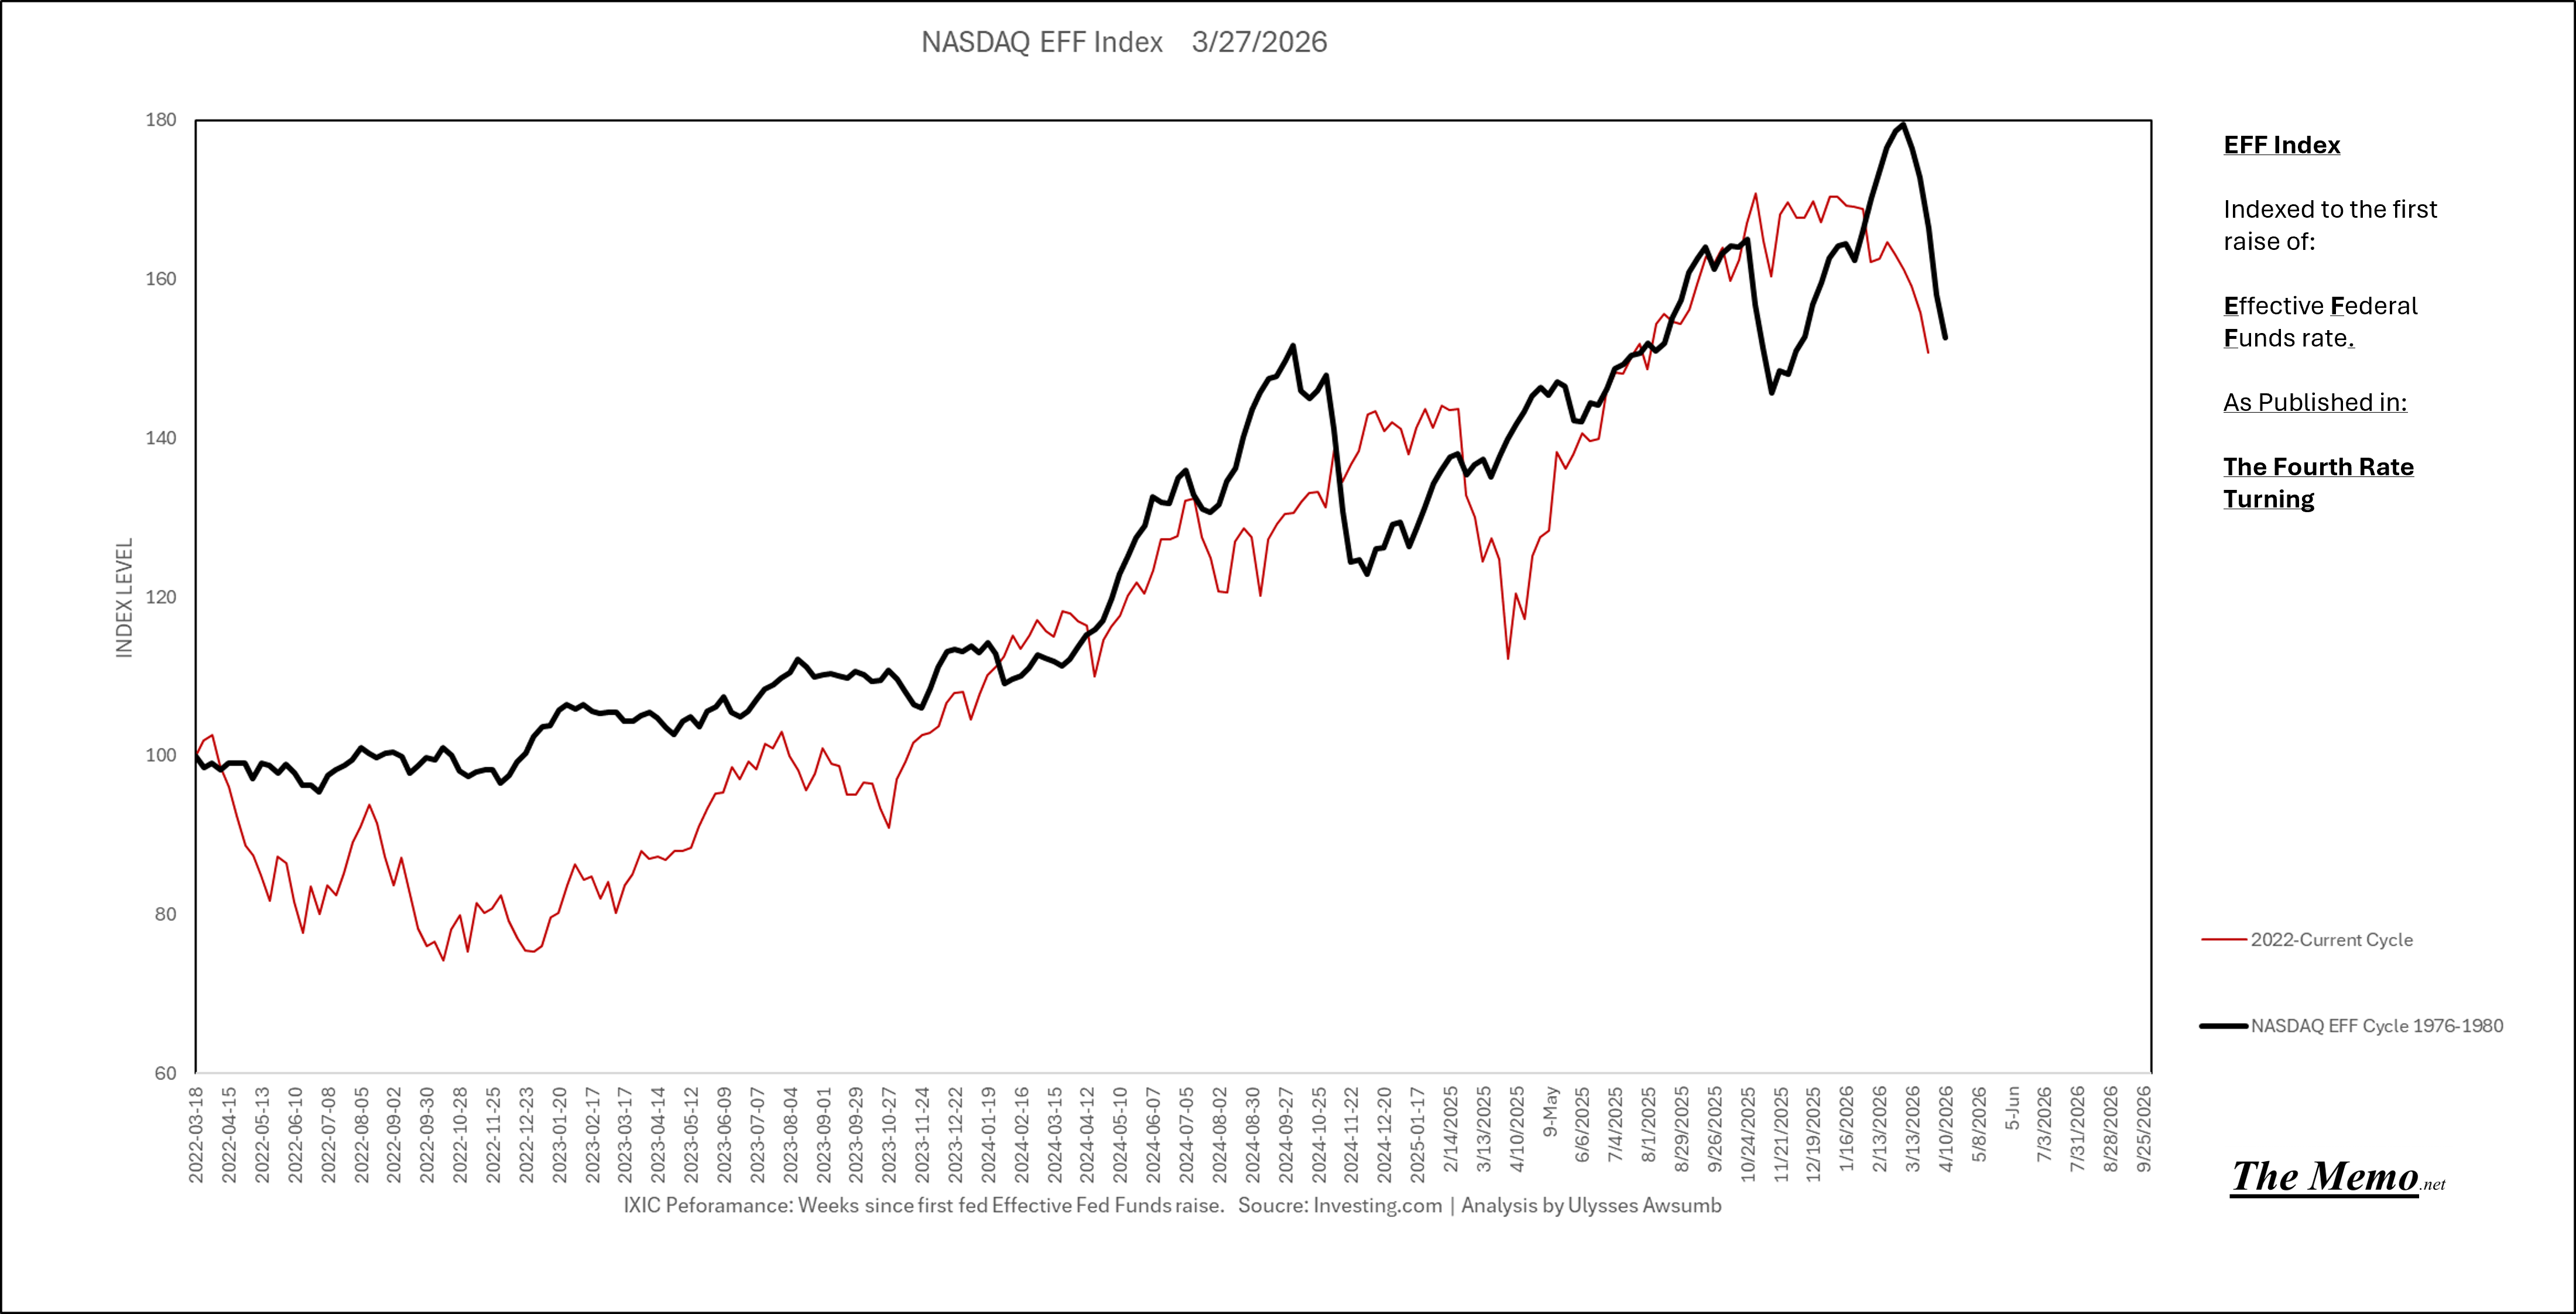
And just for fun, let’s take a look at the most similar cycles, from last post, in their conclusionary stages. From Cycle week 198-239.
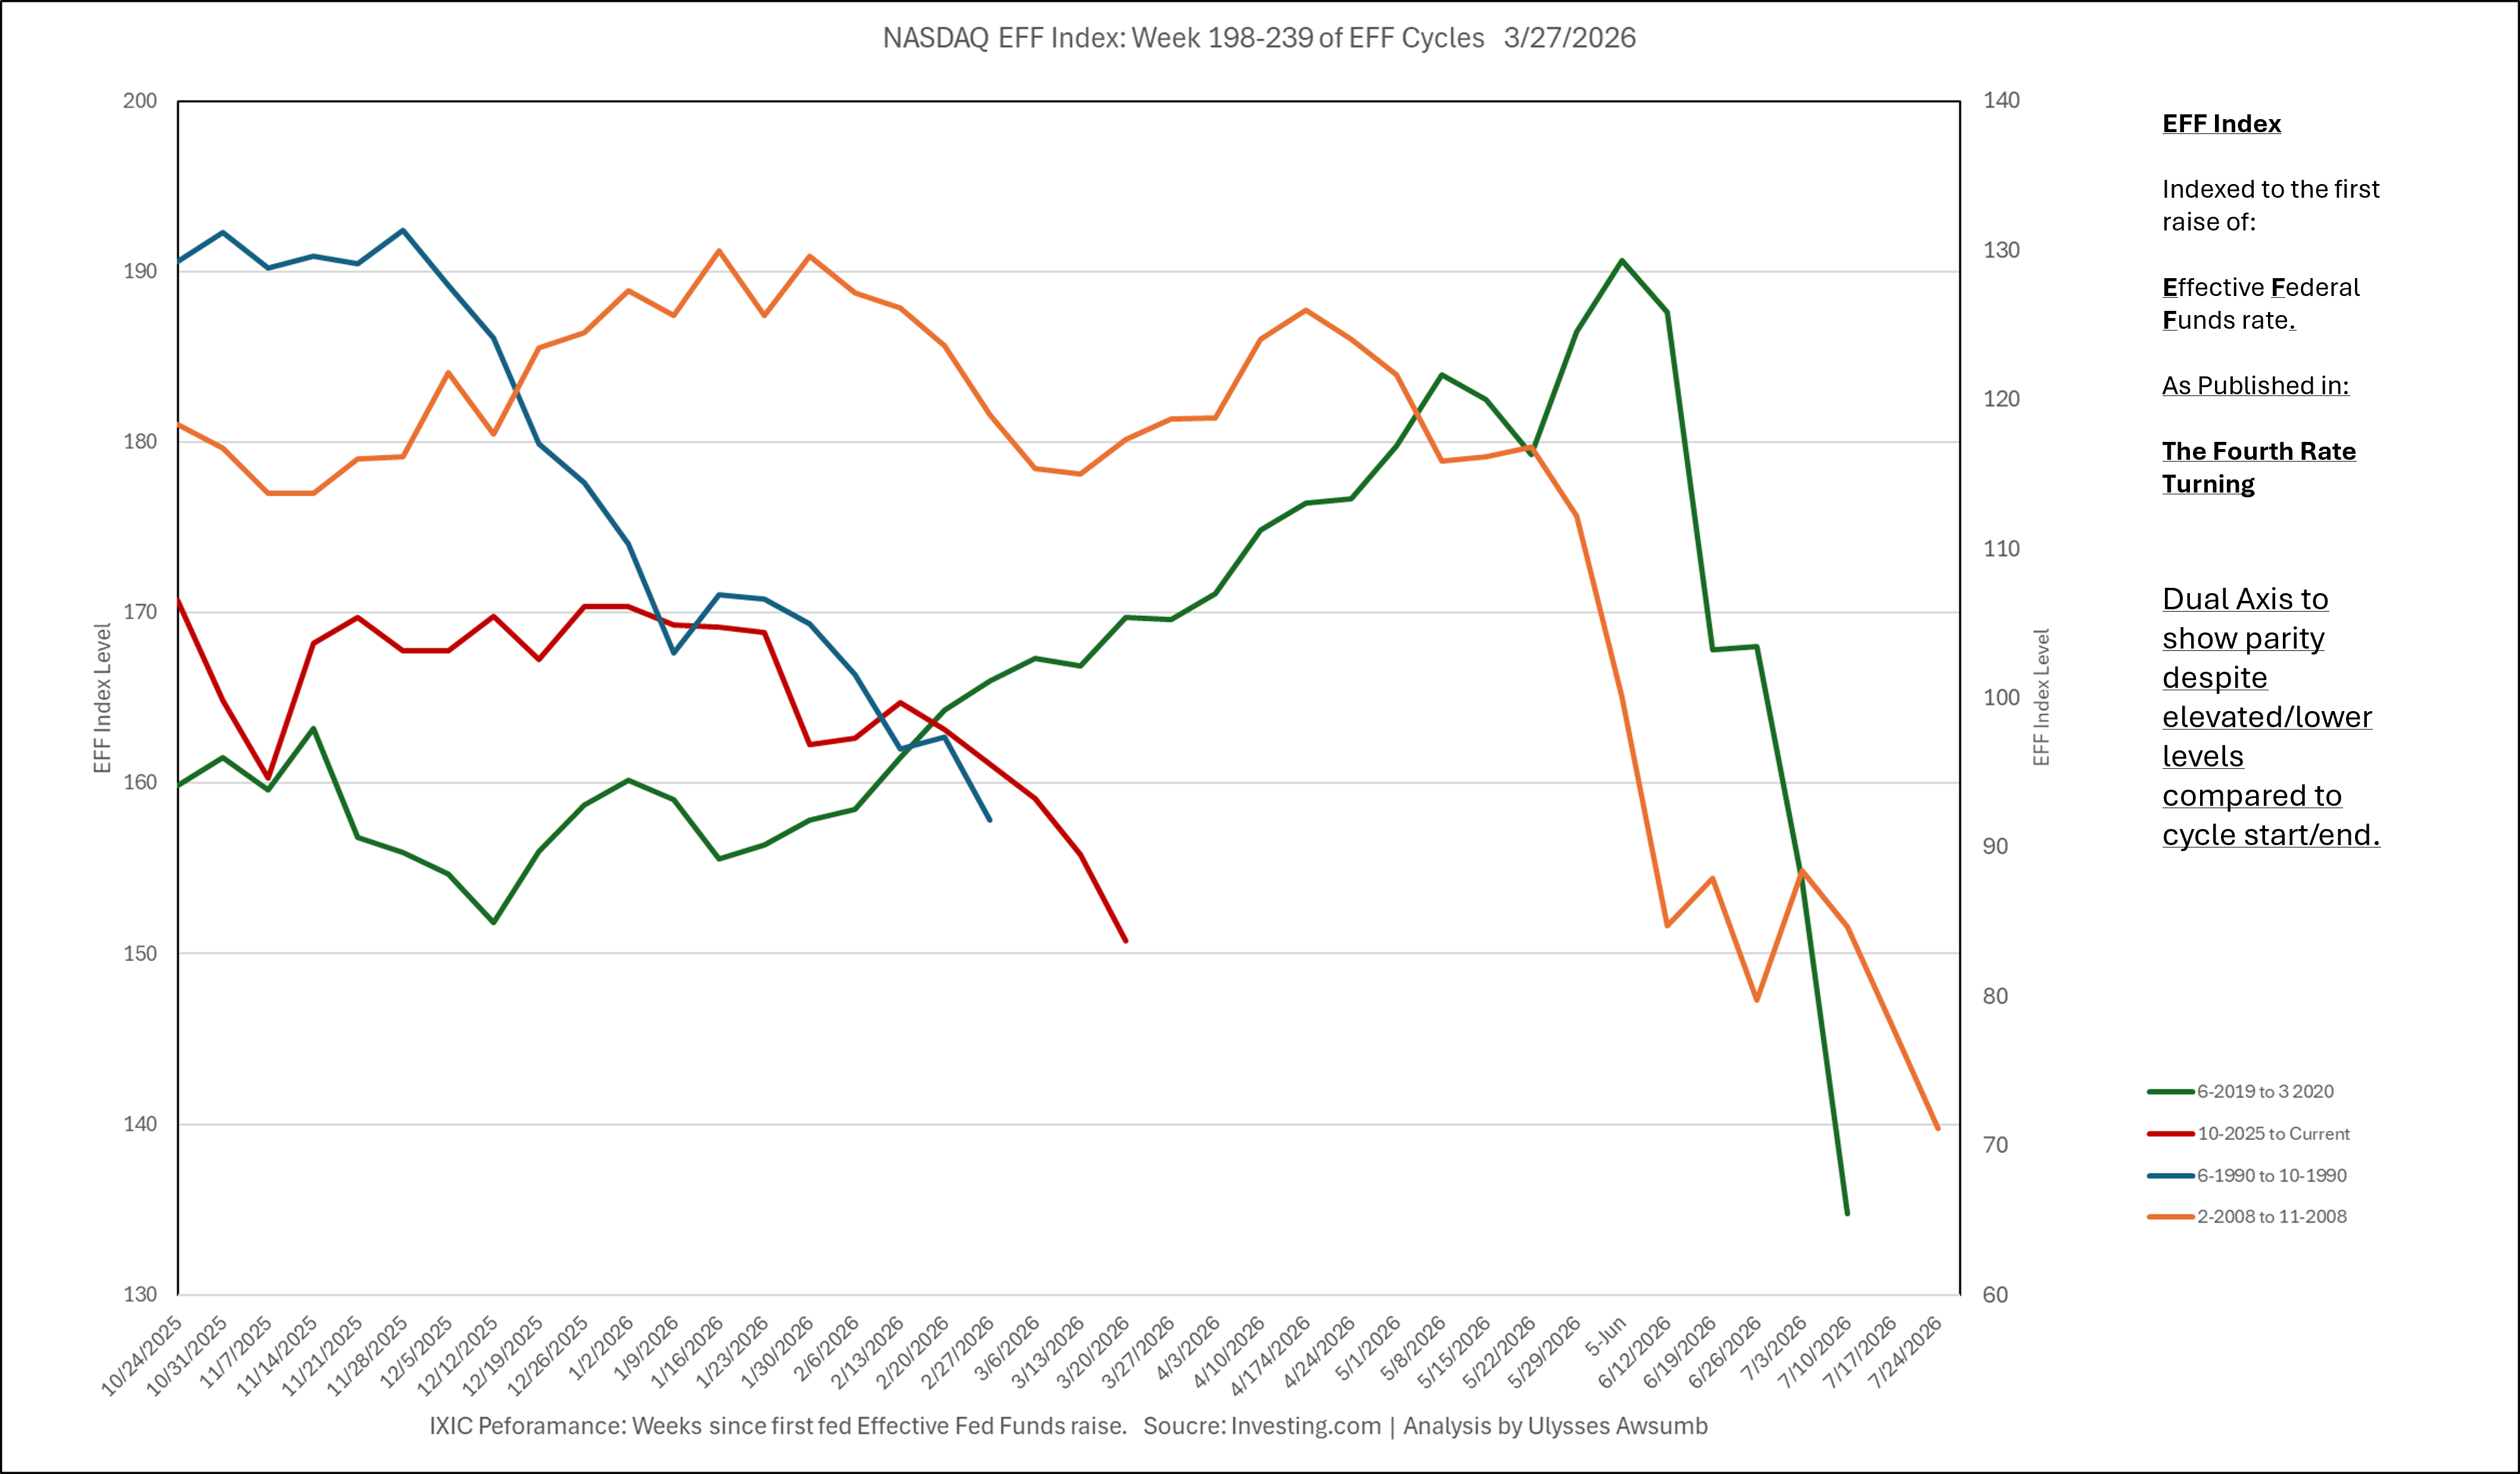
Before I get to targets, comparative draw downs and cycles, of the past in NASDAQ.
Technical Difficulty
Or analysis. By magic and other means. First though this is your reminder:
None of this is investment or financial advise. I am not a stock trader, I am not a market maker, I am not actually in control of the markets.
I am, though paying attention to human behavior and when reactions shift.
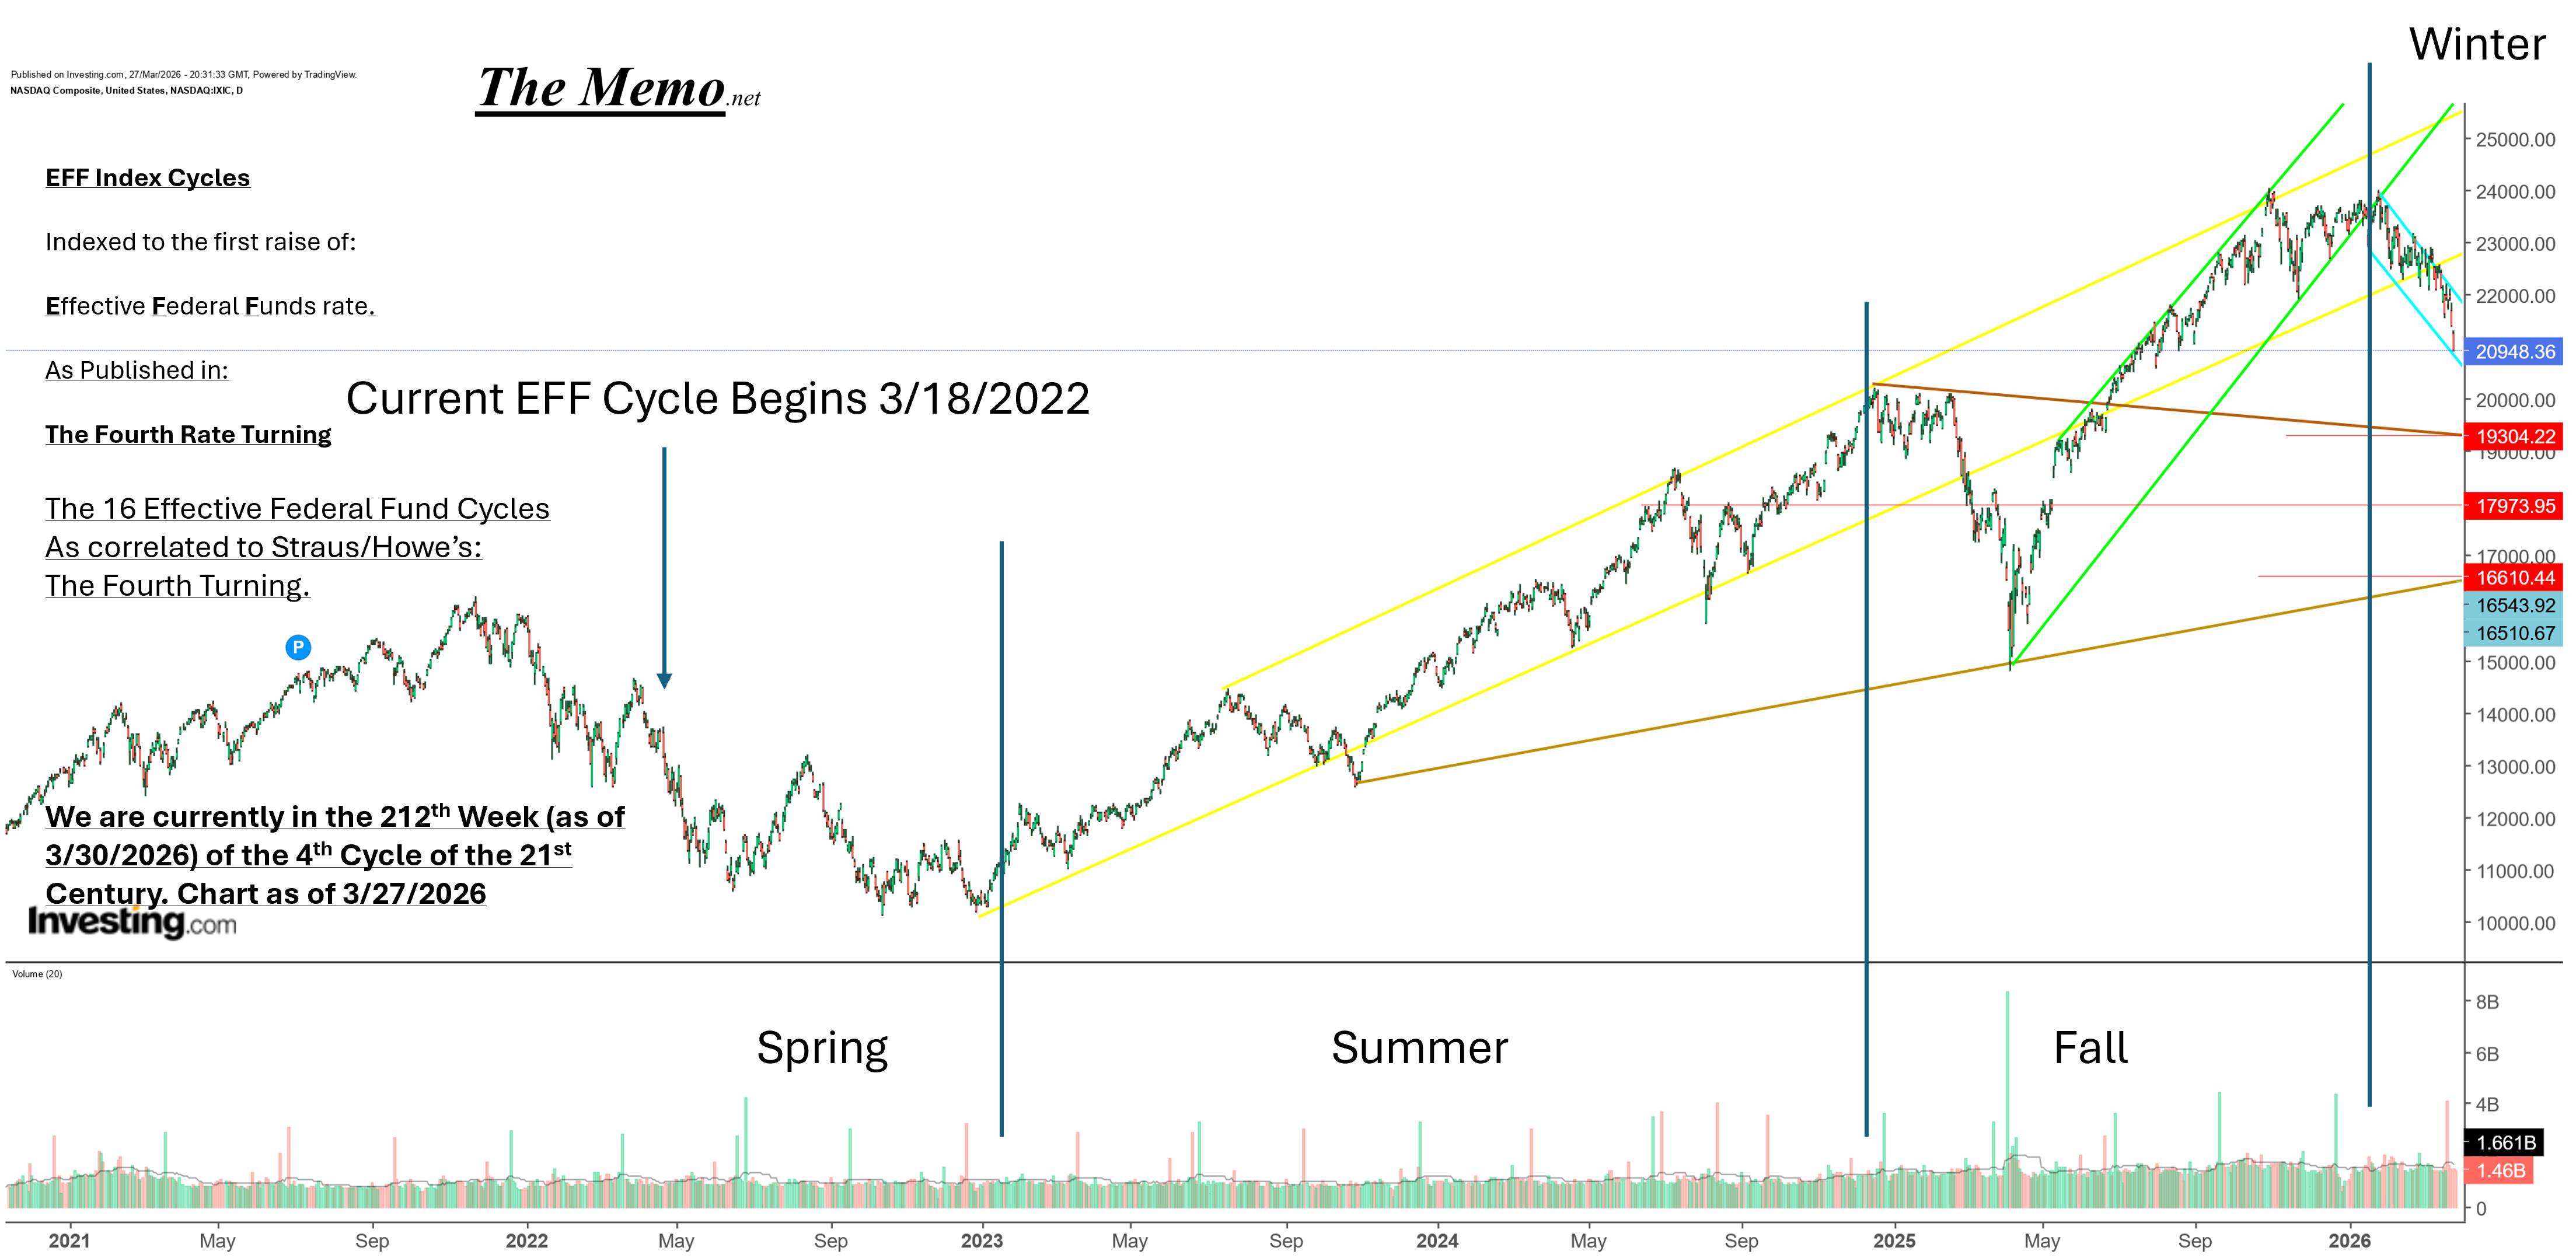
That said, my target levels for where the NASDAQ ends up: Between 16,110 and 19,304 with midrange being 17,707, by end of July, with most of the damage being done in Q2.
There’s two ways I’ve come to this conclusion, 1st, from my last post:
“Based on average of the broken out cycles as mentioned, the next drawdown should see between -20-30%” -Me
-20% from ATH of 24,019 = 19,215
-30% from ATH of 24,019 = 16,813
The next way, as I’ve broken out in past posts, is by measuring the cycles “Spring,Summer,Fall, Winters” and the pattern that has emerged from behavioral reactions to index levels. I’ve laid out the reasoning for these already, I’m just going to sum up, by saying, each mini season has points by which we can see where future support levels will likely arise. And when I say “support” I mean humans seeing a number and remembering it, thinking “I should probably buy here”, “the price looks cheap here” etc etc. And when using this method, we can see price targets and by what manner of magic they are derived. Target range highlighted in red below to the right on the technical analysis
Sometimes anomalies just need time to be understood.
There is always a potential for this too of course.
WTI Crude Oil
Nothing escapes the cost of money or human behaviors patterns. The only difference between past and present, is that we started this cycle with $100 per barrel oil. 100 remember is the price/point where the cycle begins (price divided by itself, multiplied by 100) Therefore 100 on the index is also, $100. Fun.
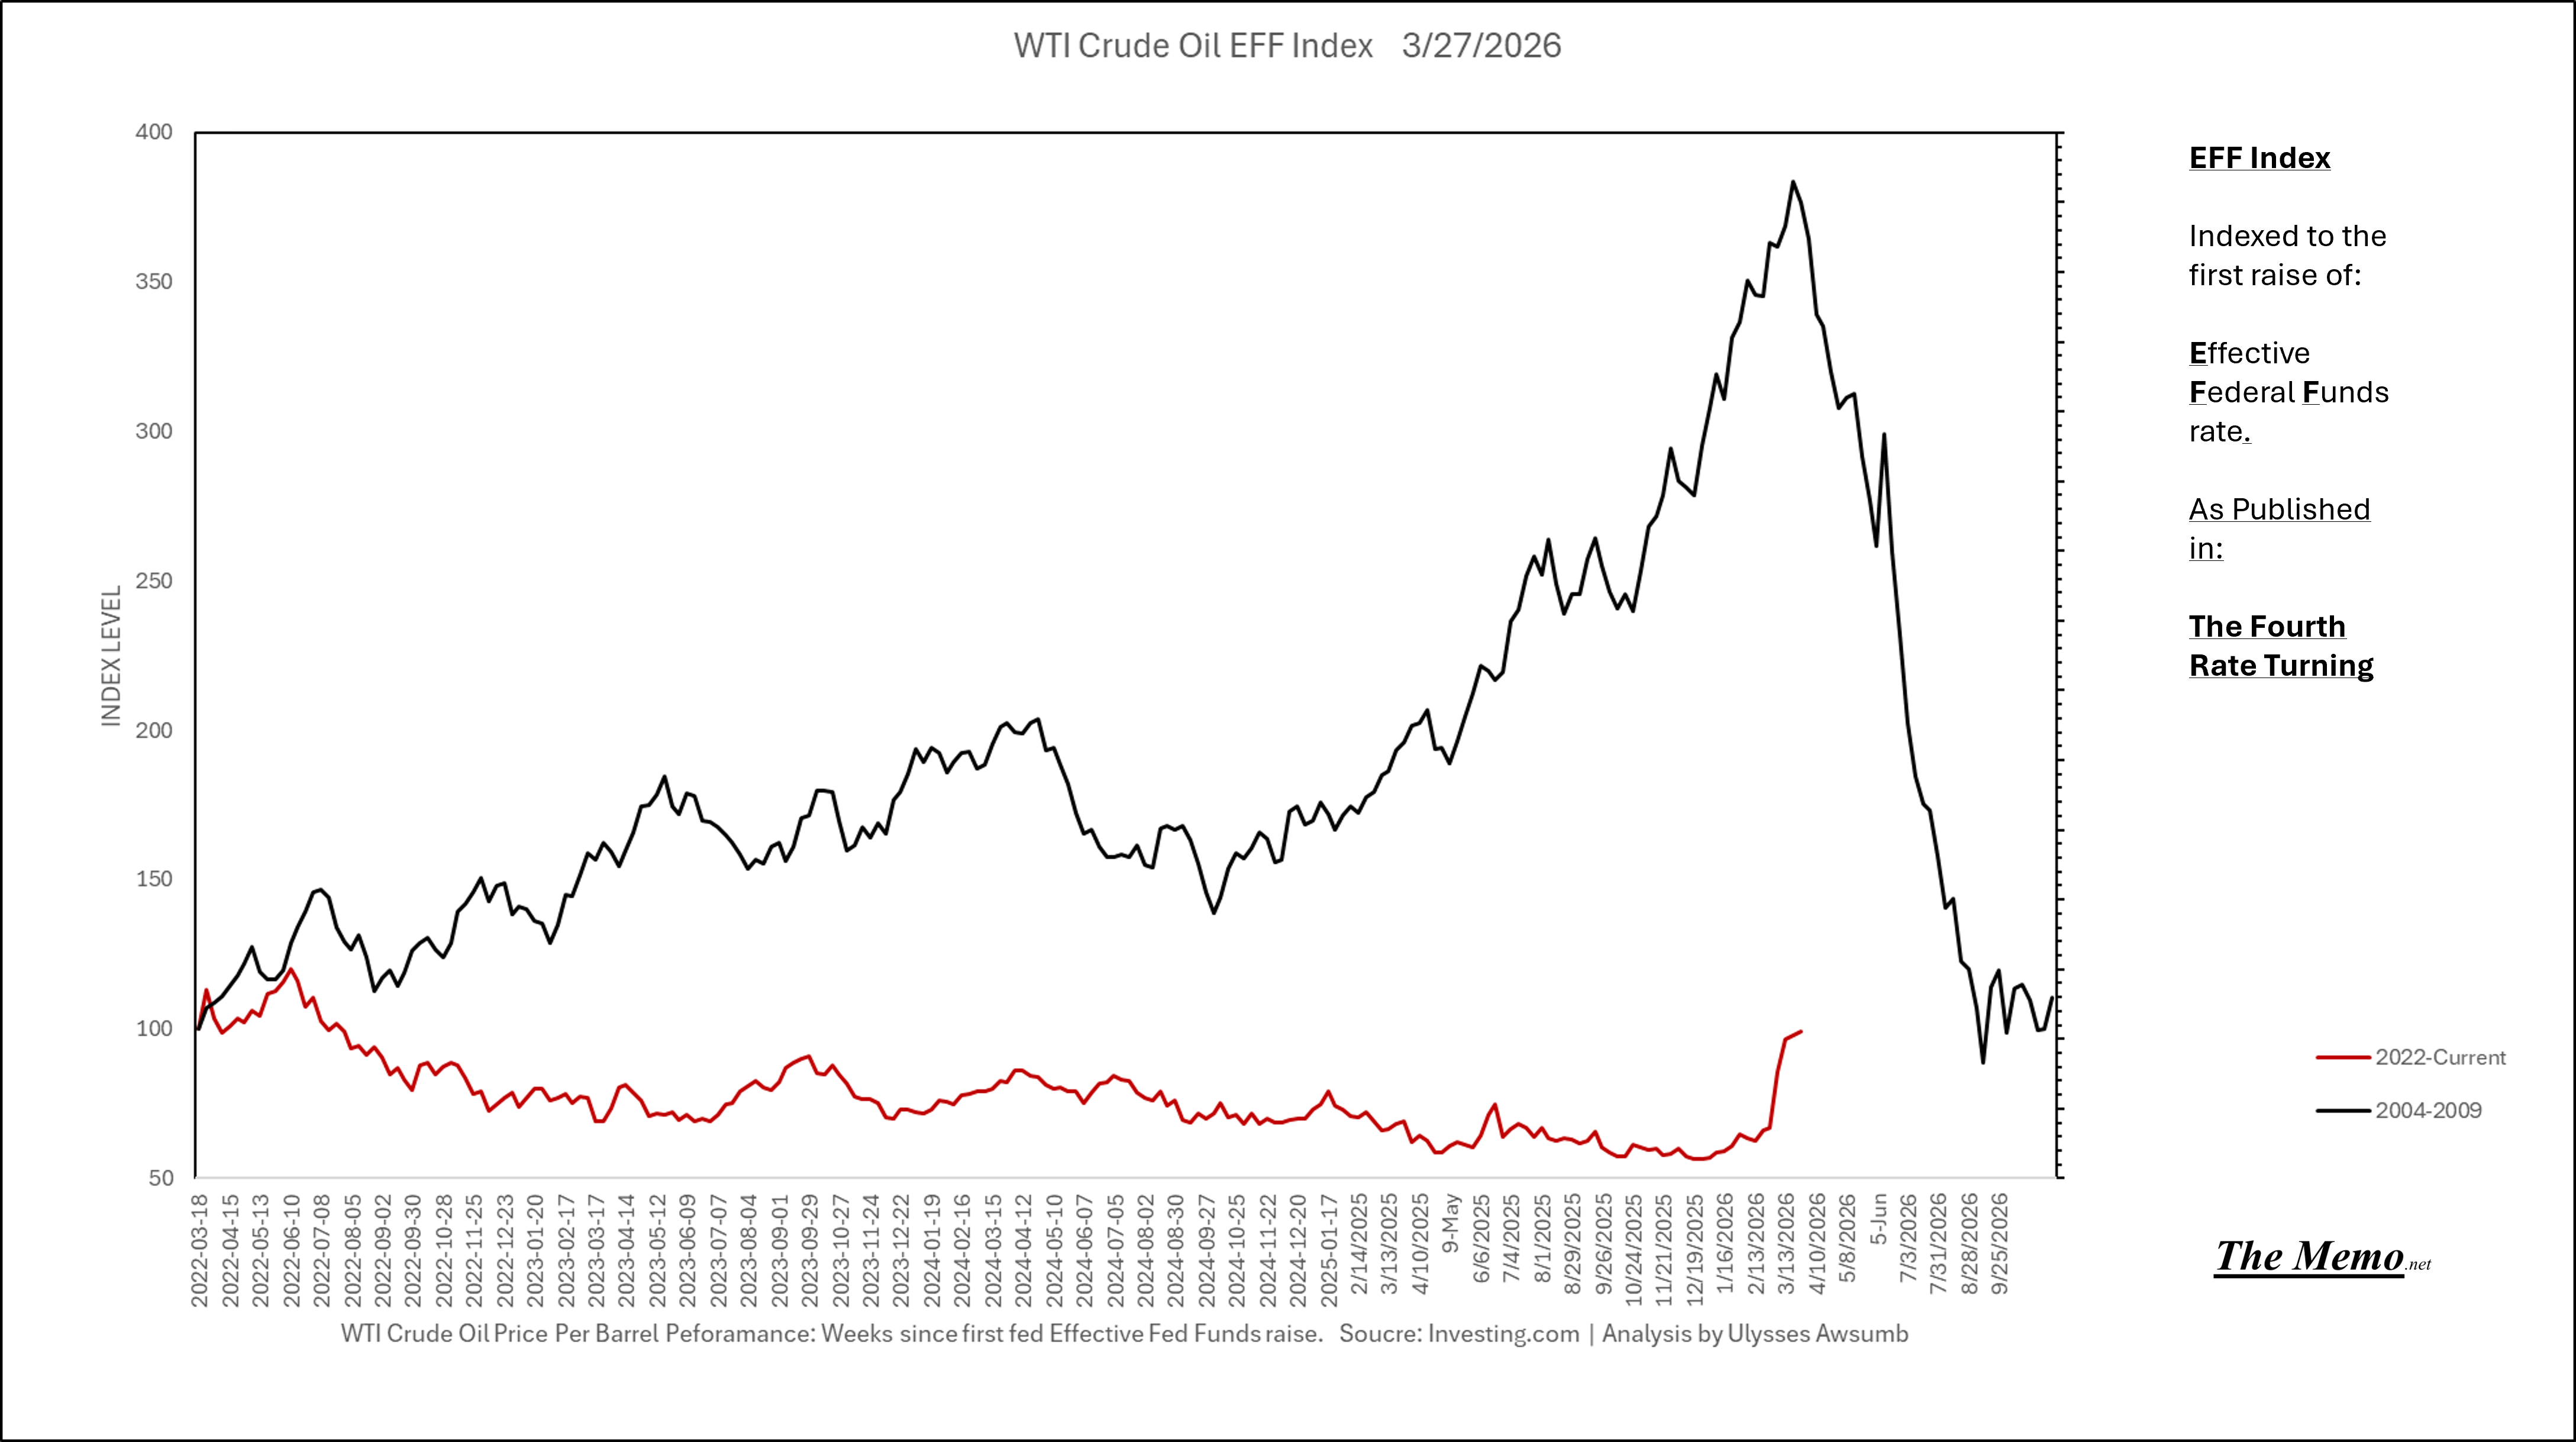
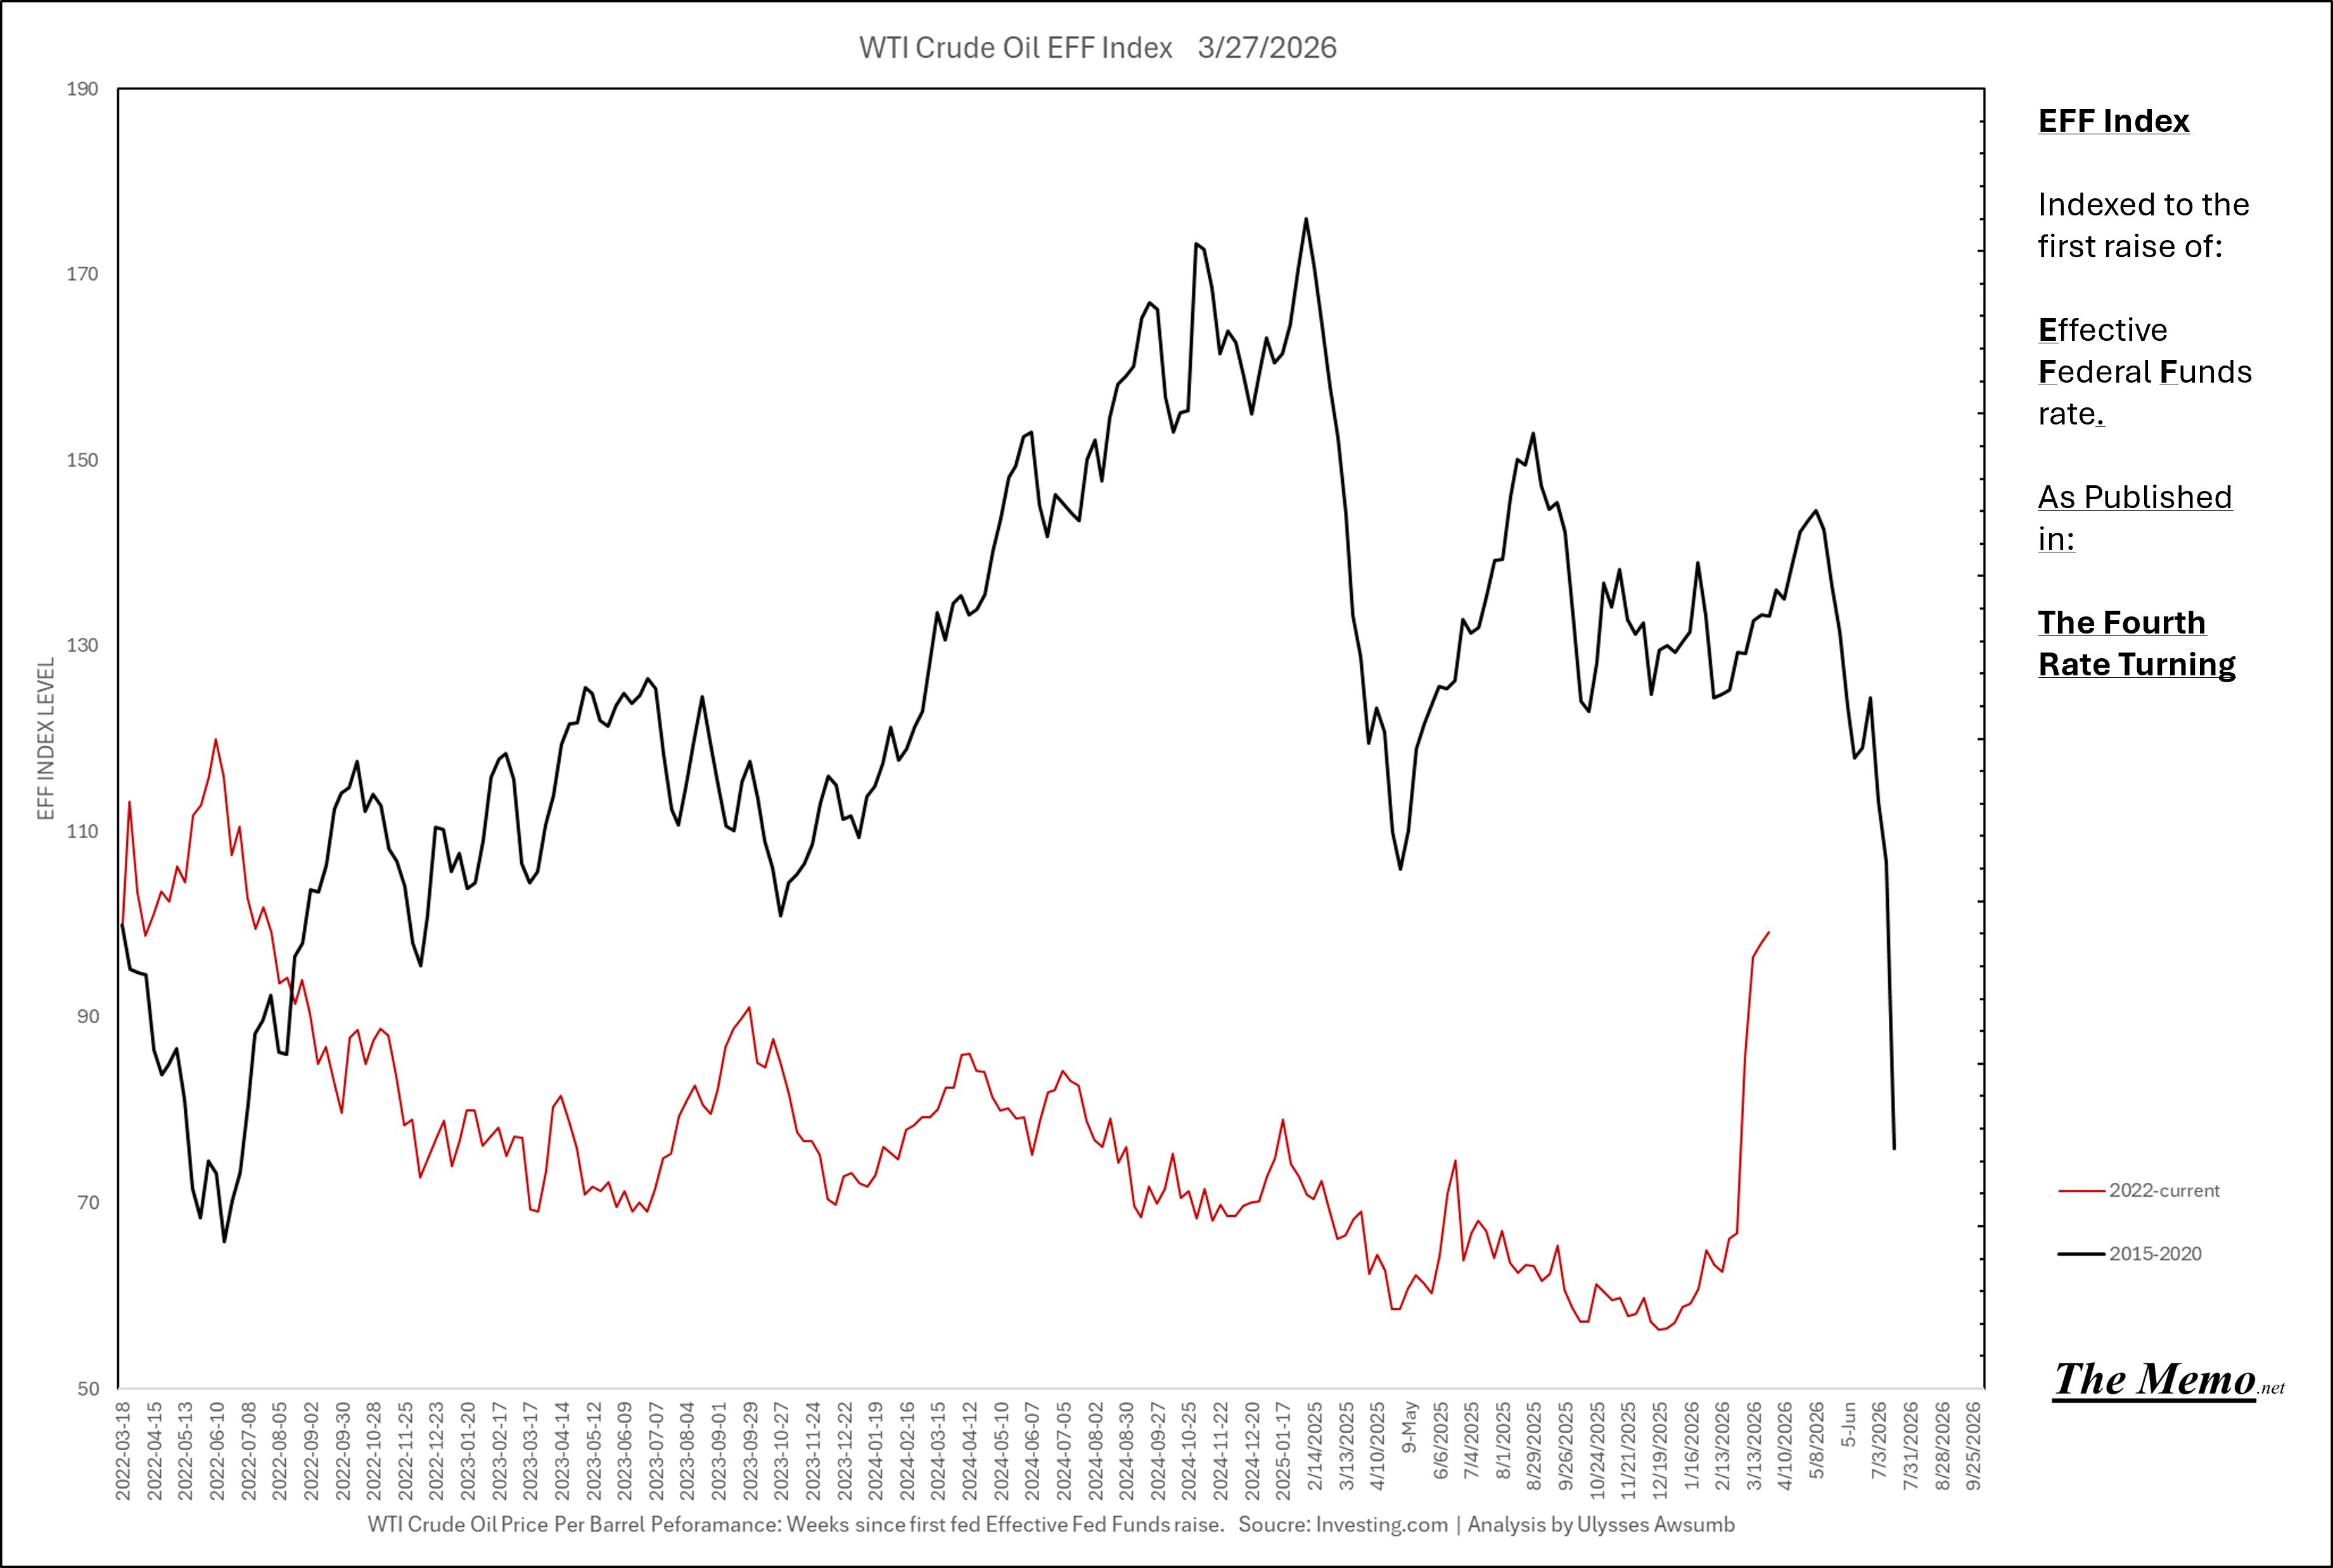
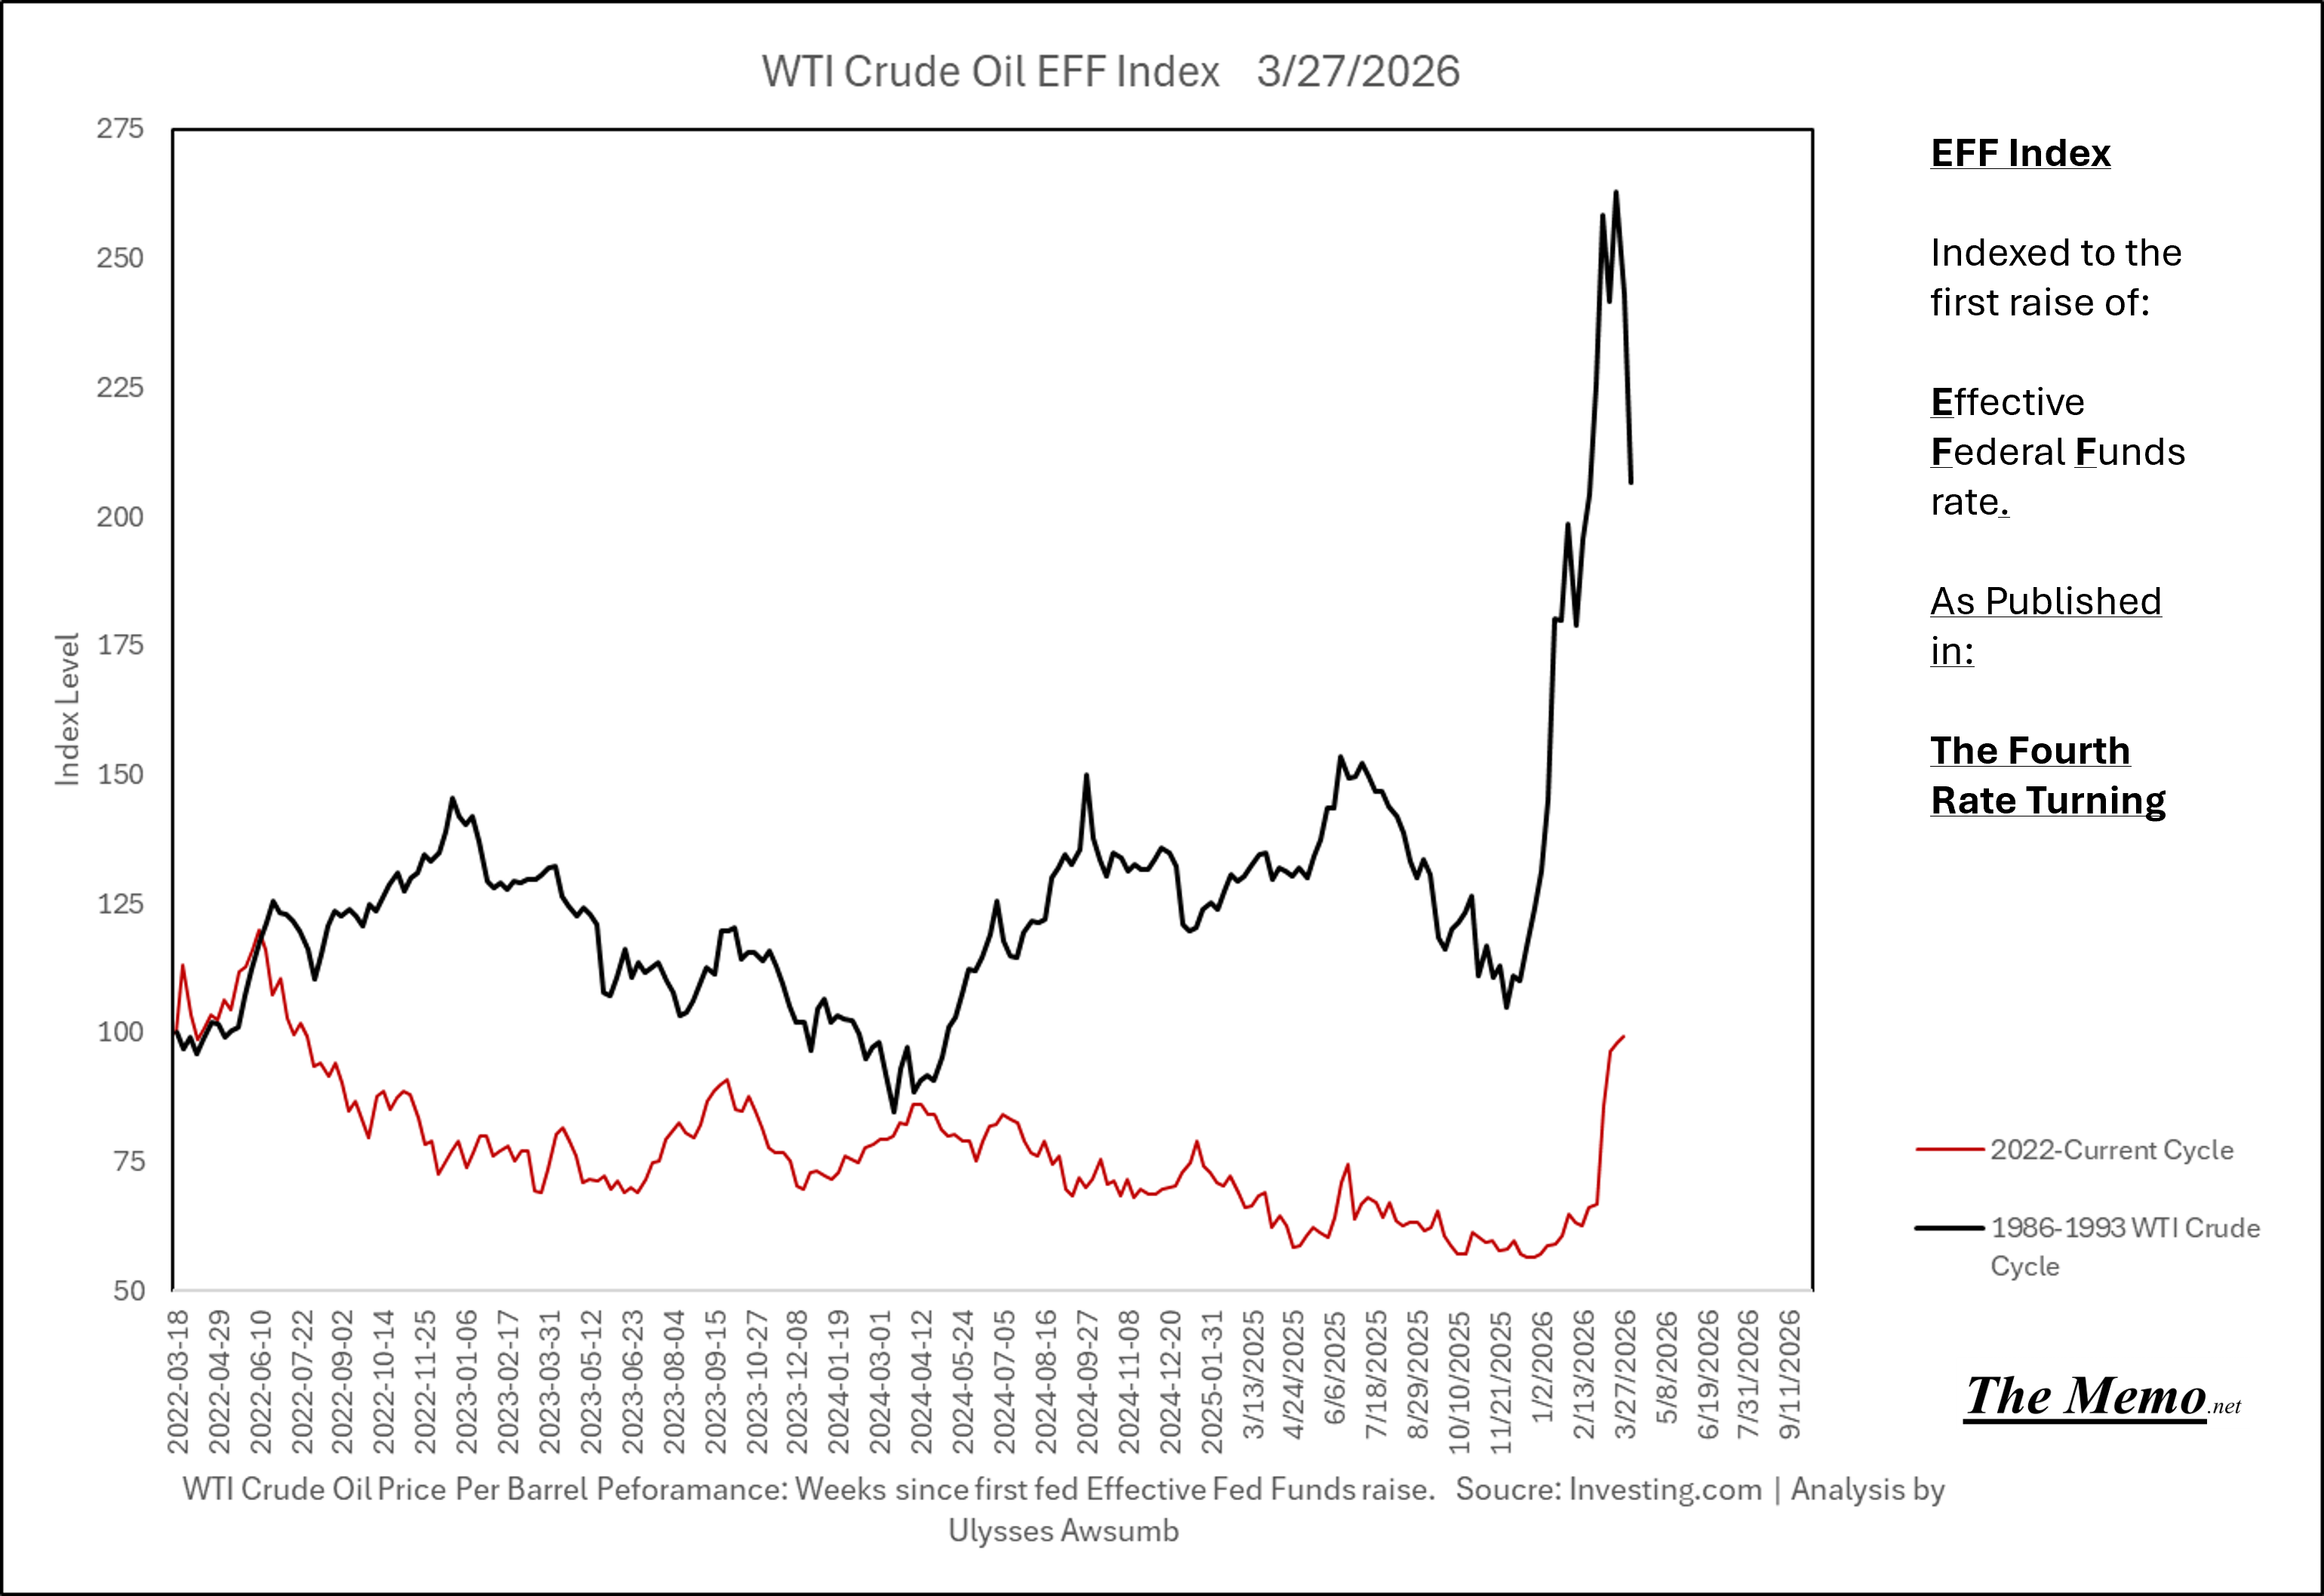
If we see a significant drop in oil prices this time (again), it will likely be because the current price tapped everyone out. Again. Demand destruction is not just a theoretical exercise, and government limitations on use can also be the cause.
You can’t say I haven’t told you we’ve been here before.